Production Readiness & Monitoring
Health check endpoint
![[object Object]](/content/files/courses/ColdFusion-2025-Foundations-5151cba6/module-4/4.lesson-production/__static__/cf-health-endpoint-flow-v1.png?v=1791349307475)
health.cfm tests the DB on every request and returns 200/503 — used by load balancers and container probes.
Every production ColdFusion application should expose a /health.cfm endpoint that (you will create it in Activity 1 later in this lesson):
- Tests the database connection
- Returns JSON with a
statusfield ("ok"or"degraded") - Returns HTTP 200 when healthy, 503 when degraded
<!--- health.cfm --->
<cfscript>
  status   = "ok";
  httpCode = 200;

  try {
    queryExecute("SELECT 1", {}, {datasource: "training_db"});
  } catch (any e) {
    status   = "degraded";
    httpCode = 503;
  }

  cfheader(statuscode=httpCode);
  cfheader(name="Content-Type", value="application/json");

  writeOutput(serializeJSON({
    "status":    status,
    "timestamp": dateTimeFormat(now(), "yyyy-mm-dd'T'HH:nn:ssXXX"),
    "version":   "1.0.0"
  }));
</cfscript>
Log aggregation
ColdFusion writes logs to /opt/coldfusion2025/cfusion/logs/. Tail the application log:
tail -f /opt/coldfusion2025/cfusion/logs/application.log
Key log files:
| File | Contents |
|---|---|
application.log | Unhandled CF errors |
scheduler.log | cfschedule task results |
exception.log | Java-level exceptions |
mail.log | cfmail send/fail events |
server.log | CF server start/stop events |
Monitoring from the command line
The Performance Monitoring Toolset (pmtagent) requires an external Elastic Stack and is not available in this lab. Instead, use these CLI commands directly in the Terminal tab:
Tail the live application log:
tail -f /opt/coldfusion2025/cfusion/logs/application.log
Check CF server memory (JVM heap):
ps -o pid,rss,vsz,comm -p $(pgrep -f "box server start")
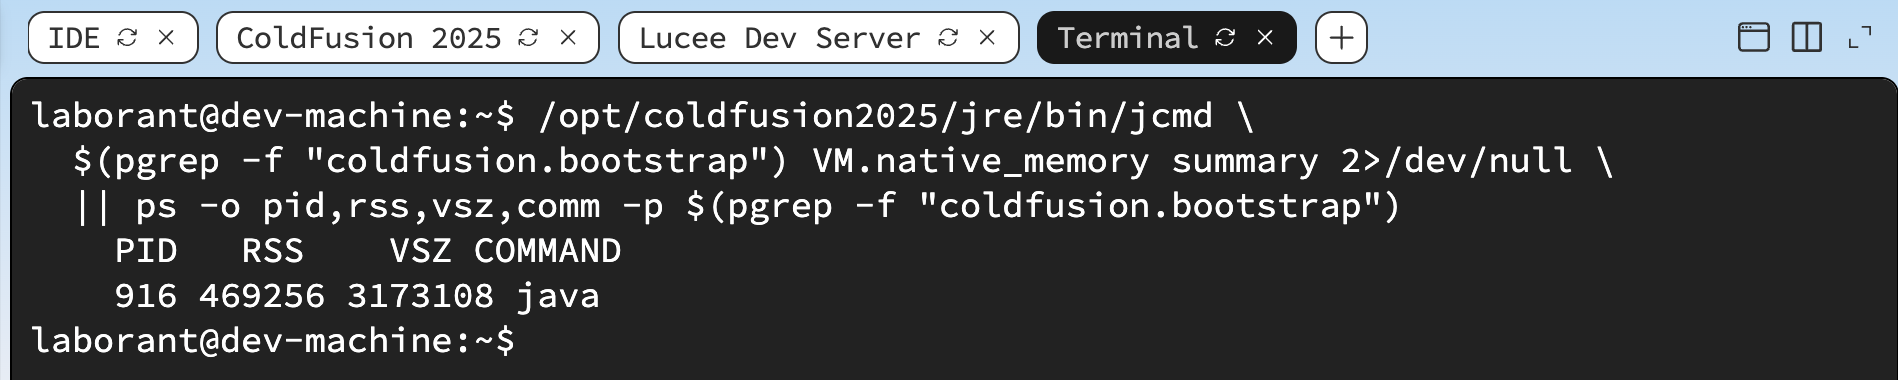
Your lab VM output — ps fallback when jcmd native memory is unavailable.
Reading the JVM memory numbers
The ps command reports memory in kilobytes (KB). Here is what each column means for the ColdFusion JVM process:
| Column | Value (your lab) | What it means |
|---|---|---|
PID | 916 | Process ID of the Java/ColdFusion process |
RSS | 469,256 KB ≈ 458 MB | Resident Set Size — RAM actually held in physical memory right now. This is the real memory cost. |
VSZ | 3,173,108 KB ≈ 3.0 GB | Virtual Size — total address space reserved by the JVM, including memory-mapped files, shared libraries, and pre-allocated heap that may not yet be in RAM. This number is always much larger than RSS and is normal to ignore. |
COMMAND | java | The JVM process running ColdFusion |
Rule of thumb: watch RSS, not VSZ.
- RSS < 512 MB on a fresh lab VM is healthy — that is exactly what your output shows.
- If RSS climbs above 1 GB during normal use, check for memory leaks in your CFCs (large Application-scoped objects, unclosed queries, etc.).
- ColdFusion's default JVM heap is set in
/opt/coldfusion2025/cfusion/bin/jvm.config— look for the-Xmxflag. The default in this image is-Xmx512m.
Watch active CF threads:
watch -n 2 "ps -eLf | grep java | grep -v grep | wc -l"
Note: In this lab ColdFusion runs as a different system user, so
watchcan only see the process name (java) — not the full command line. Counting alljavathreads is fine here because ColdFusion/CommandBox is the only Java process running. A healthy idle server shows 100–150 threads.
💡 What does your thread count actually mean?
A thread is a unit of work the JVM can run concurrently. ColdFusion/CommandBox spins up many threads at startup and keeps them alive — most are idle, waiting for something to do.
Your number will not be exactly 138 — it depends on when the server started, how many requests it has served, and the host machine. That is normal. Here is a breakdown of what makes up a typical count:
| Thread group | What it does | Rough count |
|---|---|---|
| CF request workers | Handle incoming HTTP requests — one thread per active request | 20–40 |
| JVM GC threads | Garbage collector — reclaims unused memory automatically | 4–8 |
| CommandBox internals | OSGi framework, WireBox DI, module loaders | 20–40 |
| CF scheduler | Runs cfschedule tasks in the background | 2–5 |
| JVM housekeeping | Signal handlers, finalizers, JIT compiler, RMI | 10–20 |
| CF datasource pool | Keeps DB connections warm and ready | 5–10 |
Is your count good or bad?
- ✅ 100–160 at idle — normal and healthy for a CommandBox-managed CF server
- ⚠️ 160–250 — elevated; CF may be handling a burst of requests or a slow query is holding threads
- 🔴 250+ — investigate immediately; possible thread leak, runaway scheduler task, or a query never returning
The key question is not the absolute number — it is whether the count keeps climbing.
Run watch for 30 seconds with no traffic hitting the server. If the number stays flat → healthy. If it climbs steadily → something is leaking threads.
# See which threads are consuming the most CPU right now
ps -eLo pid,lwp,pcpu,nlwp,comm | grep java | grep -v grep | sort -k3 -rn | head -10
Each line shows: PID LWP %CPU NLWP COMMAND — LWP is the thread ID, %CPU is its current load.
What %CPU means here:%CPU is the percentage of one CPU core that thread consumed during the last measurement interval. On a single-core VM the total across all threads cannot exceed 100. On a 4-core machine it can reach 400 (4 × 100%).
What to expect at idle:
- Most threads →
0.0— parked, waiting for work, consuming nothing - JVM GC thread → occasional brief spikes to
1.0–3.0, then back to0.0— normal - JIT compiler thread → short bursts at startup, then settles to
0.0
Why 5.0+ on an idle server is a red flag:
A single thread sitting at 5.0% or above with no incoming requests means it is burning CPU for a reason that has nothing to do with serving users. Common causes:
| Cause | What is happening |
|---|---|
Runaway cfschedule task | A scheduled job is looping, hitting an infinite loop or a slow external API |
| GC thrashing | The heap is nearly full — the GC thread spins constantly trying to free memory but can't keep up |
| Infinite loop in a CFC | A background thread started with cfthread never exited cleanly |
| ORM session not closed | Hibernate is retrying a failed transaction in a background thread |
How to act on it:
- Note the
LWP(thread ID) of the hot thread - Run a thread dump:
kill -3 $(pgrep -f "box server start") - Check
/opt/coldfusion2025/cfusion/logs/application.log— the dump is appended there - Search for the
LWPconverted to hex (e.g. LWP916→0x394) to find that thread's exact stack trace
That stack trace will tell you the exact ColdFusion template and line number the thread is stuck on.
Check datasource configuration:
# List registered datasources and their JDBC URLs (no JVM startup needed)
grep -E "<var name='NAME'>|<var name='url'>|<var name='CLASS'>" \
  /opt/coldfusion2025/cfusion/lib/neo-datasource.xml \
  | grep -o ">.*<" | tr -d '><'
Test live datasource connectivity:
# health.cfm already runs SELECT 1 — use it as your connectivity probe
# (complete Activity 1 first to create this file)
curl -s http://localhost:8500/student/health.cfm
Note:
box cfconfig datasourceListlaunches a second JVM and will be killed by the OS on this lab VM (only ~512 MB RAM). Readneo-datasource.xmldirectly instead — it is the source of truth CF reads at startup.
View recent exceptions:
tail -40 /opt/coldfusion2025/cfusion/logs/exception.log
💡 What to look for in exception.log — and what it means
exception.log records Java-level exceptions — the things ColdFusion could not handle gracefully. Unlike application.log (which catches CF errors your code handles), entries here are unexpected crashes.
The three things that matter on each line:
| Field | What to read |
|---|---|
| Timestamp | Is this old or happening right now? A single entry from last week is noise. The same error repeating every 30 seconds is a problem. |
| Exception class | The Java class name tells you the category — NullPointerException, OutOfMemoryError, SQLException, SocketTimeoutException |
| Message / caused by | The actual reason — e.g. No suitable driver found for jdbc:... means a datasource is misconfigured |
Common entries and what they mean:
| Exception | Likely cause | Action |
|---|---|---|
java.lang.OutOfMemoryError | JVM heap exhausted | Increase -Xmx in jvm.config, check for memory leaks |
java.sql.SQLException | Bad query, wrong credentials, or DB unreachable | Check datasource config and DB logs |
java.net.SocketTimeoutException | cfhttp or web service call timed out | Add timeout handling in your CFML, check the remote endpoint |
coldfusion.runtime.UndefinedVariableException | Variable used before it was set | Fix the CFML — add <cfparam> or null checks |
java.lang.NullPointerException | CF tried to call a method on a null object | Usually a CFC returning nothing when the caller expected a value |
The key takeaway: one exception entry is not an emergency. A pattern — the same exception repeating at regular intervals with no user traffic — means something in your application is silently broken in the background. That is what you are hunting for.
# Count how many times each exception type appears — spot patterns instantly
grep "^\"" /opt/coldfusion2025/cfusion/logs/exception.log \
  | awk -F'"' '{print $2}' | sort | uniq -c | sort -rn | head -10
Why health.cfm matters beyond this lab
You just built health.cfm as a learning exercise — but this same pattern is used in real production systems every day. Here is why it exists.
The problem it solves:
When a load balancer sits in front of your ColdFusion server (which is standard in any production setup), it needs a way to know whether your server is actually able to handle requests right now — not just whether the process is running, but whether the application is healthy. The process can be running while the database is down, the connection pool is exhausted, or a deployment is half-finished. Without a health endpoint, the load balancer sends traffic to a broken server and users get errors.
How it is used:
Any monitoring system, load balancer, or deployment tool can call GET /health.cfm and make a decision based on the HTTP status code:
| HTTP response | Meaning | What happens |
|---|---|---|
200 OK + {"status":"ok"} | App is healthy, DB is reachable | Load balancer keeps sending traffic |
503 Service Unavailable + {"status":"degraded"} | DB is down or app is broken | Load balancer stops sending traffic, ops team gets alerted |
| No response / timeout | Server process is dead | Restart is triggered automatically |
You do not need Docker or Kubernetes to use this. Even a simple cron job checking your endpoint every minute and sending you an email on failure is a health check. The endpoint you built is the standard way to expose application health — the consumer of that endpoint (load balancer, cron, monitoring tool, container orchestrator) is a separate concern.
💡 Where does this go in the real world?
To build resilient and scalable systems, companies run their applications inside containers managed by orchestration platforms like Docker and Kubernetes. These platforms need a reliable way to know if your application is healthy — and health.cfm is exactly what they call.
That topic is out of scope for this course, but if you want to go deeper: Introduction to Kubernetes is the place to start.
ColdFusion in real deployment environments
How companies actually deploy ColdFusion varies widely. There is no single standard, but a few patterns are common:
The typical 3-stage pipeline:
![[object Object]](/content/files/courses/ColdFusion-2025-Foundations-5151cba6/module-4/4.lesson-production/__static__/cf-deployment-pipeline-v1.png?v=1791349307475)
Code moves left to right — only promoted after review or tests pass at each stage.
| Stage | What runs | Purpose |
|---|---|---|
| Dev | Local machine or shared dev server | Write and test code quickly, no real traffic |
| Test / QA | Staging server matching production config | Catch bugs before users see them, run automated tests |
| Production | Live server, real users | The real thing — monitored, backed up, deployed carefully |
The Lucee-on-dev, Adobe-on-prod reality:
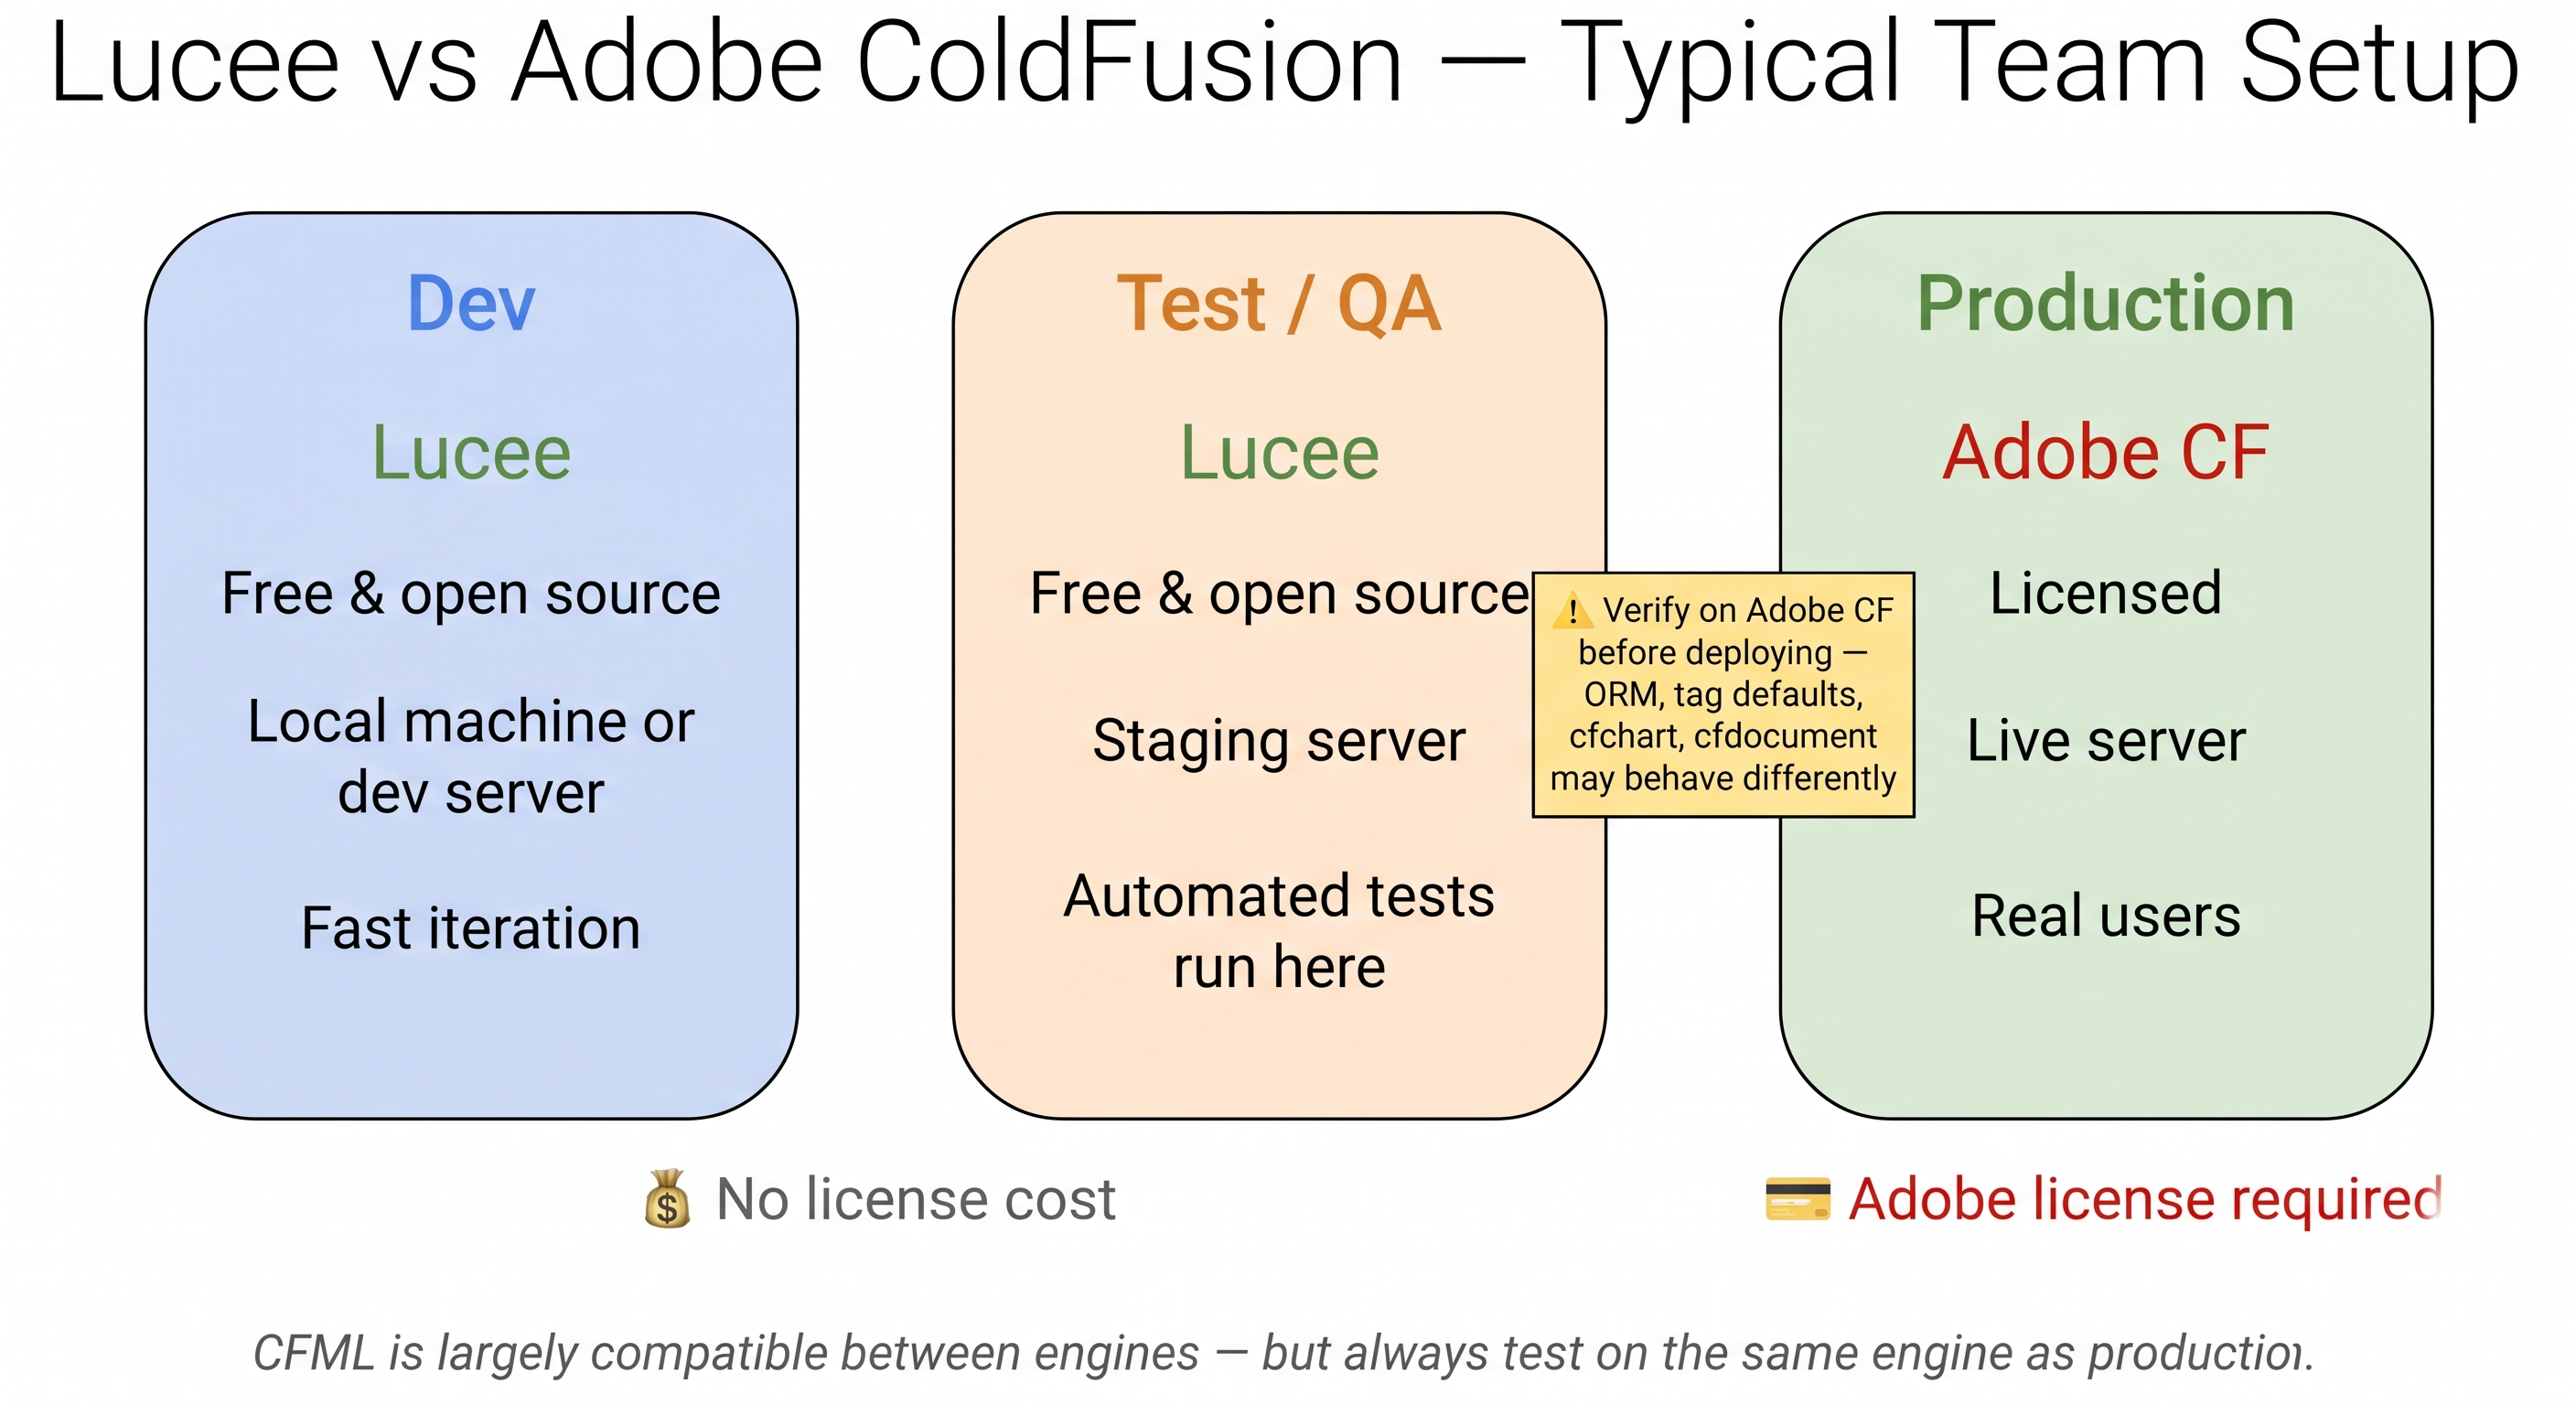
Dev and Test/QA run Lucee to keep costs down — Production runs Adobe ColdFusion under a commercial license.
Many ColdFusion teams run Lucee (free, open source) on dev and test environments to keep costs down, and only pay for Adobe ColdFusion licenses on production. This works because CFML is largely compatible between the two engines — but there are differences, especially around:
- ORM / Hibernate behaviour
- Some tag attributes and default values
- Java library versions bundled with each engine
cfchart,cfdocument, and other Adobe-specific packages
The safest approach is to run your test environment on the same engine and version as production. If that is not possible, test on Lucee but always verify on Adobe CF before deploying.
On uptime and availability:
Adobe ColdFusion comes in two deployment models:
| Model | What it is | Who owns uptime |
|---|---|---|
| Self-hosted | You install CF on your own server or cloud VM (AWS, Azure, GCP) | Your team or your cloud provider |
| Adobe ColdFusion for Cloud | Adobe's managed cloud offering — CF hosted and operated by Adobe on AWS, launched 2023 | Adobe |
For self-hosted deployments (the most common setup), uptime is the responsibility of whoever runs the infrastructure. Major cloud providers publish a 99.99% SLA for their virtual machines — roughly 52 minutes of downtime per year. Reaching that requires redundancy: multiple CF instances behind a load balancer, automated health checks, and automated restarts on failure.
For Adobe ColdFusion for Cloud, Adobe manages the infrastructure and publishes their own SLA — check the Adobe ColdFusion for Cloud documentation for the current terms, as these change over time.
Either way, health.cfm is your application's contribution to that uptime number — it is the signal that tells the infrastructure whether CF is ready to serve traffic.
Your health.cfm fits into this pipeline at every stage. Each environment should have its own health endpoint — same code, different datasource URLs — so your monitoring and deployment tools can probe any stage the same way.
💡 Blue/green deployments — zero-downtime releases
Blue/green is a deployment strategy where you run two identical environments — blue (current live) and green (new version). Traffic stays on blue while green starts up. Only after health checks pass on green does the load balancer switch traffic. If something breaks, you flip back to blue instantly.
Your health.cfm is exactly the check that gates that switch. This pattern is covered in depth in the CI/CD lesson earlier in this module. For further reading: Blue/Green Deployments — Martin Fowler.
Activity 1 — Create the health check endpoint
🚫 Seeing "File not found" in the browser? That is expected — read this first.
health.cfm does not exist yet. It only gets created when you run the tee command below in the Terminal tab.
If you browse to the ColdFusion tab or hit https://<your-lab-url>/health.cfm before completing this activity you will see ColdFusion's "File not found" error — that is completely normal.
Complete Activity 1 first, then open the browser tab. The file will be there.
What you are building: /opt/coldfusion2025/cfusion/wwwroot/student/health.cfm — a JSON endpoint that tests the database connection and returns the correct HTTP status code.
In the Terminal tab, run:
sudo tee /opt/coldfusion2025/cfusion/wwwroot/student/health.cfm << 'EOF'
<cfscript>
  status   = "ok";
  httpCode = 200;

  try {
    queryExecute("SELECT 1", {}, {datasource: "training_db"});
  } catch (any e) {
    status   = "degraded";
    httpCode = 503;
  }

  cfheader(statuscode=httpCode);
  cfheader(name="Content-Type", value="application/json");

  writeOutput(serializeJSON({
    "status":    status,
    "timestamp": dateTimeFormat(now(), "yyyy-mm-dd'T'HH:nn:ssXXX"),
    "version":   "1.0.0"
  }));
</cfscript>
EOF
✏️ Using the IDE tab instead? Create the file here
In the IDE tab, click File → Open Folder…, type /opt/coldfusion2025/cfusion/wwwroot/student and press Enter. Right-click in the Explorer panel → New File → name it health.cfm, paste the content below, and save with Ctrl+S:
<cfscript>
  status   = "ok";
  httpCode = 200;

  try {
    queryExecute("SELECT 1", {}, {datasource: "training_db"});
  } catch (any e) {
    status   = "degraded";
    httpCode = 503;
  }

  cfheader(statuscode=httpCode);
  cfheader(name="Content-Type", value="application/json");

  writeOutput(serializeJSON({
    "status":    status,
    "timestamp": dateTimeFormat(now(), "yyyy-mm-dd'T'HH:nn:ssXXX"),
    "version":   "1.0.0"
  }));
</cfscript>
Verify it returns valid JSON:
curl -s -w "\nHTTP: %{http_code}\n" http://localhost:8500/student/health.cfm
Activity 2 — Confirm the status field
The response JSON must contain a status field set to "ok" (DB reachable) or "degraded" (DB unreachable).
curl -s http://localhost:8500/student/health.cfm \
  | python3 -c "import sys,json; print(json.load(sys.stdin)['status'])"
Activity 3 — Confirm the HTTP status code
A healthy endpoint must return HTTP 200. If the DB is unreachable it must return HTTP 503. Any other code means the endpoint is not production-ready.
curl -s -o /dev/null -w "HTTP %{http_code}\n" http://localhost:8500/student/health.cfm
When all the checks above are green, this lesson is complete — and so is the course. 🎉
Found a bug or an issue with this lesson? Please reach out — your feedback helps improve the course for everyone.
📧 Alex — mercadoalexatgmail.com
- Previous lesson
- CI/CD for CFML Applications