Chart Generation and Management
What is cfchart?
ColdFusion's <cfchart> tag generates charts as PNG images directly on the server — no JavaScript charting library, no client-side rendering, no external dependencies. You point it at a query result and it produces an image that drops straight into a page with a normal <img> tag, or renders inline.
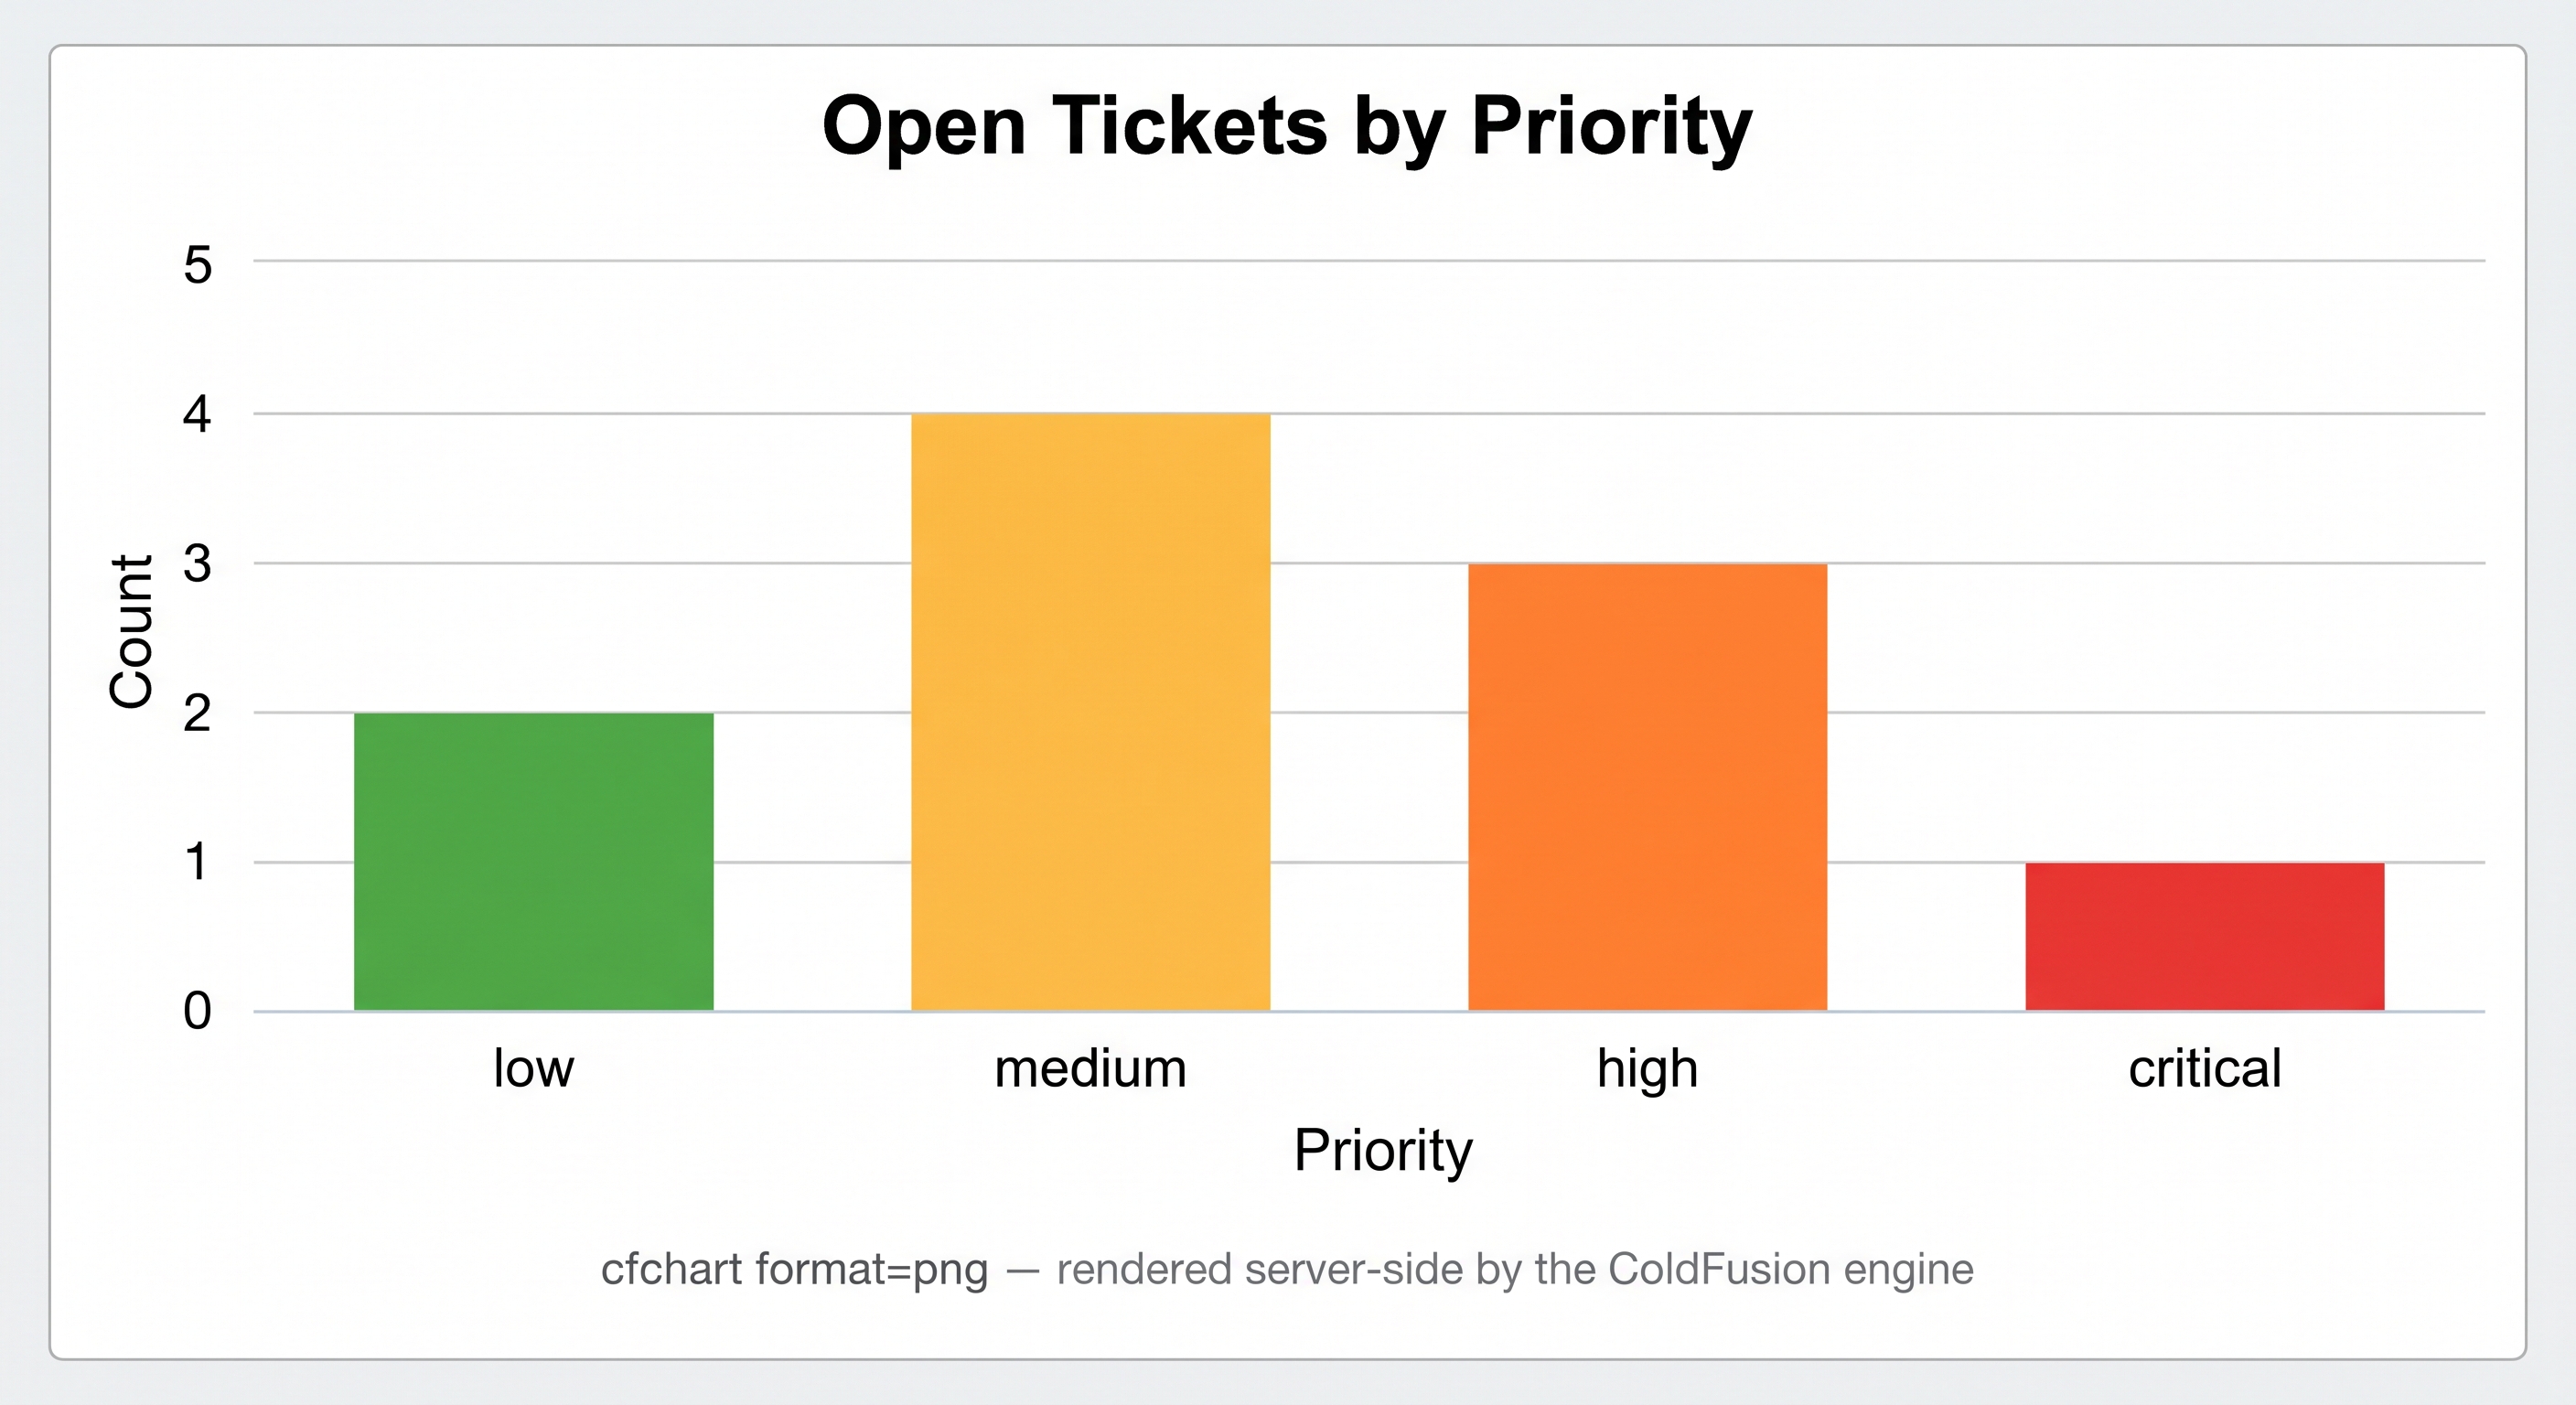
cfchart produces chart images server-side — no JavaScript library needed, the PNG is rendered by the ColdFusion engine.
The two tags you always use together:
| Tag | Role |
|---|---|
<cfchart> | Defines the chart container — size, format, title, 3D on/off |
<cfchartseries> | Defines one data series inside the chart — type, query, which columns to use |
One <cfchart> can contain multiple <cfchartseries> — useful for grouped or stacked charts.
Chart types
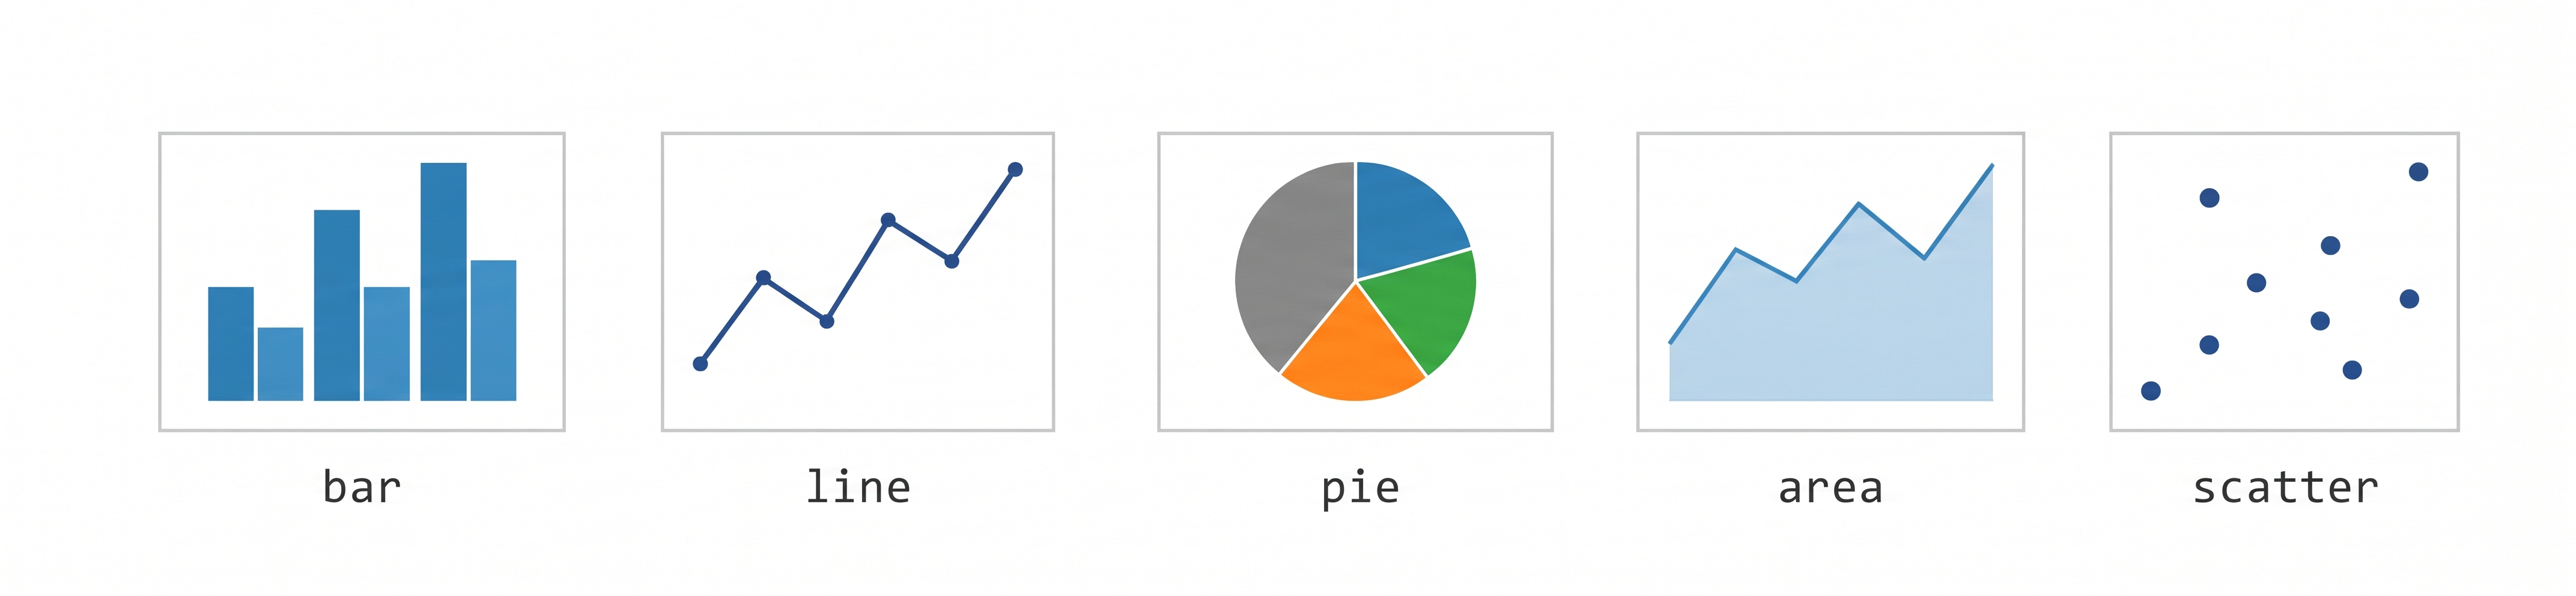
Available cfchartseries types — choose based on whether you are comparing categories, showing trends, or showing proportions.
| Type | Best for |
|---|---|
bar | Comparing values across categories (e.g. tickets per priority) |
line | Trends over time (e.g. tickets created per day) |
pie | Proportions of a whole (e.g. ticket share by status) |
area | Cumulative or stacked trends |
scatter | Correlation between two numeric variables |
Key cfchart attributes
<cfchart
  format      = "png"       <!-- png (default), jpg, flash -->
  chartwidth  = "600"       <!-- width in pixels -->
  chartheight = "400"       <!-- height in pixels -->
  title       = "My Chart"  <!-- heading displayed above the chart -->
  show3d      = "false"     <!-- true adds a 3D perspective effect -->
  backgroundColor     = "##ffffff"  <!-- background colour (## escapes # in CFML) -->
  name        = "myChart"   <!-- capture to variable instead of inline output -->
>
Why does the colour attribute use
In CFML, # is the delimiter for expressions — #myVar# outputs the value of myVar. Inside a tag attribute, a literal # sign must be escaped by doubling it: ##. So backgroundColor="##ffffff" means the literal colour #ffffff, not a variable named ffffff. You will see this pattern throughout cfchart colour attributes.
cfchartseries attributes
<cfchartseries
  type        = "bar"         <!-- chart type -->
  query       = "myQuery"     <!-- the cfquery to read data from -->
  itemcolumn  = "priority"    <!-- query column to use for x-axis labels -->
  valuecolumn = "total"       <!-- query column to use for y-axis values -->
  seriescolor = "##4A90D9"    <!-- colour of this series' bars/line/slices -->
  serieslabel = "Tickets"     <!-- legend label for this series -->
>
1. Bar chart — tickets by priority
The most common chart for comparing categories. Query the count of tickets grouped by priority, then feed that directly into a bar series:
<cfquery name="byPriority" datasource="training_db">
  SELECT priority, COUNT(*) AS total
  FROM   hd_tickets
  WHERE  status = 'open'
  GROUP  BY priority
  ORDER  BY total DESC
</cfquery>

<cfchart format="png" chartwidth="600" chartheight="400"
         title="Open Tickets by Priority" show3d="false">
  <cfchartseries type="bar" query="byPriority"
                 itemcolumn="priority" valuecolumn="total"
                 seriescolor="##4A90D9" serieslabel="Tickets">
  </cfchartseries>
</cfchart>
2. Pie chart — tickets by status
Pie charts show proportions. Use the same cfchart wrapper with type="pie" in the series:
<cfquery name="byStatus" datasource="training_db">
  SELECT status, COUNT(*) AS total
  FROM   hd_tickets
  GROUP  BY status
</cfquery>

<cfchart format="png" chartwidth="500" chartheight="400"
         title="Tickets by Status" show3d="false">
  <cfchartseries type="pie" query="byStatus"
                 itemcolumn="status" valuecolumn="total">
  </cfchartseries>
</cfchart>
How cfchart renders — server-side image generation explained
When ColdFusion processes a <cfchart> tag it does not send any chart code to the browser. Instead, the CFML engine calls its internal JFreeChart library (a Java charting engine bundled with ColdFusion since CF8) to render the chart into a bitmap in server memory. The result is a PNG (or JPG) byte array.
What happens by default (inline output):
ColdFusion writes the image bytes into a temporary file in its chart cache directory (/opt/coldfusion2025/cfusion/charting/), then emits an <img> tag pointing to that cached file. The browser requests the image as a second HTTP call — you will see this in browser dev tools as a separate request to /CFIDE/charting/....
What happens with name="myChart":
The image bytes are captured into a ColdFusion binary variable instead of being written to disk automatically. You then control what happens next — write it to a permanent file with <cffile>, serve it as a download, store it in a database blob, or pass it to another function.
JFreeChart vs modern alternatives:
JFreeChart is mature and dependency-free, but produces a raster (pixel) image. For interactive or high-DPI charts in modern web apps, developers often use JavaScript libraries (Chart.js, Highcharts, D3.js) on the client instead. cfchart remains the right choice when you need server-rendered images — PDF reports, email attachments, environments where JavaScript is restricted, or when simplicity matters more than interactivity.
Performance note:
Chart generation is CPU-bound. For high-traffic pages that always show the same chart, wrap the cfchart output in a cacheGet/cachePut block (using name="myChart" to capture the binary) so the image is only re-rendered when the underlying data changes.
3. Saving a chart to a file
Use name to capture the chart binary, then write it to disk with <cffile>:
<cfchart format="png" name="ticketChart">
  <cfchartseries type="bar" query="byPriority"
                 itemcolumn="priority" valuecolumn="total">
  </cfchartseries>
</cfchart>

<cffile action="write"
        file="#expandPath('/charts/tickets.png')#"
        output="#ticketChart#">
Serve it with a plain <img> tag: <img src="/charts/tickets.png" alt="Ticket chart">.
Activity 1 — Bar chart from live query data
Getting "The chart package is not installed"? Run these two commands in the Terminal.
ColdFusion 2025 ships the chart engine as an optional package that must be installed separately. This playground has it pre-installed, but if you are running this exercise on your own ColdFusion instance and see this error, fix it with two commands in the Terminal tab:
sudo /opt/coldfusion2025/cfusion/bin/cfpm.sh install chart
sudo /opt/coldfusion2025/cfusion/bin/coldfusion restart
Wait about 30 seconds for ColdFusion to restart, then reload /student/chart_demo.cfm.
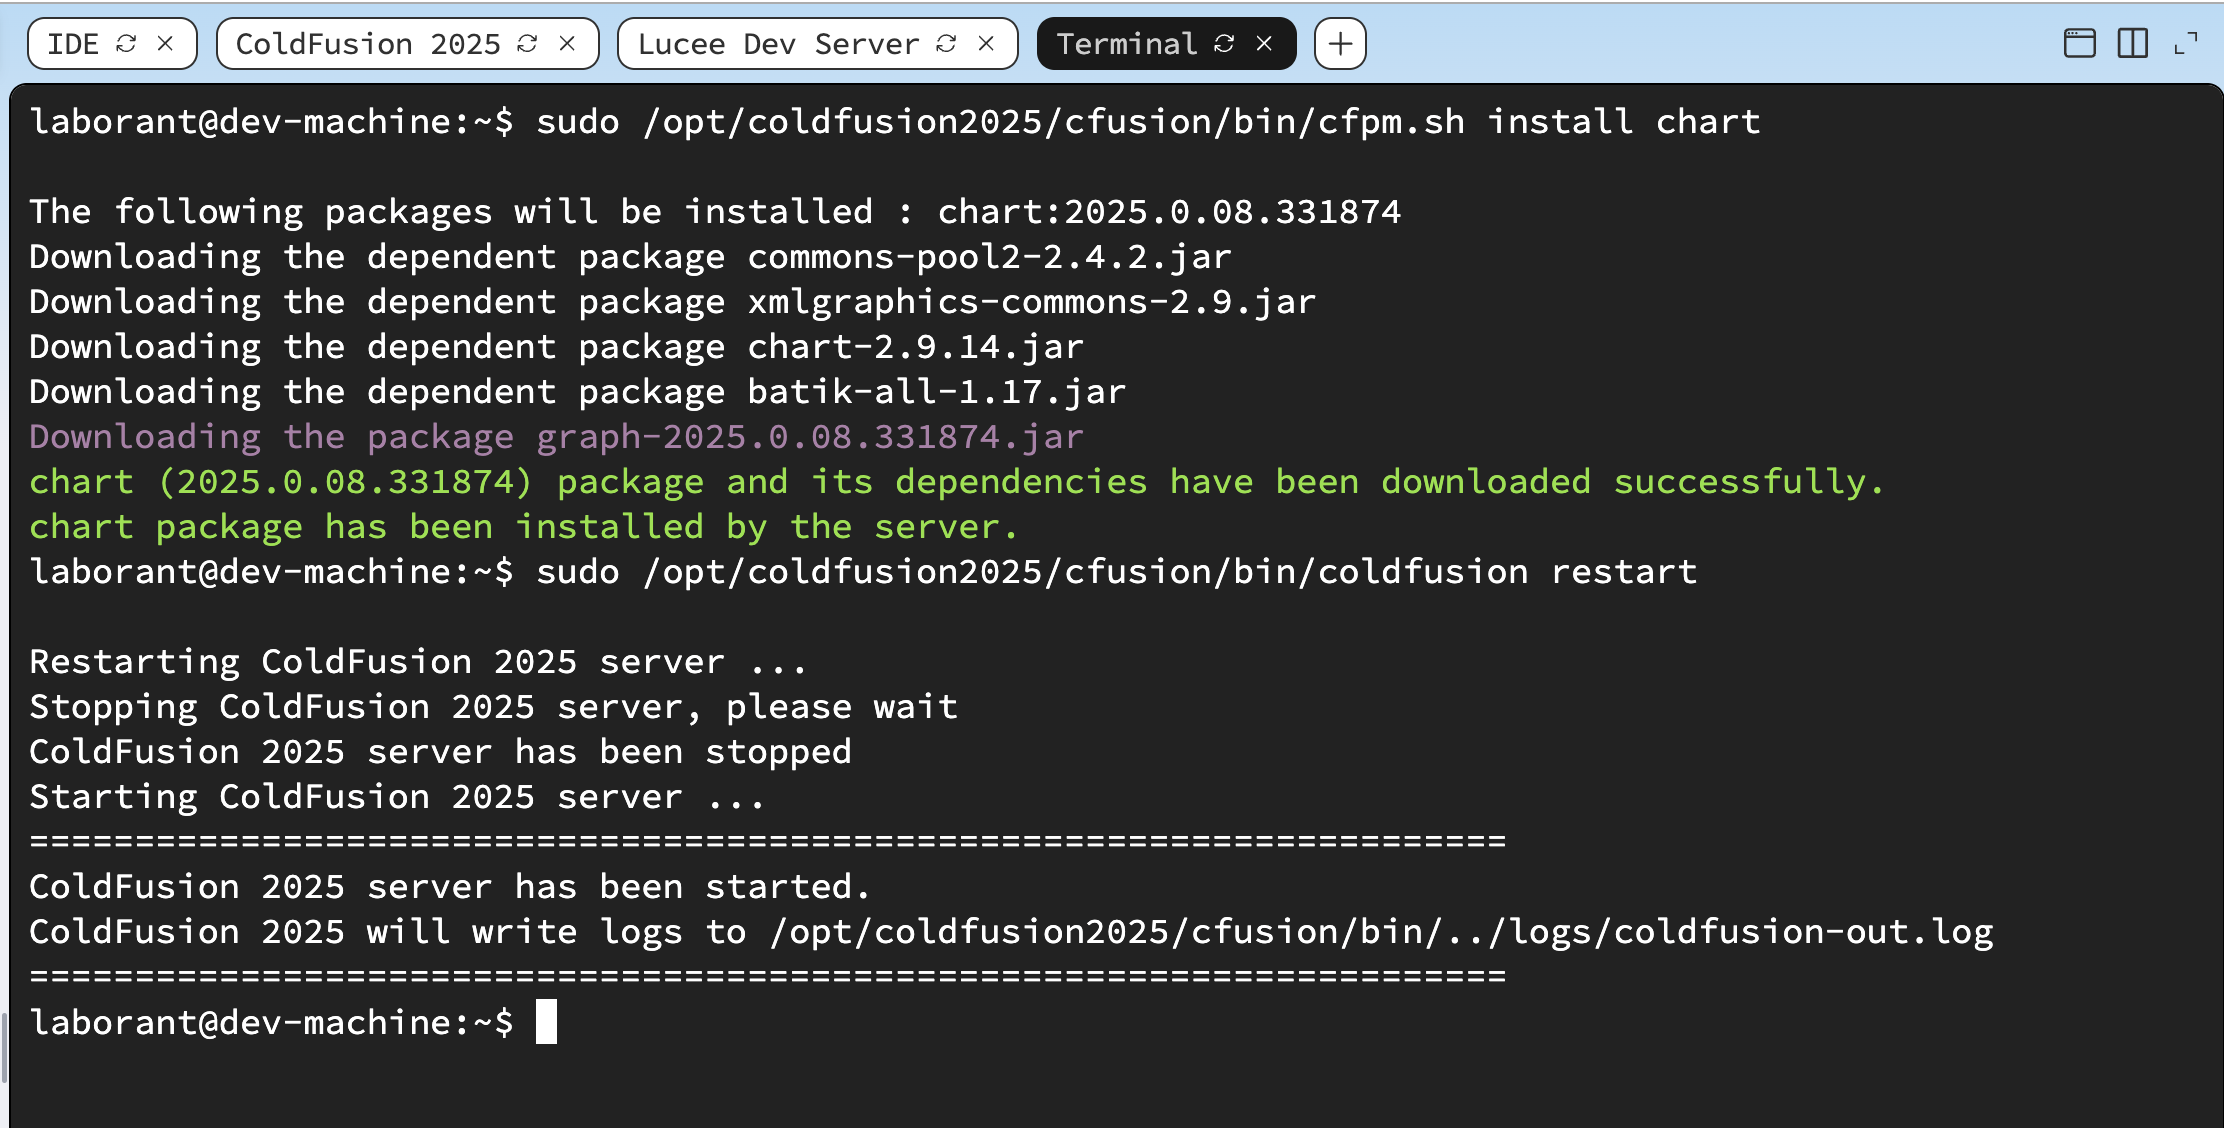
cfpm.sh install chart installs the chart engine — restart ColdFusion after to load the package.
What you are building: A new file chart_demo.cfm that queries the Help Desk database and renders a bar chart showing open ticket counts by priority.
File to create: /opt/coldfusion2025/cfusion/wwwroot/student/chart_demo.cfm
In the Terminal tab, run:
sudo tee /opt/coldfusion2025/cfusion/wwwroot/student/chart_demo.cfm << 'EOF'
<!DOCTYPE html>
<html lang="en">
<head>
  <meta charset="UTF-8">
  <title>ColdFusion Chart Demo</title>
  <style>
    body    { font-family: sans-serif; max-width: 860px; margin: 2rem auto; }
    h2      { margin-top: 2rem; border-bottom: 1px solid #e5e7eb; padding-bottom: .4rem; }
    .charts { display: flex; flex-wrap: wrap; gap: 2rem; margin-top: 1rem; }
  </style>
</head>
<body>
  <h1>ColdFusion cfchart Demo</h1>

  <h2>Bar Chart — Open Tickets by Priority</h2>

  <cfquery name="byPriority" datasource="training_db">
    SELECT priority, COUNT(*) AS total
    FROM   hd_tickets
    WHERE  status = 'open'
    GROUP  BY priority
    ORDER  BY total DESC
  </cfquery>

  <cfchart format="png" chartwidth="600" chartheight="380"
           title="Open Tickets by Priority" show3d="false"
           backgroundColor="##ffffff">
    <cfchartseries type="bar" query="byPriority"
                   itemcolumn="priority" valuecolumn="total"
                   seriescolor="##3b82d4" serieslabel="Open tickets">
    </cfchartseries>
  </cfchart>

</body>
</html>
EOF
✏️ Using the IDE tab instead? Create the file here
In the IDE tab, click File → Open Folder…, type /opt/coldfusion2025/cfusion/wwwroot/student and press Enter. If VS Code asks "The folder does not exist. Would you like to create it?" — click Yes. Then right-click in the Explorer panel → New File → name it chart_demo.cfm, paste the content below, and save with Ctrl+S:
<!DOCTYPE html>
<html lang="en">
<head>
  <meta charset="UTF-8">
  <title>ColdFusion Chart Demo</title>
  <style>
    body    { font-family: sans-serif; max-width: 860px; margin: 2rem auto; }
    h2      { margin-top: 2rem; border-bottom: 1px solid #e5e7eb; padding-bottom: .4rem; }
    .charts { display: flex; flex-wrap: wrap; gap: 2rem; margin-top: 1rem; }
  </style>
</head>
<body>
  <h1>ColdFusion cfchart Demo</h1>

  <h2>Bar Chart — Open Tickets by Priority</h2>

  <cfquery name="byPriority" datasource="training_db">
    SELECT priority, COUNT(*) AS total
    FROM   hd_tickets
    WHERE  status = 'open'
    GROUP  BY priority
    ORDER  BY total DESC
  </cfquery>

  <cfchart format="png" chartwidth="600" chartheight="380"
           title="Open Tickets by Priority" show3d="false"
           backgroundColor="##ffffff">
    <cfchartseries type="bar" query="byPriority"
                   itemcolumn="priority" valuecolumn="total"
                   seriescolor="##3b82d4" serieslabel="Open tickets">
    </cfchartseries>
  </cfchart>

</body>
</html>
Verify the file exists and contains cfchart:
grep -i "cfchart" /opt/coldfusion2025/cfusion/wwwroot/student/chart_demo.cfm
Open /student/chart_demo.cfm in the ColdFusion 2025 browser tab — you should see a blue bar chart with one bar per priority value.
Getting "Table HD_TICKETS not found — this database is empty"? Run the seed script first.
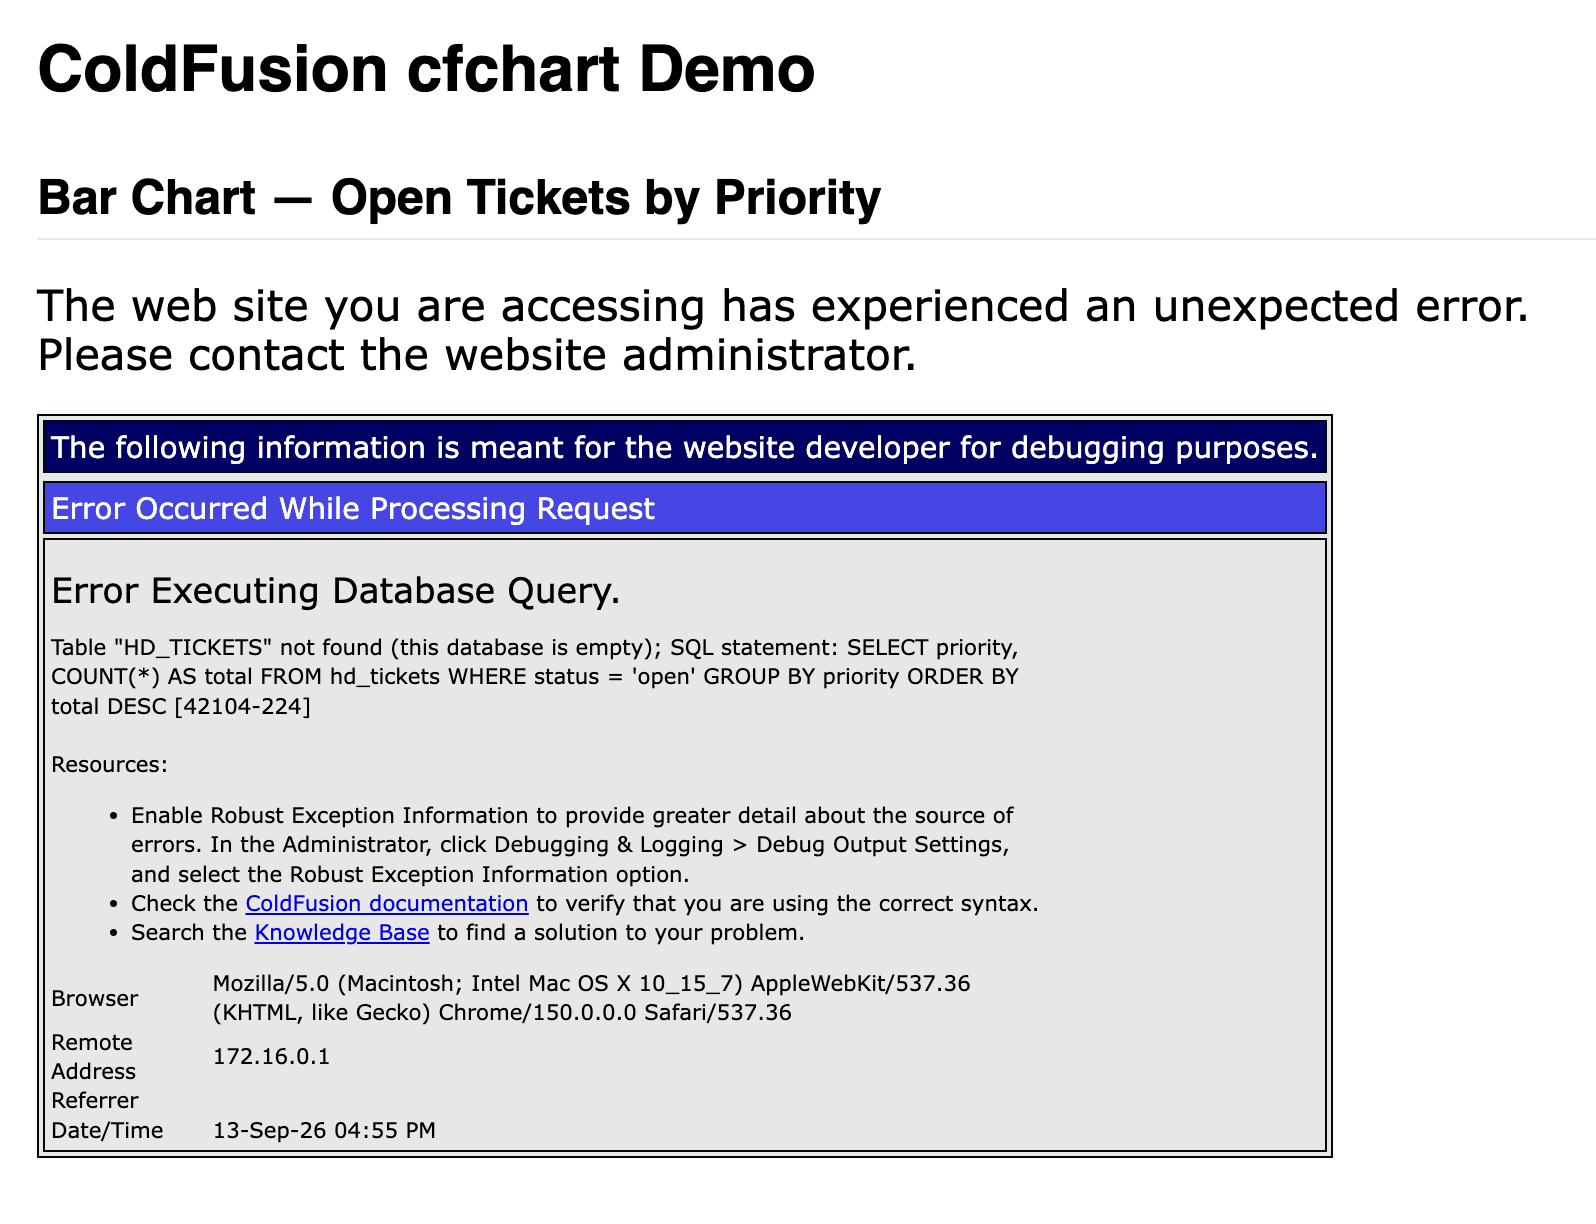
This error means the Help Desk database has not been seeded yet — the tables exist but contain no data, or the schema was never created.
The database has not been seeded yet. In the ColdFusion 2025 browser tab, go back to the home page and click the DB Test button, then click Run Seed Script. Once the confirmation screen appears, reload /student/chart_demo.cfm and the chart will render correctly.
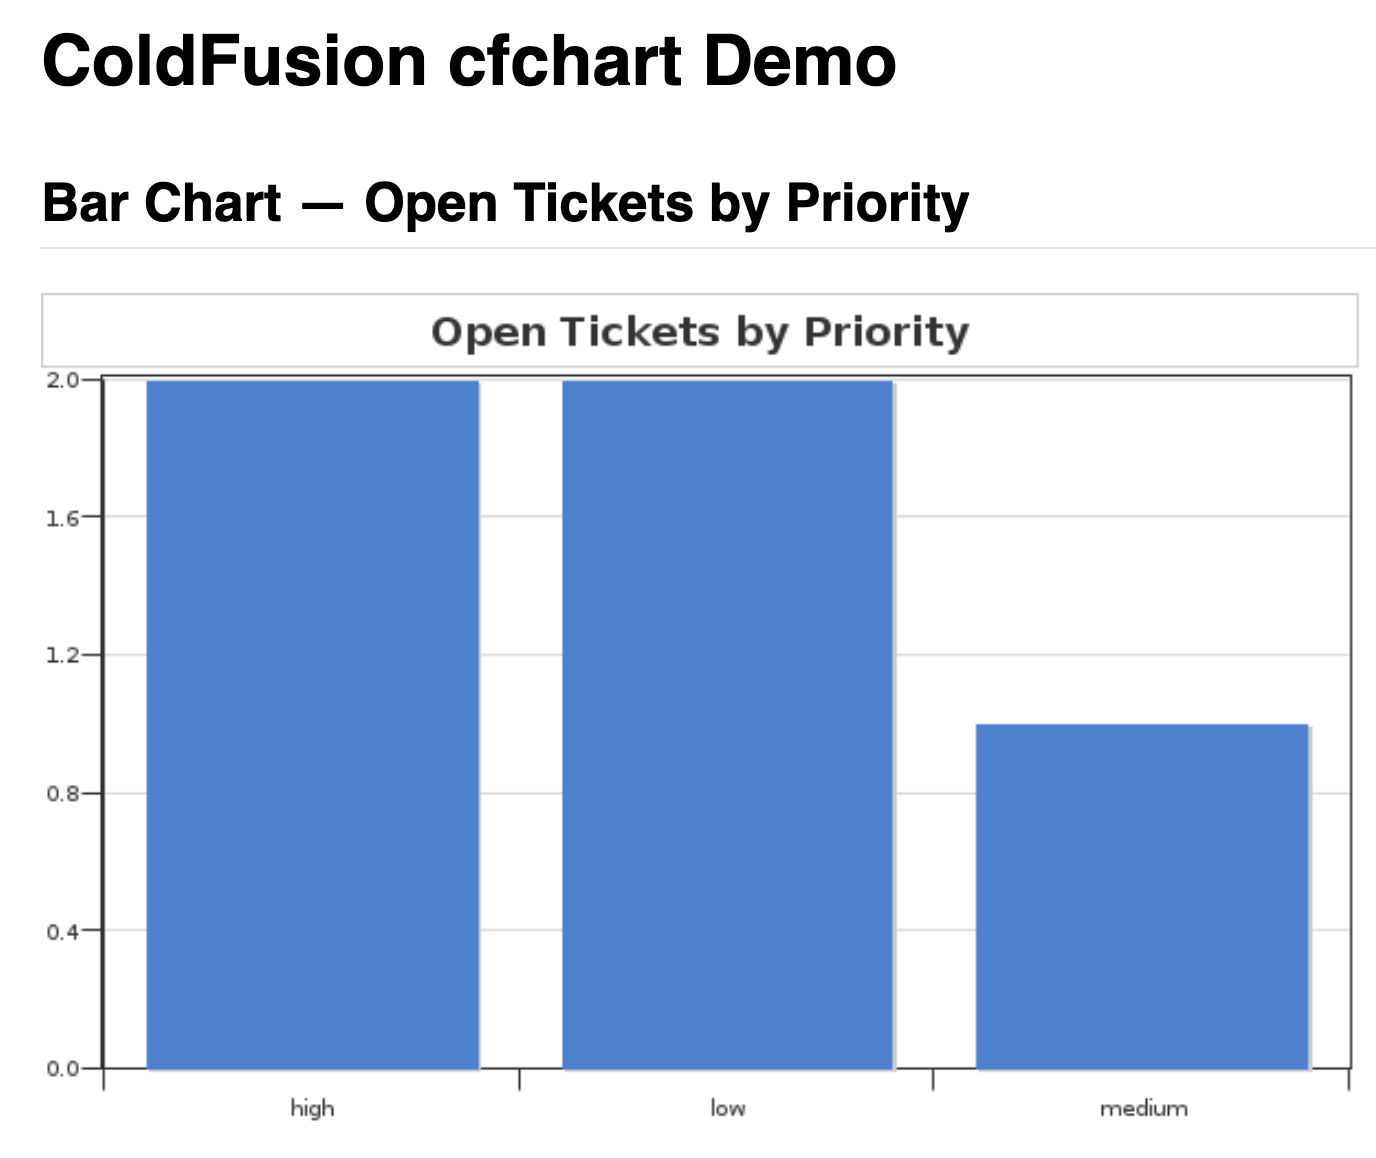
Bar chart rendered server-side by cfchart — each bar represents the count of open tickets for that priority, pulled live from hd_tickets.
Activity 2 — Add a pie chart for ticket status
What you are building: Extend chart_demo.cfm with a second section showing a pie chart of ticket distribution by status.
File to update: /opt/coldfusion2025/cfusion/wwwroot/student/chart_demo.cfm
In the Terminal tab, overwrite the file with this extended version:
sudo tee /opt/coldfusion2025/cfusion/wwwroot/student/chart_demo.cfm << 'EOF'
<!DOCTYPE html>
<html lang="en">
<head>
  <meta charset="UTF-8">
  <title>ColdFusion Chart Demo</title>
  <style>
    body    { font-family: sans-serif; max-width: 860px; margin: 2rem auto; }
    h2      { margin-top: 2rem; border-bottom: 1px solid #e5e7eb; padding-bottom: .4rem; }
    .charts { display: flex; flex-wrap: wrap; gap: 2rem; margin-top: 1rem; }
  </style>
</head>
<body>
  <h1>ColdFusion cfchart Demo</h1>

  <h2>Bar Chart — Open Tickets by Priority</h2>

  <cfquery name="byPriority" datasource="training_db">
    SELECT priority, COUNT(*) AS total
    FROM   hd_tickets
    WHERE  status = 'open'
    GROUP  BY priority
    ORDER  BY total DESC
  </cfquery>

  <cfchart format="png" chartwidth="600" chartheight="380"
           title="Open Tickets by Priority" show3d="false"
           backgroundColor="##ffffff">
    <cfchartseries type="bar" query="byPriority"
                   itemcolumn="priority" valuecolumn="total"
                   seriescolor="##3b82d4" serieslabel="Open tickets">
    </cfchartseries>
  </cfchart>

  <h2>Pie Chart — All Tickets by Status</h2>

  <cfquery name="byStatus" datasource="training_db">
    SELECT status, COUNT(*) AS total
    FROM   hd_tickets
    GROUP  BY status
    ORDER  BY total DESC
  </cfquery>

  <cfchart format="png" chartwidth="500" chartheight="400"
           title="All Tickets by Status" show3d="false"
           backgroundColor="##ffffff">
    <cfchartseries type="pie" query="byStatus"
                   itemcolumn="status" valuecolumn="total">
    </cfchartseries>
  </cfchart>

</body>
</html>
EOF
✏️ Using the IDE tab instead? Edit the file here
In the IDE tab, open chart_demo.cfm, select all (Ctrl+A), replace with the content below, and save with Ctrl+S:
<!DOCTYPE html>
<html lang="en">
<head>
  <meta charset="UTF-8">
  <title>ColdFusion Chart Demo</title>
  <style>
    body    { font-family: sans-serif; max-width: 860px; margin: 2rem auto; }
    h2      { margin-top: 2rem; border-bottom: 1px solid #e5e7eb; padding-bottom: .4rem; }
    .charts { display: flex; flex-wrap: wrap; gap: 2rem; margin-top: 1rem; }
  </style>
</head>
<body>
  <h1>ColdFusion cfchart Demo</h1>

  <h2>Bar Chart — Open Tickets by Priority</h2>

  <cfquery name="byPriority" datasource="training_db">
    SELECT priority, COUNT(*) AS total
    FROM   hd_tickets
    WHERE  status = 'open'
    GROUP  BY priority
    ORDER  BY total DESC
  </cfquery>

  <cfchart format="png" chartwidth="600" chartheight="380"
           title="Open Tickets by Priority" show3d="false"
           backgroundColor="##ffffff">
    <cfchartseries type="bar" query="byPriority"
                   itemcolumn="priority" valuecolumn="total"
                   seriescolor="##3b82d4" serieslabel="Open tickets">
    </cfchartseries>
  </cfchart>

  <h2>Pie Chart — All Tickets by Status</h2>

  <cfquery name="byStatus" datasource="training_db">
    SELECT status, COUNT(*) AS total
    FROM   hd_tickets
    GROUP  BY status
    ORDER  BY total DESC
  </cfquery>

  <cfchart format="png" chartwidth="500" chartheight="400"
           title="All Tickets by Status" show3d="false"
           backgroundColor="##ffffff">
    <cfchartseries type="pie" query="byStatus"
                   itemcolumn="status" valuecolumn="total">
    </cfchartseries>
  </cfchart>

</body>
</html>
Reload /student/chart_demo.cfm in the browser — you should now see both charts: the bar chart above and the pie chart below it.
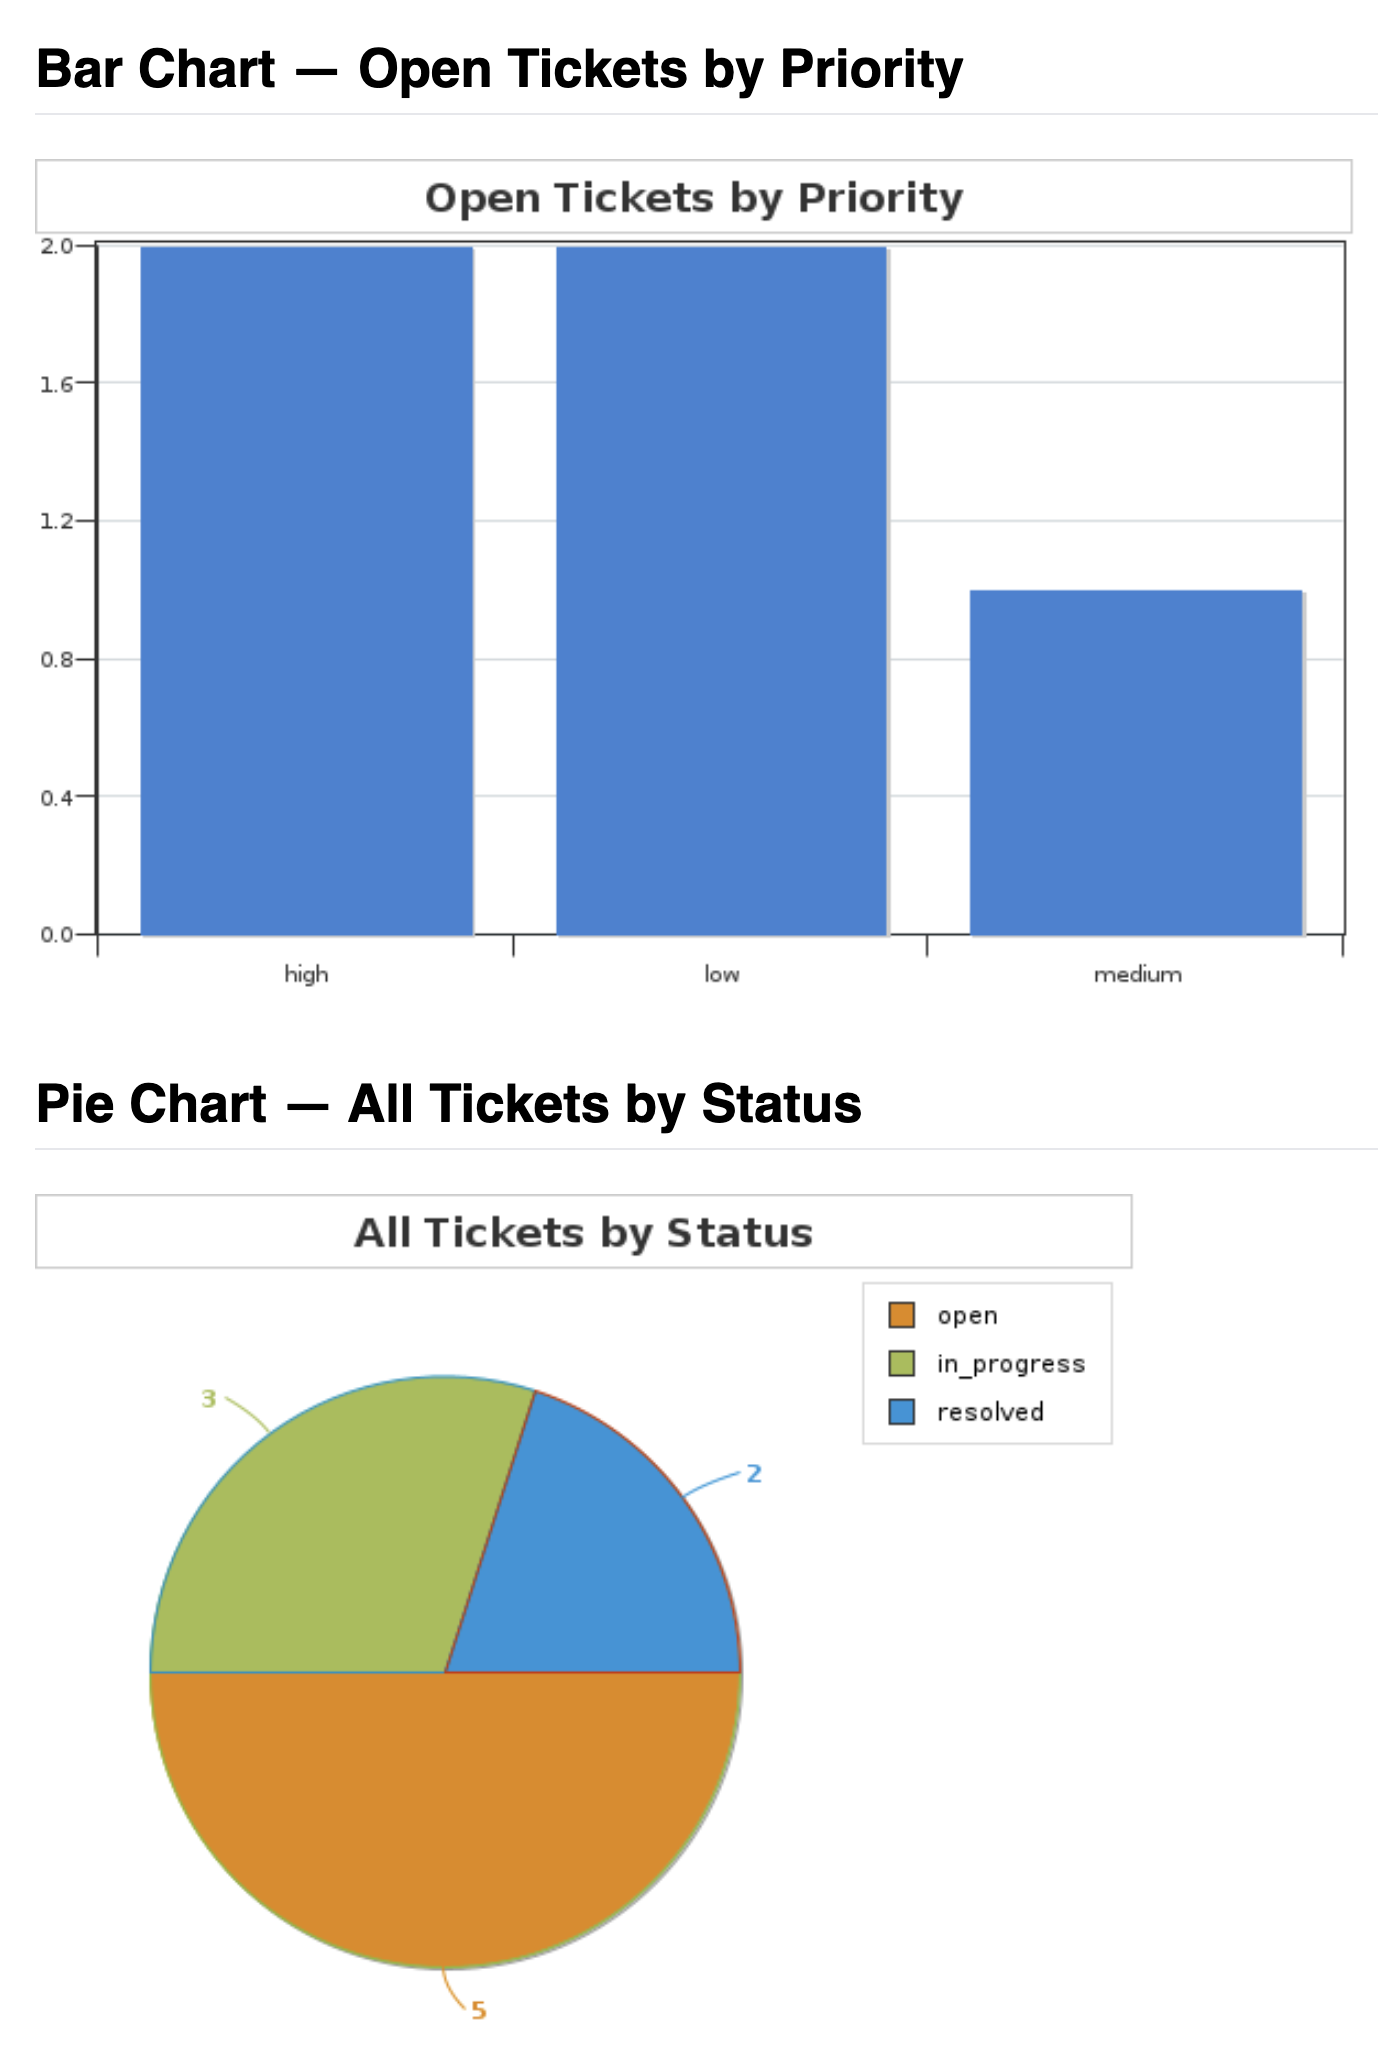
Both charts on one page — bar chart for priority comparison, pie chart for status proportions — both driven by live hd_tickets data.
Activity 3 — Confirm both charts rendered successfully
What this activity proves:
HTTP 200 only tells you the page loaded — it does not prove the charts actually rendered. The real proof is in the HTML that cfchart emits. When ColdFusion successfully generates a chart image it writes it to its internal chart cache and emits an <img> tag with a src pointing to /CFIDE/charting/cache/.... If that <img> tag is present in the response, both the query ran and the chart image was generated. If the chart failed, ColdFusion throws an exception and no <img> tag appears.
Run this single command in the Terminal tab — it fetches the page and counts how many chart <img> tags are in the response:
curl -s http://localhost:8500/student/chart_demo.cfm | grep -c "_cf_chart"
Expected result: 2 — one <img> for the bar chart, one for the pie chart. This is the definitive proof that both charts were generated from live query data and written to the CF chart cache successfully.
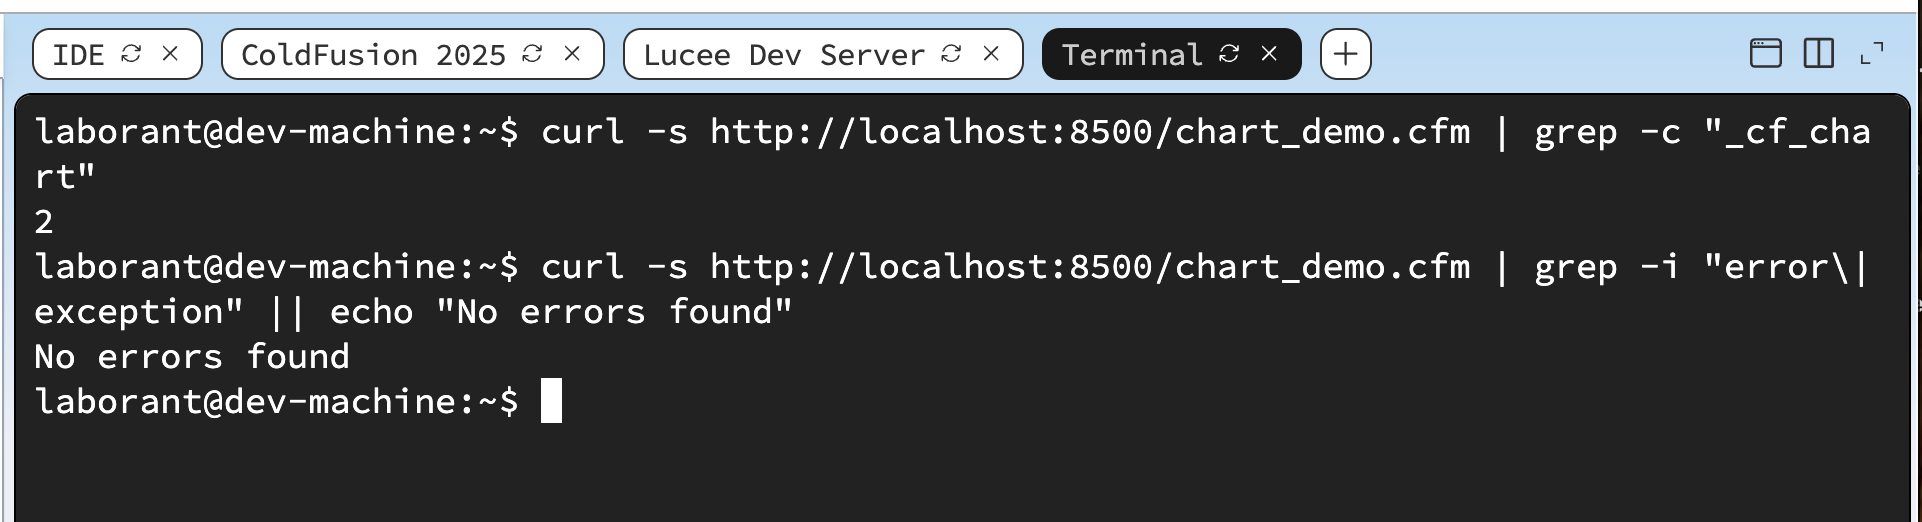
grep -c "_cf_chart" returns 2 — both chart images were generated and written to the CF chart cache.
Also confirm the page returns HTTP 200 and contains no errors:
curl -s -o /dev/null -w "HTTP %{http_code}\n" http://localhost:8500/student/chart_demo.cfm
curl -s http://localhost:8500/student/chart_demo.cfm | grep -i "error\|exception" || echo "No errors found"
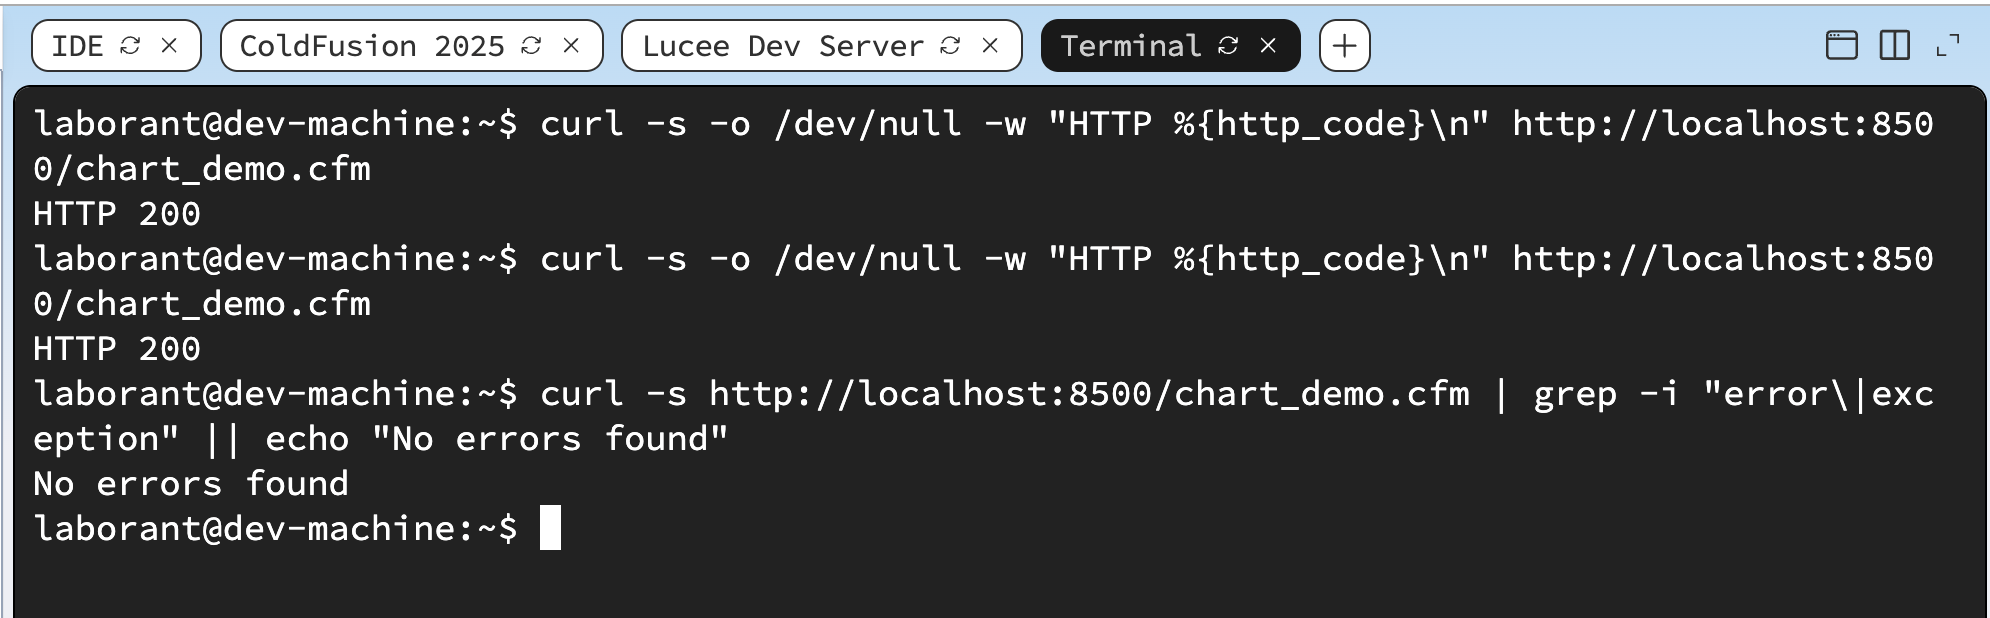
HTTP 200 and no errors — the page is accessible and both charts rendered without exceptions.
When all the checks above are green, this lesson is complete. Your progress is saved automatically — move straight on to the next lesson.
- Previous lesson
- Caching Strategies in ColdFusion
- Next lesson
- Dynamic Chart Challenge — Solution Review