Performance Tuning & JVM Configuration
Why performance tuning matters
A ColdFusion application that works correctly in development can behave very differently under production load. The same page that responds in 80 ms with one user can take 4 seconds with 50 concurrent users — not because the code is wrong, but because the JVM heap is too small, the database connection pool is exhausted, or templates are being recompiled on every request.
Performance tuning is the process of measuring, understanding, and adjusting the runtime environment so your application uses available resources efficiently. In this lesson you will tune the three most impactful settings for a ColdFusion server:
- JVM heap size — how much memory CF can use
- Template cache — how CF avoids recompiling pages on every request
- Response time baseline — measuring what "fast enough" looks like
1. JVM heap settings
Who does this? Heap configuration is a server administrator task. It requires editing a file on the server and restarting ColdFusion. Developers need to understand what the heap is — so they can write memory-aware code — but they do not typically change these values. In a team environment, this work belongs to the sysadmin or DevOps engineer who manages the CF server.
We start here because the heap is the single most impactful runtime setting for ColdFusion. Get it wrong and no amount of code optimisation will fix your application's performance under load.
What is the heap, and why does it matter?
ColdFusion is a Java application — it runs inside a Java Virtual Machine (JVM). The heap is the region of memory the JVM allocates for everything your application creates at runtime: every query result, every struct, every component instance, every cached template. It is not disk space and it is not the server's total RAM — it is a private memory arena the JVM manages on CF's behalf.
When a request arrives, ColdFusion allocates objects on the heap to process it. When the request finishes, those objects become eligible for garbage collection (GC). The JVM's garbage collector periodically sweeps the heap to reclaim that memory so it can be reused. The heap size flags you set in jvm.config control two things: the floor (how much is pre-allocated at startup) and the ceiling (how large the heap is allowed to grow).
Why does this matter? Because the heap ceiling is a hard stop. Once it is reached, every new request that needs memory will cause the JVM to run a full GC cycle — pausing all threads until memory is reclaimed. Under sustained load, this means users experience sudden, periodic slowdowns or timeouts that have nothing to do with your CFML code and everything to do with a misconfigured runtime.
The heap flags live in jvm.config — a server-level file under CF's bin/ directory. Any change to it requires a full ColdFusion restart to take effect.
![[object Object]](/content/files/courses/ColdFusion-2025-Foundations-5151cba6/module-4/2.lesson-performance/__static__/jvm-heap-configuration-v1.png?v=1791349307475)
jvm.config is the single file that controls all JVM tuning for Adobe ColdFusion — restart required after any change.
ColdFusion runs on the JVM. The heap size directly controls how much memory CF can use before triggering garbage collection (GC) pauses. When the heap fills up, the JVM pauses all threads to reclaim memory — users experience this as a sudden slowdown or timeout.
The heap flags live inside the java.args line of jvm.config. If you run the grep command from Activity 1 on the lab VM, the relevant portion of that line looks like this:
-Xms256m -Xmx512m -XX:+UseParallelGC
Note: The full
java.argsline is long — it includes a wall of--add-exportsand--add-opensflags that grant the JVM access to internal Java APIs ColdFusion depends on. Those are Adobe-managed boilerplate; do not touch them. The heap flags (-Xms,-Xmx) and the GC flag (-XX:+Use...GC) are the only values you would ever tune.
| Flag | Meaning |
|---|---|
-Xms256m | Initial (minimum) heap — 256 MB pre-allocated at startup |
-Xmx512m | Maximum heap — JVM cannot grow beyond 512 MB |
-XX:+UseParallelGC | Parallel GC — throughput-focused, suited for batch workloads |
About the GC choice: The lab VM ships with UseParallelGC, which prioritises raw throughput. For web applications — where low response latency matters more than throughput — UseG1GC (Garbage First) is a better fit. G1GC keeps individual GC pauses short and predictable instead of running occasional large pauses. On a production server you would change this flag:
-XX:+UseParallelGC → -XX:+UseG1GC -XX:MaxGCPauseMillis=200
The lab VM does not have enough RAM to justify the change here, but it is the standard recommendation for any production ColdFusion deployment.
💡 What happens if the heap is too small?
When the heap is exhausted the JVM throws java.lang.OutOfMemoryError and ColdFusion crashes. Before that point, GC runs increasingly frequently — each run pauses all request threads. Users see intermittent slowdowns that are hard to trace without looking at the logs.
Signs the heap is too small:
OutOfMemoryErrorinexception.log- RSS memory climbing steadily with no release
- Periodic request timeouts under normal load with no obvious cause
Rule of thumb: set -Xmx to no more than 50–60% of total server RAM to leave room for the OS, nginx, and other processes.
2. Template cache
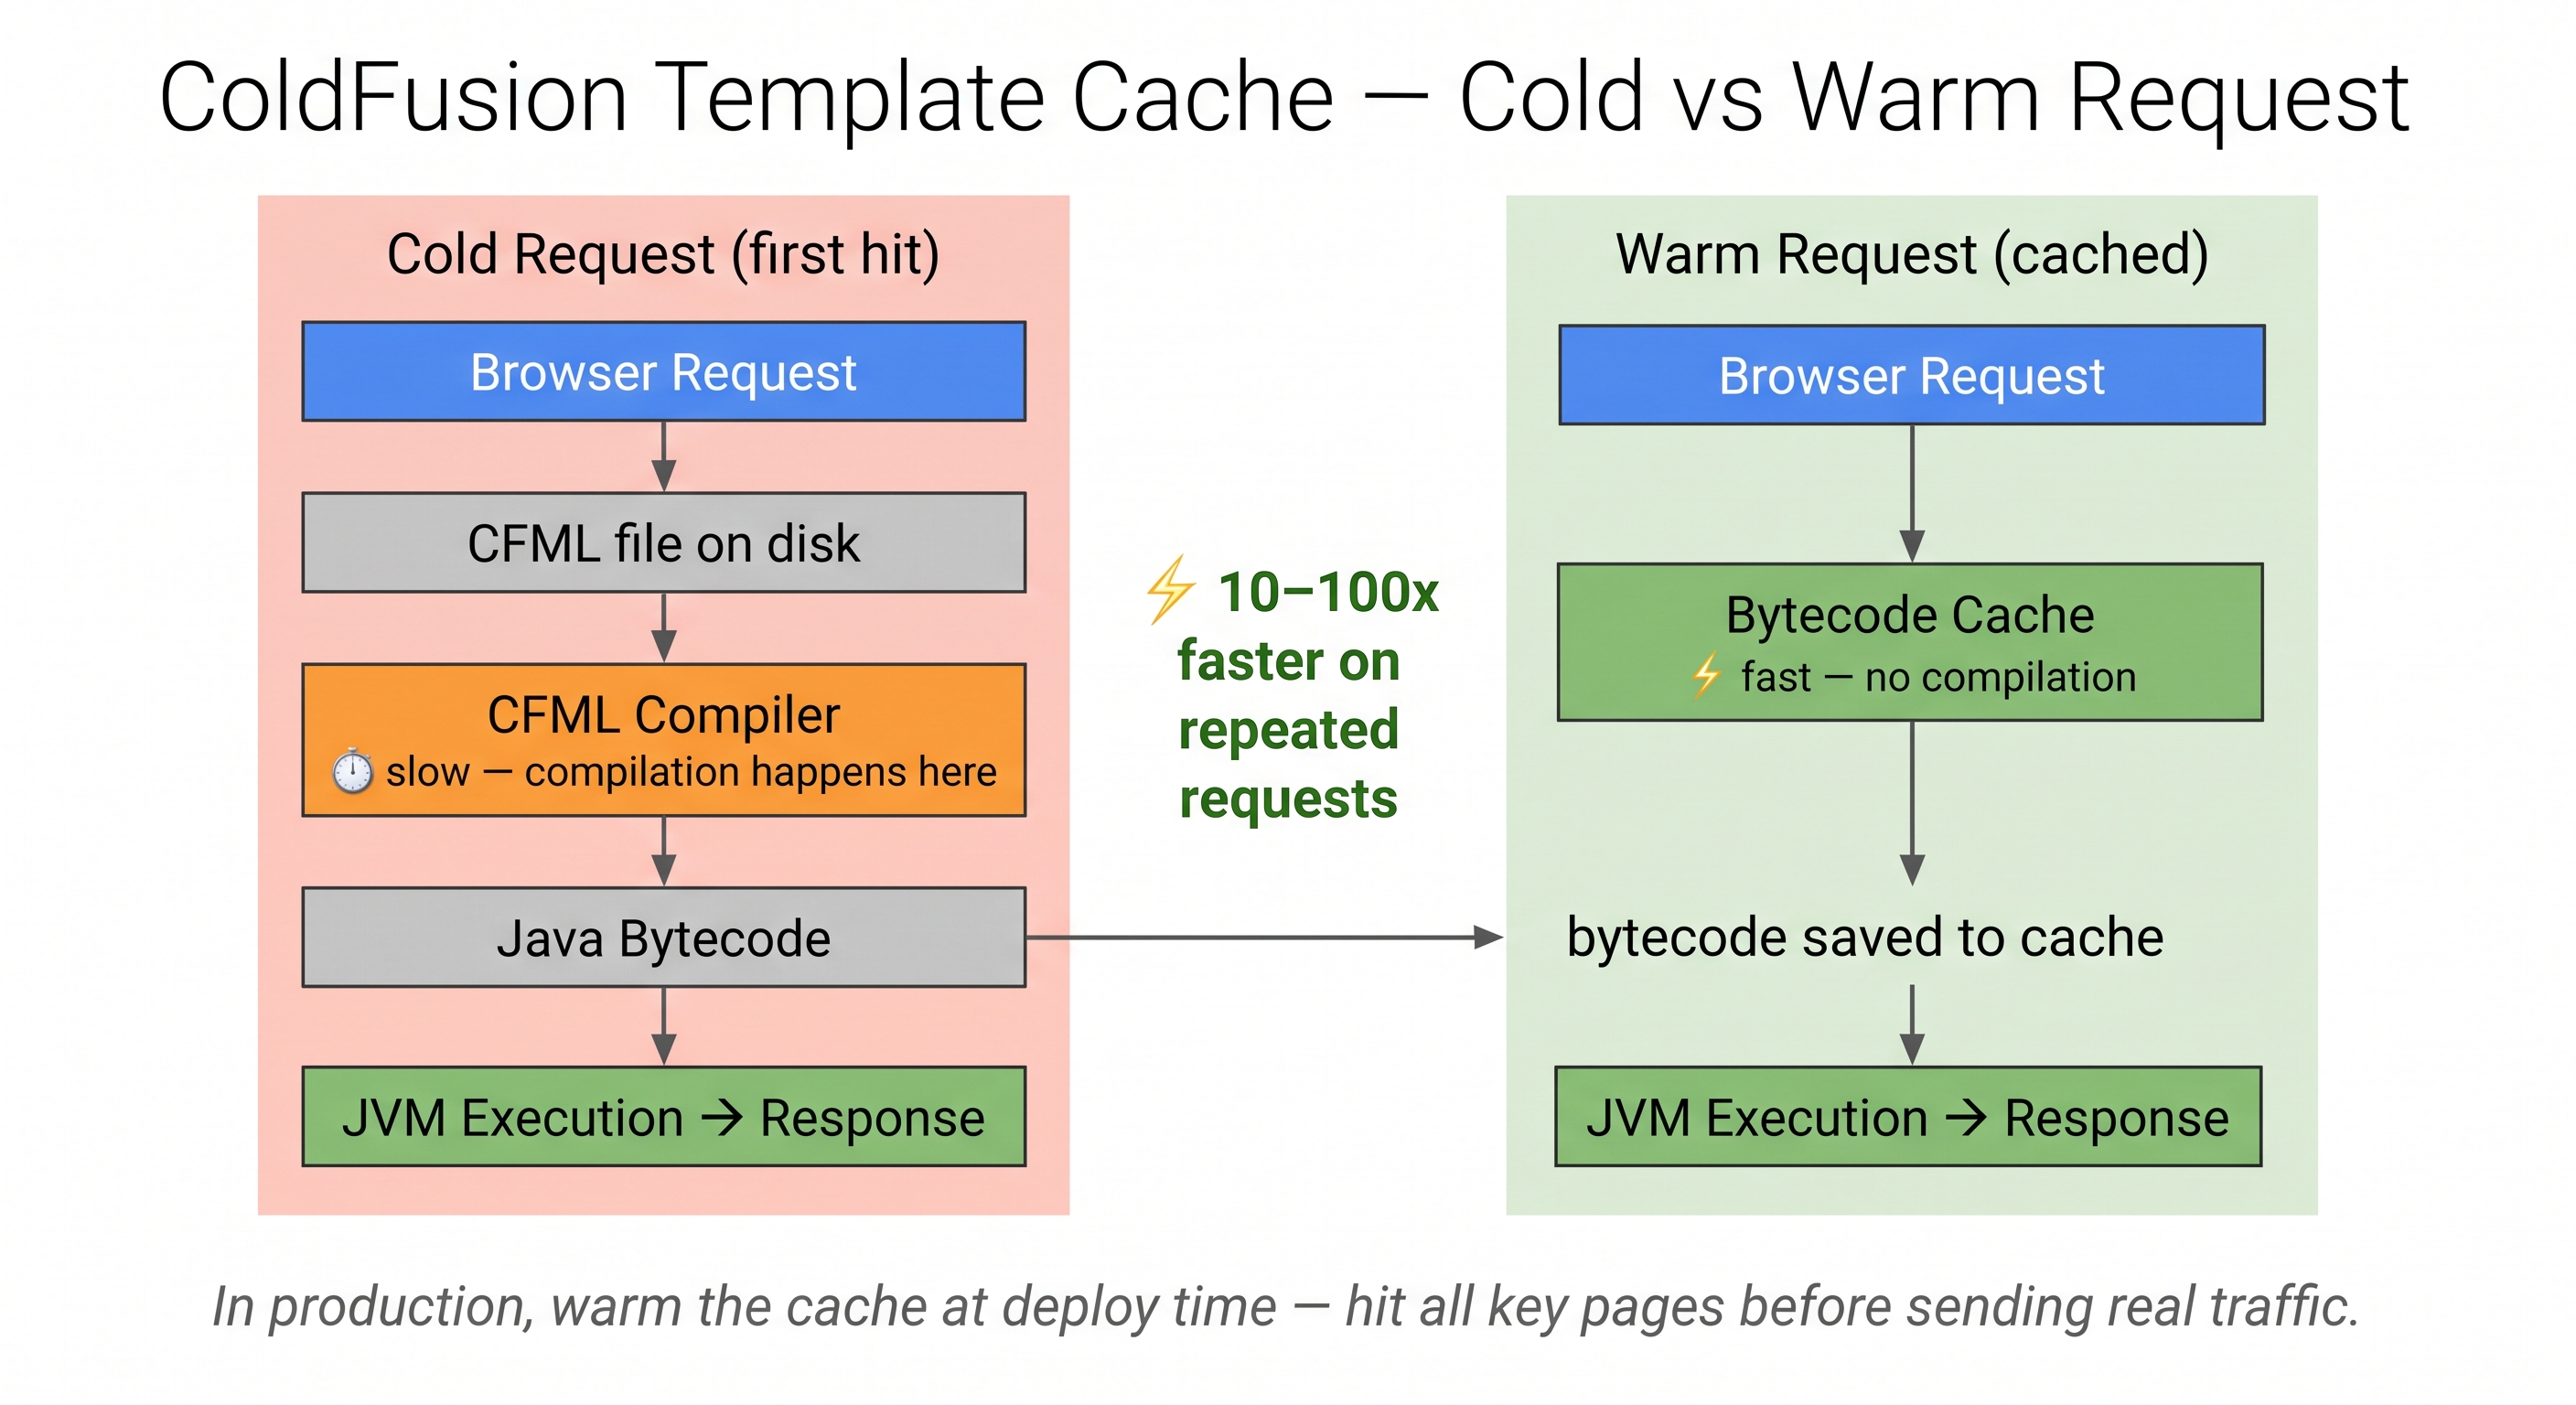
ColdFusion's template cache eliminates recompilation on repeated requests — the JVM runs bytecode, not source.
ColdFusion compiles .cfm and .cfc files to Java bytecode on the first request and caches the result. Subsequent requests run the cached bytecode directly — no disk read, no compilation.
Cold request (first hit): disk read → compile → cache bytecode → execute → respond
Warm request (cached): read from cache → execute → respond — typically 10–100× faster
The default template cache size is 1024 entries. If your application has more templates than the cache can hold, older entries get evicted and recompiled on next access. Increase it in:
CF Admin → Server Settings → Caching → Maximum Number of Cached Templates
💡 Connection pool tuning — for when you go to production
Database connection pools let ColdFusion reuse JDBC connections instead of opening a new one per request. In high-traffic environments an undersized pool causes requests to queue waiting for a connection — this shows up as slow page loads even when the query itself is fast.
To tune in CF Admin → Data & Services → Data Sources → training_db → Advanced Settings:
| Setting | Recommended starting value |
|---|---|
| Max Connections | 50 |
| Connection Timeout | 120 seconds |
| Max Wait Time | 5000 ms |
These defaults are fine for the lab VM. On a production server handling hundreds of concurrent requests, tune based on observed pool utilisation from the CF Server Monitor.
💡 GZIP compression — if you run nginx in front of CF
GZIP compression at the nginx layer reduces HTML/JSON response size by 60–80% — significant bandwidth savings for content-heavy pages.
gzip on;
gzip_types text/html application/json application/javascript text/css;
gzip_min_length 1024;
This is a nginx configuration — not a ColdFusion setting. There is no nginx in this lab, but this is the standard setup for any production CF deployment behind a reverse proxy.
3. Measuring response time
Before tuning anything, establish a baseline. Use curl's built-in timing output:
# Single request — shows HTTP status and total time
curl -s -w "\nHTTP %{http_code} — Total: %{time_total}s\n" -o /dev/null http://localhost:8500/index.cfm
Run it three times and note the pattern:
- First request — slower (template compilation)
- Second and third — faster (bytecode cache warm)
A healthy idle CF server on this lab VM should respond in under 500 ms on cached requests.
Activity 1 — Inspect jvm.config
ColdFusion's JVM settings live in a single file. Check that it exists and see its current heap settings:
# Confirm the file exists
ls /opt/coldfusion2025/cfusion/bin/jvm.config

# Show the current heap flags
grep -i "xms\|xmx\|GC" /opt/coldfusion2025/cfusion/bin/jvm.config
💡 Can I change the heap size in this lab?
Yes — but a restart is required. The lab VM ships with -Xmx512m, which is already at the safe ceiling for this environment (~512 MB RSS in use by ColdFusion at idle). Do not raise -Xmx beyond 512m here or ColdFusion will fail to restart due to OOM.
On a production server with 8–16 GB RAM, a typical setting is:
java.args=-Xms512m -Xmx2048m -XX:+UseG1GC -XX:MaxGCPauseMillis=200
To restart ColdFusion in this lab (CommandBox managed — not systemd):
# Stop and start via CommandBox
box server stop && box server start --console &
Wait 30–60 seconds for CF to come back up before making any requests.
Activity 2 — Measure response time
Measure how long ColdFusion takes to respond — run it three times and observe the cache effect:
for i in 1 2 3; do
  curl -s -w "Request $i — HTTP %{http_code} — %{time_total}s\n" -o /dev/null http://localhost:8500/index.cfm
done
Request 1 will be slower than requests 2 and 3. That difference is the template compilation cost — it only happens once per template per server restart.
The task checks that at least one response is under 2000 ms.
💡 Why is the first request always slower?
ColdFusion compiles .cfm files to Java bytecode on the first request — this takes extra time. The bytecode is then cached so subsequent requests skip the compilation step entirely and run much faster.
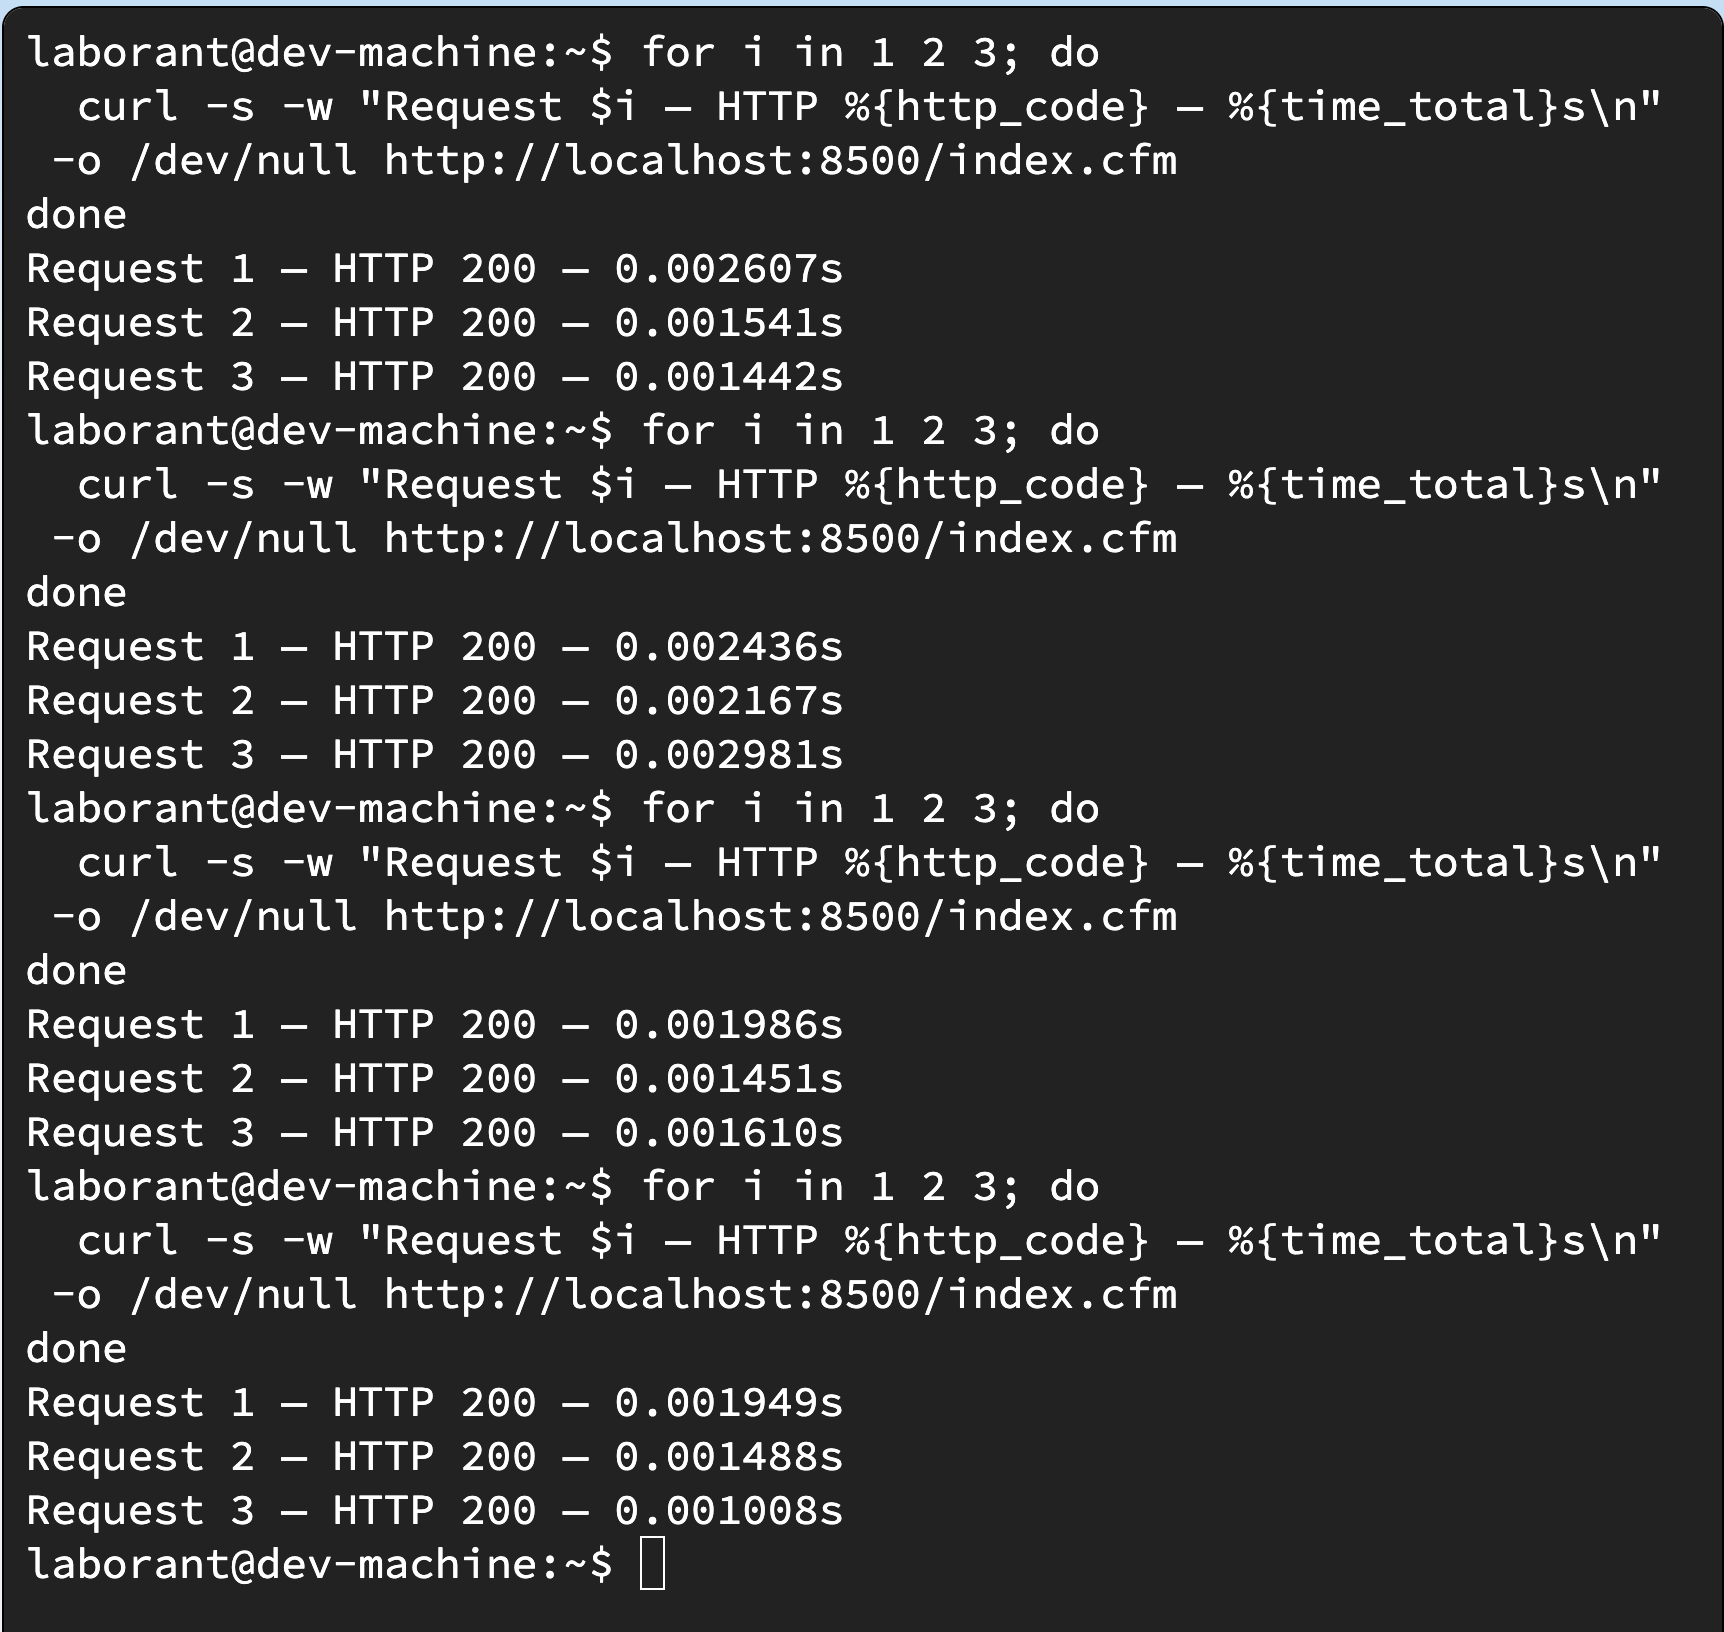
Request 1 is ~17× slower — that is the template compilation cost. Requests 2–4 run from bytecode cache.
This is the template cache in action. In production you warm the cache at deploy time (by hitting all your key pages before sending real traffic) so users never see the compilation delay.
You can increase the cache size in CF Admin → Server Settings → Caching → Maximum Number of Cached Templates.
When all the checks above are green, this lesson is complete. Your progress is saved automatically — move straight on to the next lesson.
Found a bug or an issue with this lesson? Please reach out — your feedback helps improve the course for everyone.
📧 Alex — mercadoalexatgmail.com
- Previous lesson
- Security Hardening ColdFusion
- Next lesson
- CI/CD for CFML Applications