Observability and Monitoring
You cannot operate a cluster you cannot see. This lesson installs the observability stack that Rancher Monitoring is built on - Prometheus for metrics, Grafana for dashboards, and Alertmanager for alerts - and has you define an alert of your own. You install it with Helm from the dev-machine workstation, the same way you installed Rancher itself.
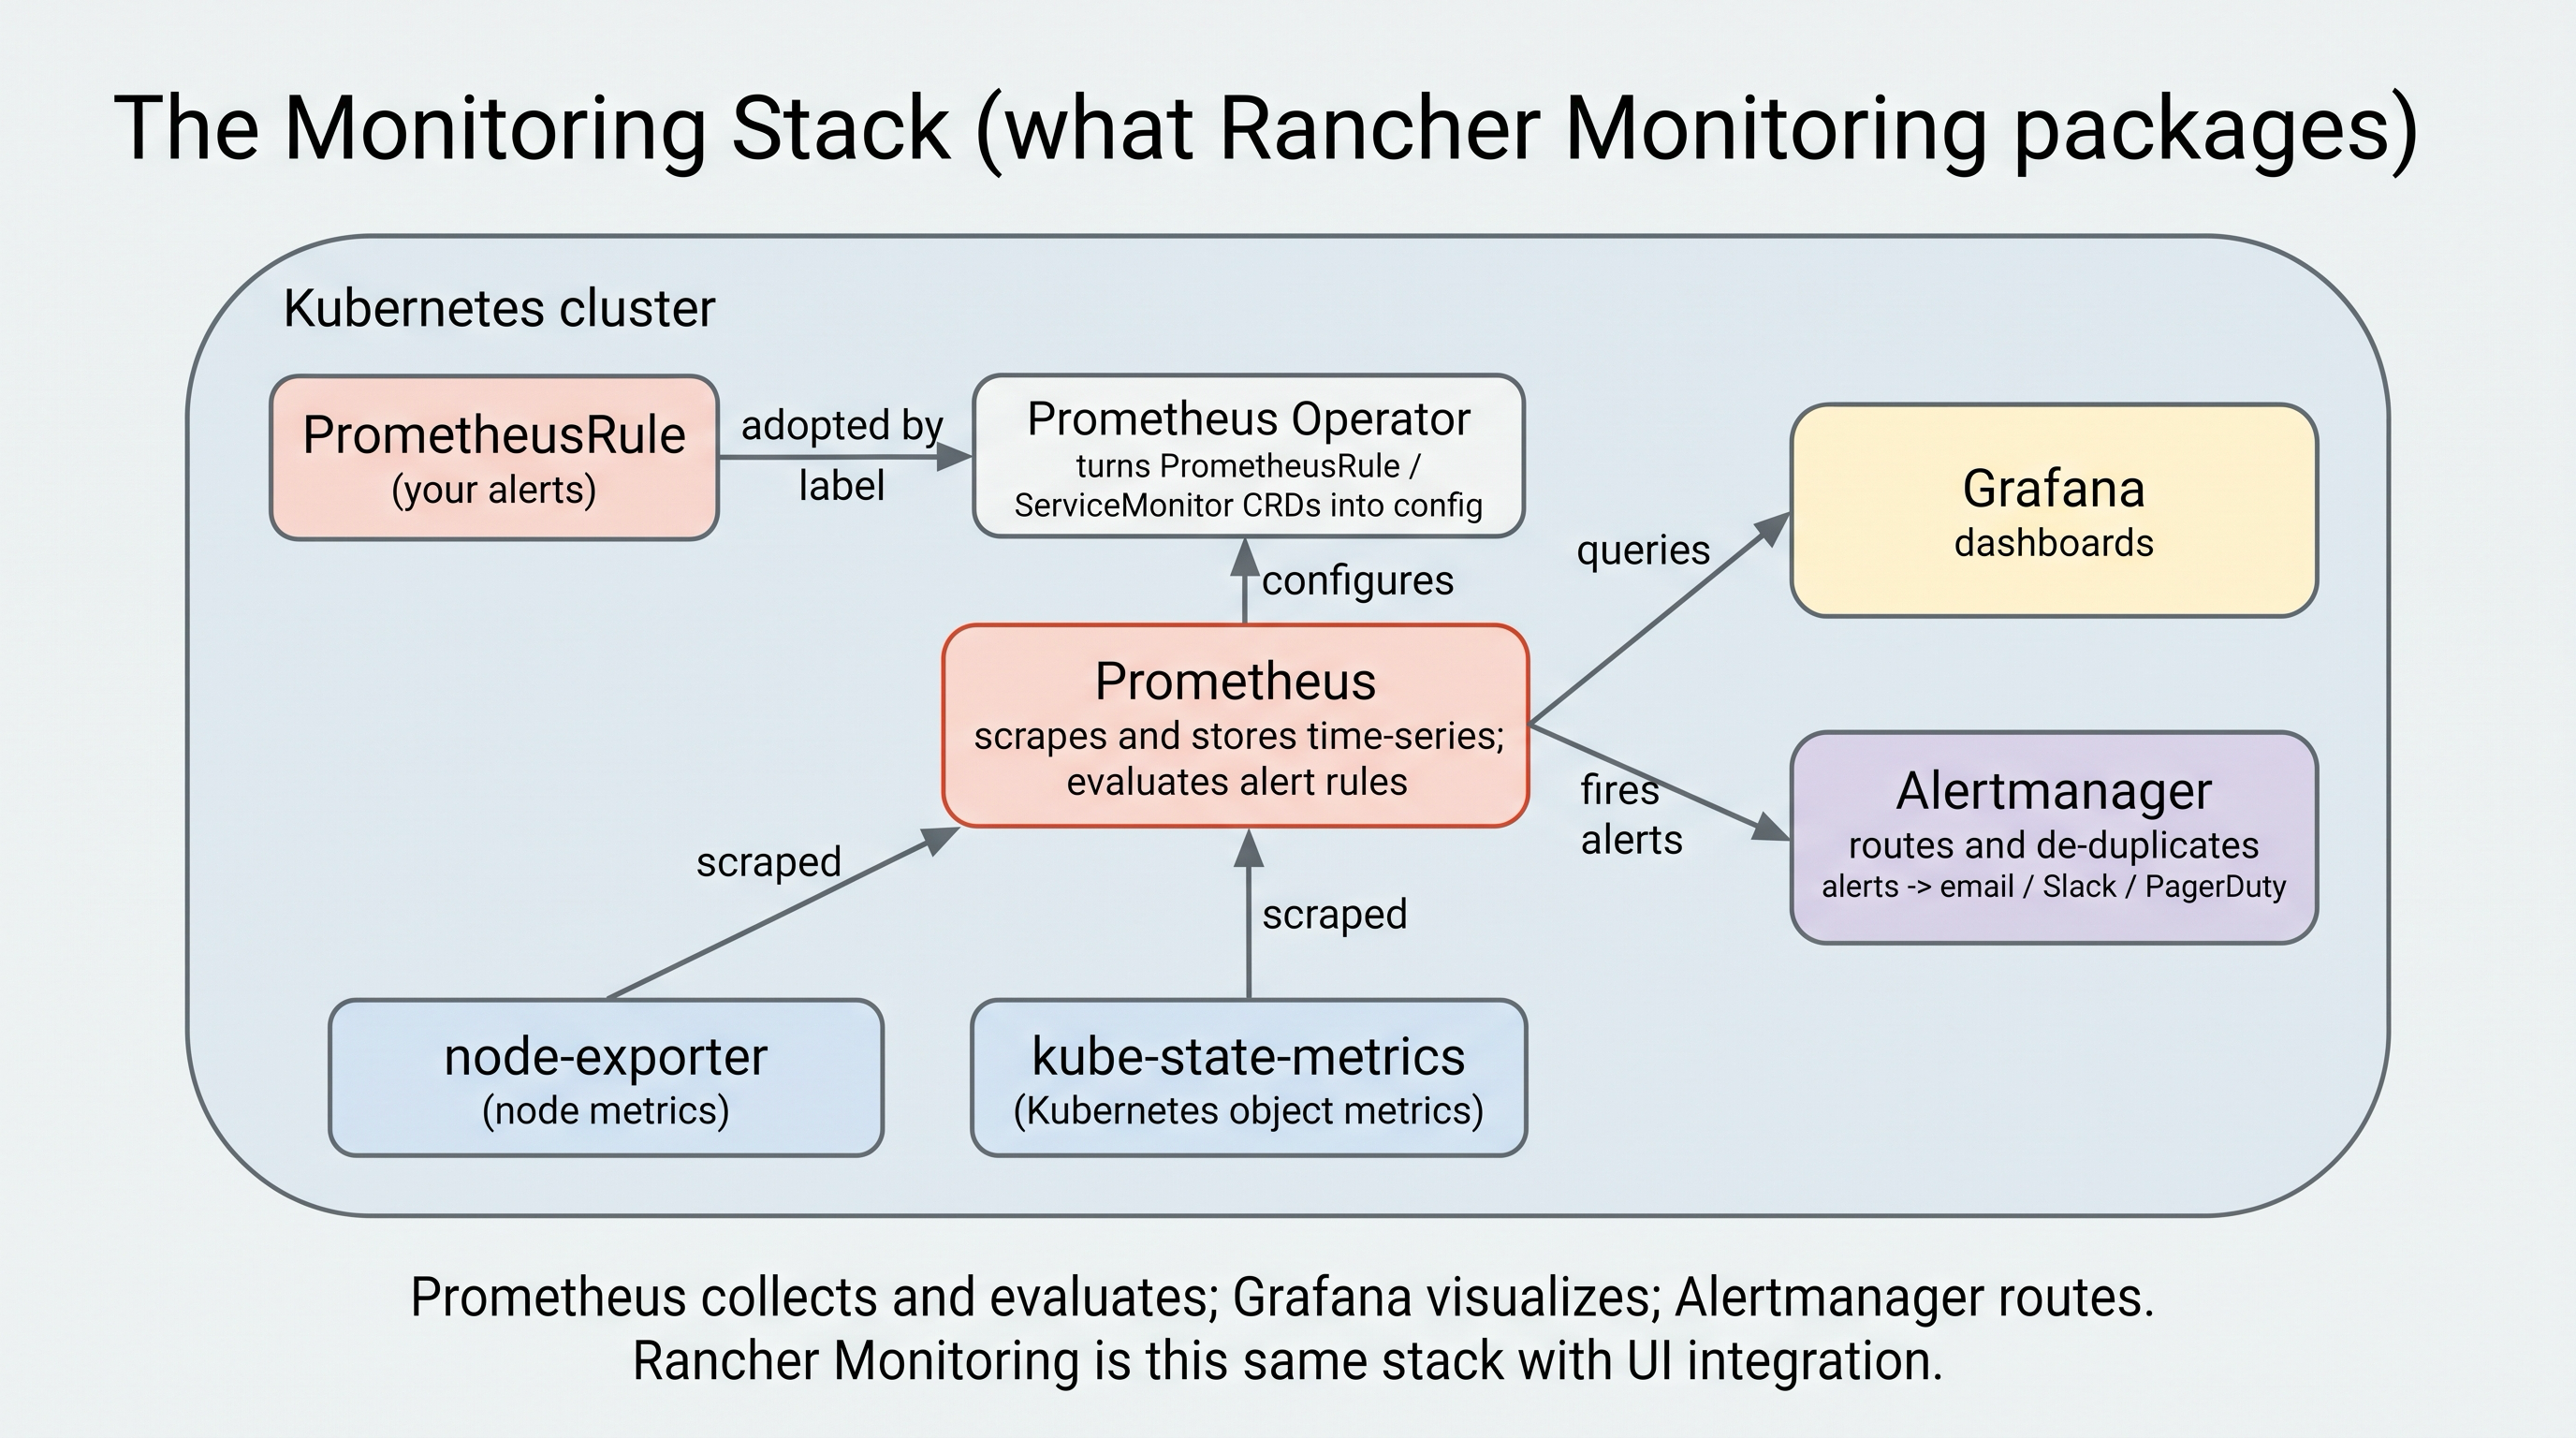
The stack: the Prometheus operator manages Prometheus (metrics), Grafana (dashboards), and Alertmanager (alert routing).
Rancher Monitoring and What It Packages
Rancher offers a one-click Monitoring app (under Cluster Tools in the UI) that deploys a full metrics-and-alerting stack and wires Prometheus and Grafana into the Rancher dashboard. Under the hood, that app is the community kube-prometheus-stack Helm chart with a Rancher wrapper. In this lesson you install that same chart directly, so you can see exactly what Rancher Monitoring deploys and where its pieces live. Everything you learn here maps straight to the Rancher UI.
New to this? What is Prometheus?
Prometheus is the metrics engine. It periodically scrapes numeric measurements - CPU usage, memory, request counts, pod restart totals - from the cluster's components and your workloads, and stores them as time series (a value tagged with labels, recorded over time). You query those series with its own language, PromQL, and Prometheus also evaluates alerting rules against them. In this stack it is the source of truth for "what is happening in the cluster, measured over time." It is a graduated CNCF project and the de facto standard for Kubernetes metrics.
New to this? What is Grafana?
Grafana is the visualization layer. On its own it stores no metrics - it connects to a data source (here, Prometheus) and renders the numbers as dashboards: graphs, gauges, and tables you can read at a glance. The kube-prometheus-stack ships Grafana pre-configured with Prometheus as its data source and a set of ready-made Kubernetes dashboards, so you get useful views the moment it starts. Where Prometheus answers queries, Grafana makes the answers human-friendly.
Why install the chart directly instead of clicking "Monitoring" in Rancher?
Rancher's Monitoring app is the production-friendly path: it installs the same stack and integrates Grafana and Prometheus into the Rancher UI, with sensible defaults and per-project scoping. It also has real resource requirements - Rancher's docs ask for roughly 2.7 CPU and 2 GiB of memory available for the monitoring stack on top of everything else, plus persistent storage. That is comfortable on a production cluster but tight on a small lab node that is already running Rancher.
So here we install kube-prometheus-stack directly with trimmed resource requests and short retention, which fits the lab and, more importantly, makes the stack's parts visible: you watch the operator, Prometheus, Grafana, and Alertmanager come up as ordinary Kubernetes objects. On a real cluster with room to spare, you would simply enable the Monitoring app from Cluster Tools and get the same components with the UI integration on top.
Step 1: Install the Monitoring Stack
Add the prometheus-community Helm repository and install kube-prometheus-stack into a monitoring namespace. The --set flags trim the footprint so it fits this lab node - short metric retention and no persistent volumes - and expose Grafana on a NodePort (30300) so you can open it in the browser through the Grafana tab.
From the dev-machine terminal:
helm repo add prometheus-community https://prometheus-community.github.io/helm-charts
helm repo update

helm install monitoring prometheus-community/kube-prometheus-stack \
  --namespace monitoring \
  --create-namespace \
  --set grafana.service.type=NodePort \
  --set grafana.service.nodePort=30300 \
  --set prometheus.prometheusSpec.retention=2h \
  --set prometheus.prometheusSpec.resources.requests.cpu=100m \
  --set prometheus.prometheusSpec.resources.requests.memory=256Mi \
  --set grafana.resources.requests.cpu=50m \
  --set grafana.resources.requests.memory=128Mi \
  --set alertmanager.alertmanagerSpec.resources.requests.cpu=25m \
  --set alertmanager.alertmanagerSpec.resources.requests.memory=64Mi
What does kube-prometheus-stack actually deploy?
The chart installs several cooperating pieces:
- Prometheus operator - a controller that turns high-level custom resources (like
PrometheusandPrometheusRule) into running Prometheus configuration. It registers themonitoring.coreos.comCRDs. - Prometheus - the time-series database and scraper. It collects metrics from the cluster's components and your workloads.
- Grafana - the dashboards. It queries Prometheus and renders the graphs you look at.
- Alertmanager - routes and de-duplicates alerts that Prometheus fires, and sends them to receivers (email, Slack, PagerDuty, and so on).
- node-exporter and kube-state-metrics - agents that expose node-level and Kubernetes-object metrics for Prometheus to scrape.
The operator is the key idea: you do not hand-write Prometheus config files. You create PrometheusRule and ServiceMonitor objects, and the operator reconciles Prometheus to match - the same declarative pattern as the rest of Kubernetes.
Step 2: Confirm Prometheus and Grafana Are Running
The stack takes a couple of minutes to pull images and start. Watch it come up:
kubectl -n monitoring get pods
You are looking for a running prometheus-* pod and a grafana pod, alongside the operator, Alertmanager, and the exporters.
Step 3: Open Grafana in the Browser
Because you installed Grafana with grafana.service.type=NodePort on port 30300, this playground's Grafana tab points straight at it. Open the Grafana tab - Grafana loads in a new browser tab and shows its login page.
Log in with the username admin. The password is generated at install and stored in a secret; print it from the dev-machine terminal:
kubectl -n monitoring get secret monitoring-grafana \
  -o jsonpath='{.data.admin-password}' | base64 -d; echo
Copy that value into the Grafana login.
If the Grafana tab shows an error the first time, Grafana is not up yet - give the monitoring-grafana pod a moment to become ready (Step 2), then reload the tab.
Once you are in, browse Dashboards and open one of the "Kubernetes / Compute Resources" views to see live cluster metrics. Because this cluster already runs Rancher, the graphs are full of real activity from the moment you open them. This is the same Grafana that Rancher Monitoring surfaces inside the Rancher UI.
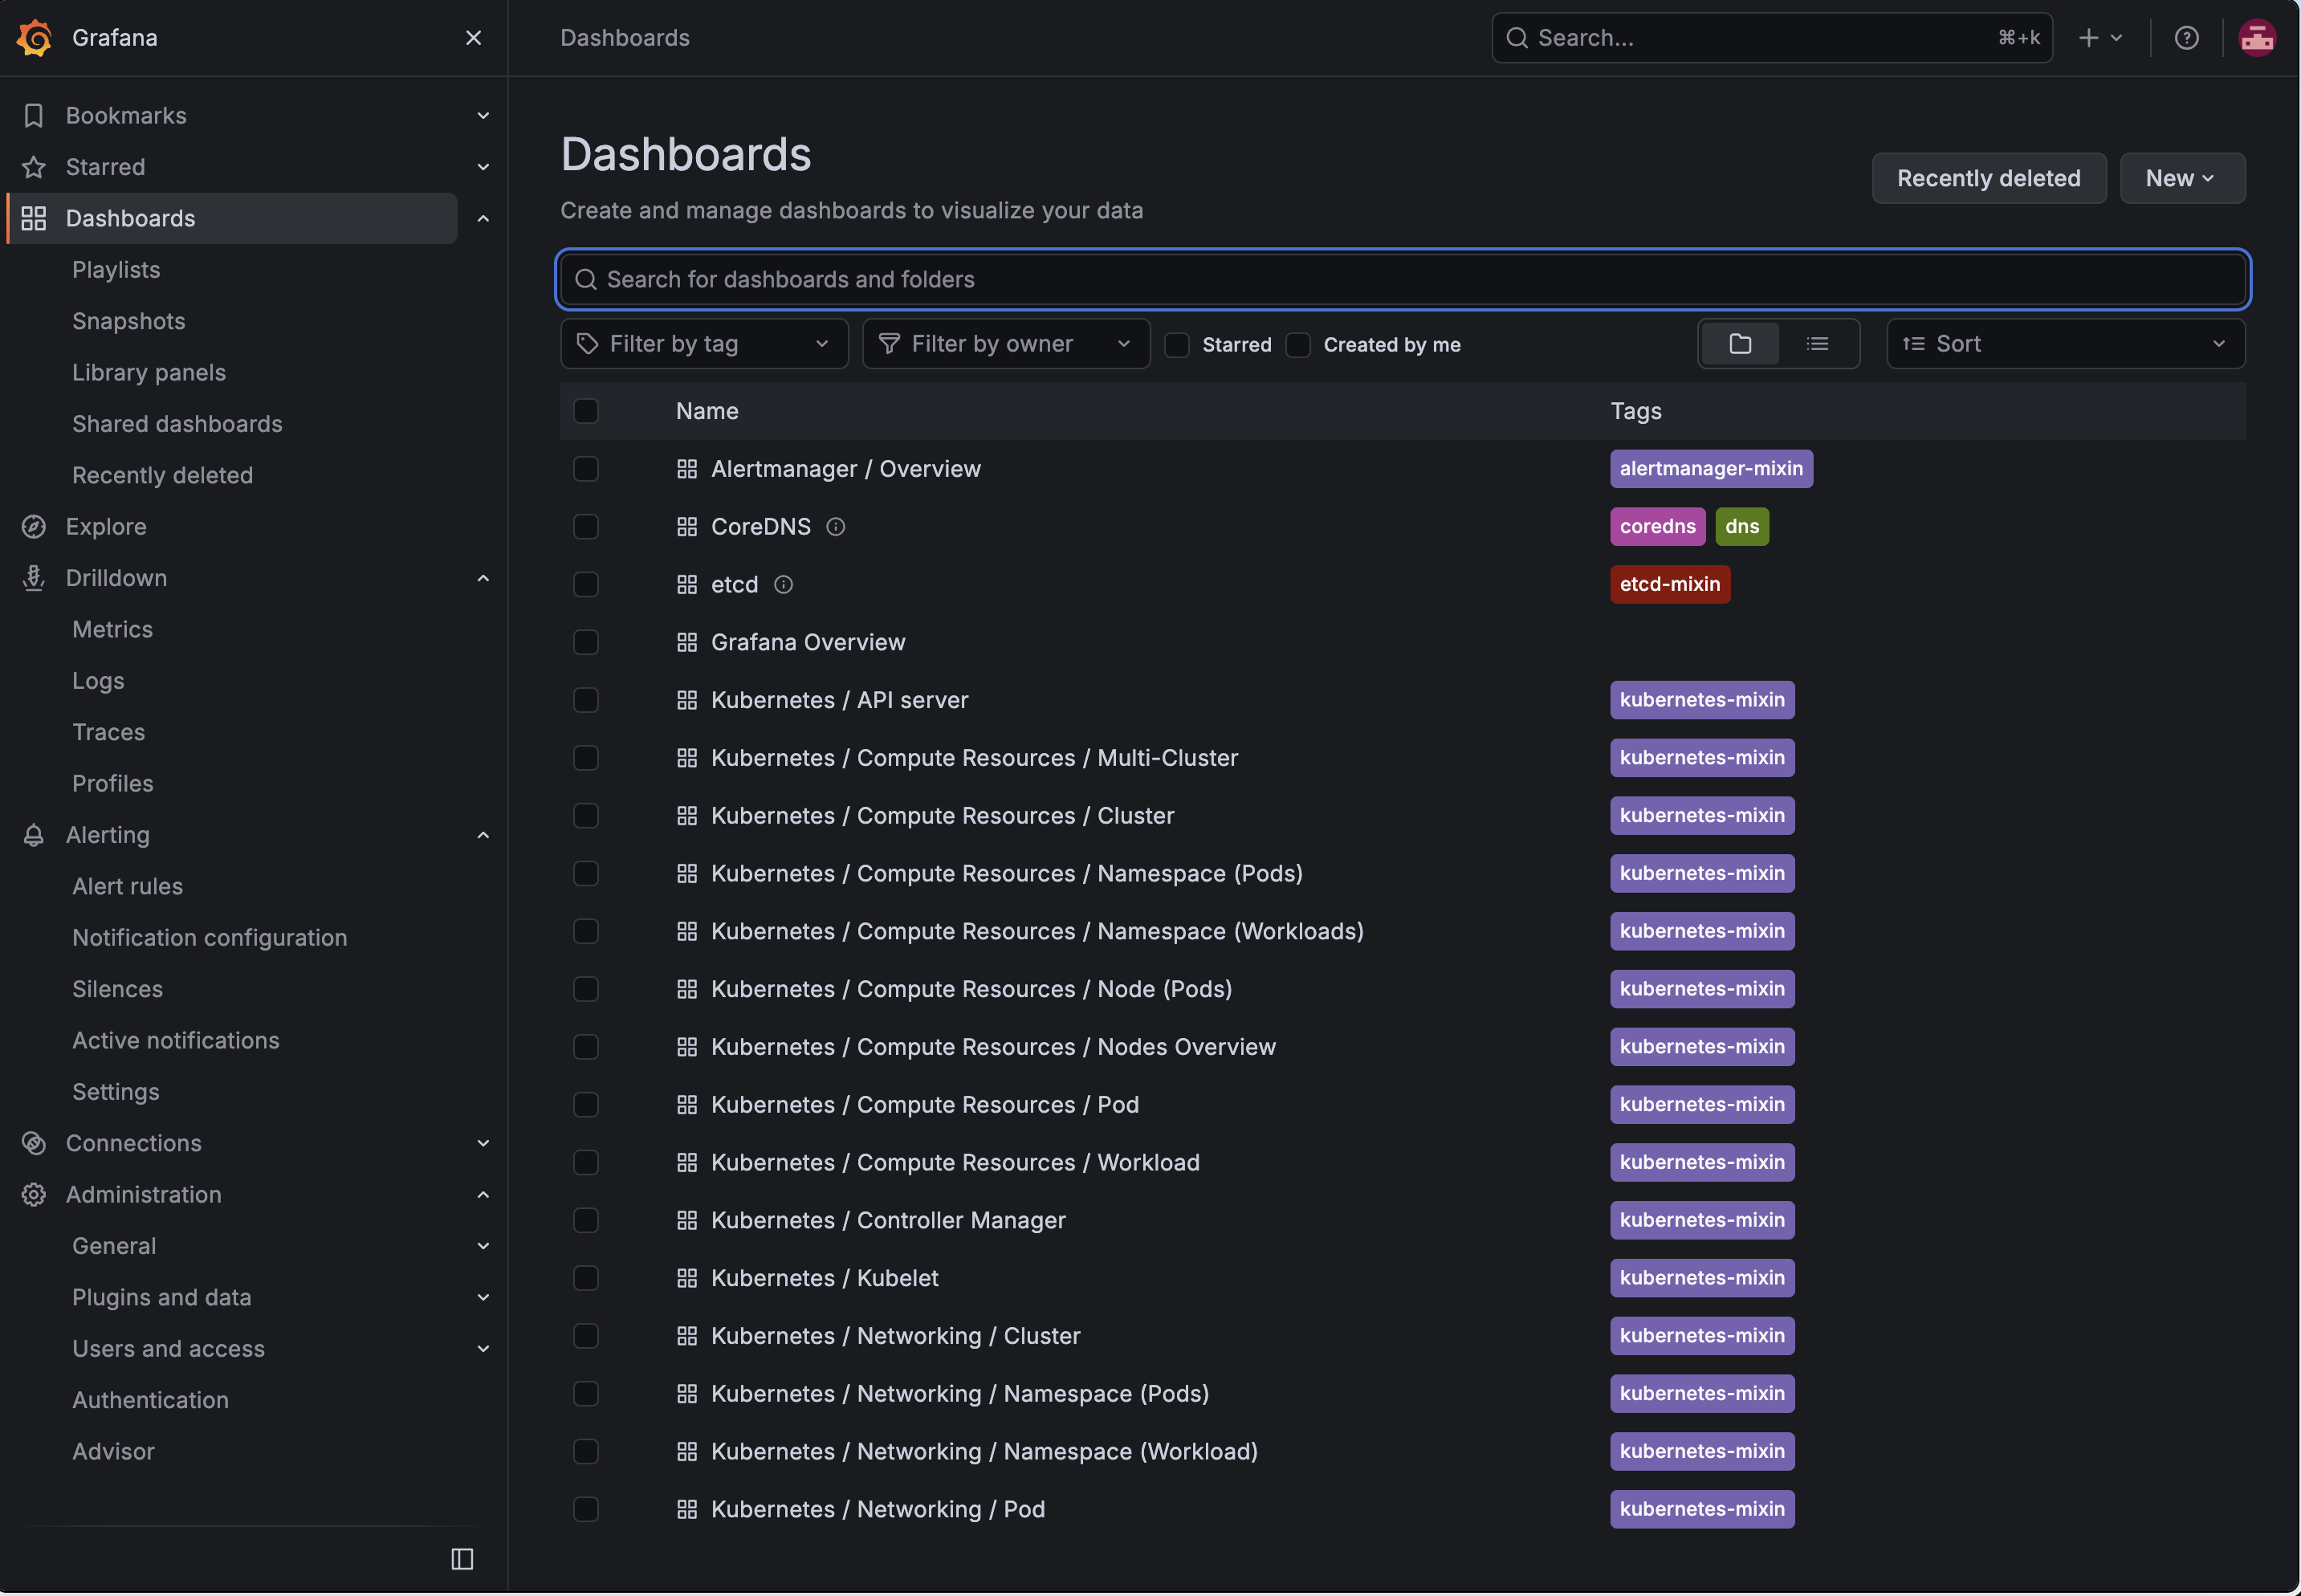
Grafana's Dashboards list, pre-populated by kube-prometheus-stack - the "Kubernetes / Compute Resources" views show live cluster metrics.
Step 4: Break Something, Then Alert on It
Metrics are only half of observability - you also want to be told when something is wrong. The best way to see alerting work is to cause a real problem and watch Prometheus catch it. Deploy a pod that crashes on start, so it enters a crash loop:
kubectl create namespace demo
kubectl -n demo run crasher --image=busybox --restart=Always -- /bin/sh -c "exit 1"
The container exits immediately, Kubernetes restarts it, it exits again, and within a minute it is in CrashLoopBackOff with a climbing restart count:
kubectl -n demo get pod crasher
Now define a PrometheusRule that alerts when that pod has restarted too many times. Prometheus fires alerts from these objects, and the operator only adopts rules whose labels match its selector - so include the stack's release label:
apiVersion: monitoring.coreos.com/v1
kind: PrometheusRule
metadata:
  name: my-alerts
  namespace: monitoring
  labels:
    release: monitoring
spec:
  groups:
    - name: example
      rules:
        - alert: PodCrashLooping
          expr: kube_pod_container_status_restarts_total{namespace="demo", pod=~"crasher.*"} > 3
          for: 1m
          labels:
            severity: warning
          annotations:
            summary: "The crasher pod is crash-looping"
Apply it from the workstation:
kubectl apply -f my-alerts.yaml

Applying the PrometheusRule - the cluster confirms prometheusrule.monitoring.coreos.com/my-alerts created.
How to create the file
Create the file on the dev-machine workstation. Open an editor:
vi my-alerts.yaml
In vi, press i to enter insert mode, paste the YAML above, then press Esc and type :wq and Enter to save and quit. The file lands in your home directory (/home/laborant), so kubectl apply -f my-alerts.yaml from the same directory picks it up.
Prefer a different editor or no editor at all? You can also write the file in one shot with a here-document:
cat <<'EOF' > my-alerts.yaml
apiVersion: monitoring.coreos.com/v1
kind: PrometheusRule
metadata:
  name: my-alerts
  namespace: monitoring
  labels:
    release: monitoring
spec:
  groups:
    - name: example
      rules:
        - alert: PodCrashLooping
          expr: kube_pod_container_status_restarts_total{namespace="demo", pod=~"crasher.*"} > 3
          for: 1m
          labels:
            severity: warning
          annotations:
            summary: "The crasher pod is crash-looping"
EOF
Why this expression, and not a rate or increase?
The metric kube_pod_container_status_restarts_total is a counter - it only ever grows. Once the crasher has restarted more than three times, the expression stays true, so the alert reliably completes its for: 1m window and fires - and keeps firing. A tempting alternative like increase(...[2m]) > 2 looks at a sliding window, which can dip just under the threshold between scrapes and reset the alert's timer, so it flickers and may never fire. For a lab where you want to see the alert trip, a monotonic counter threshold is the dependable choice.
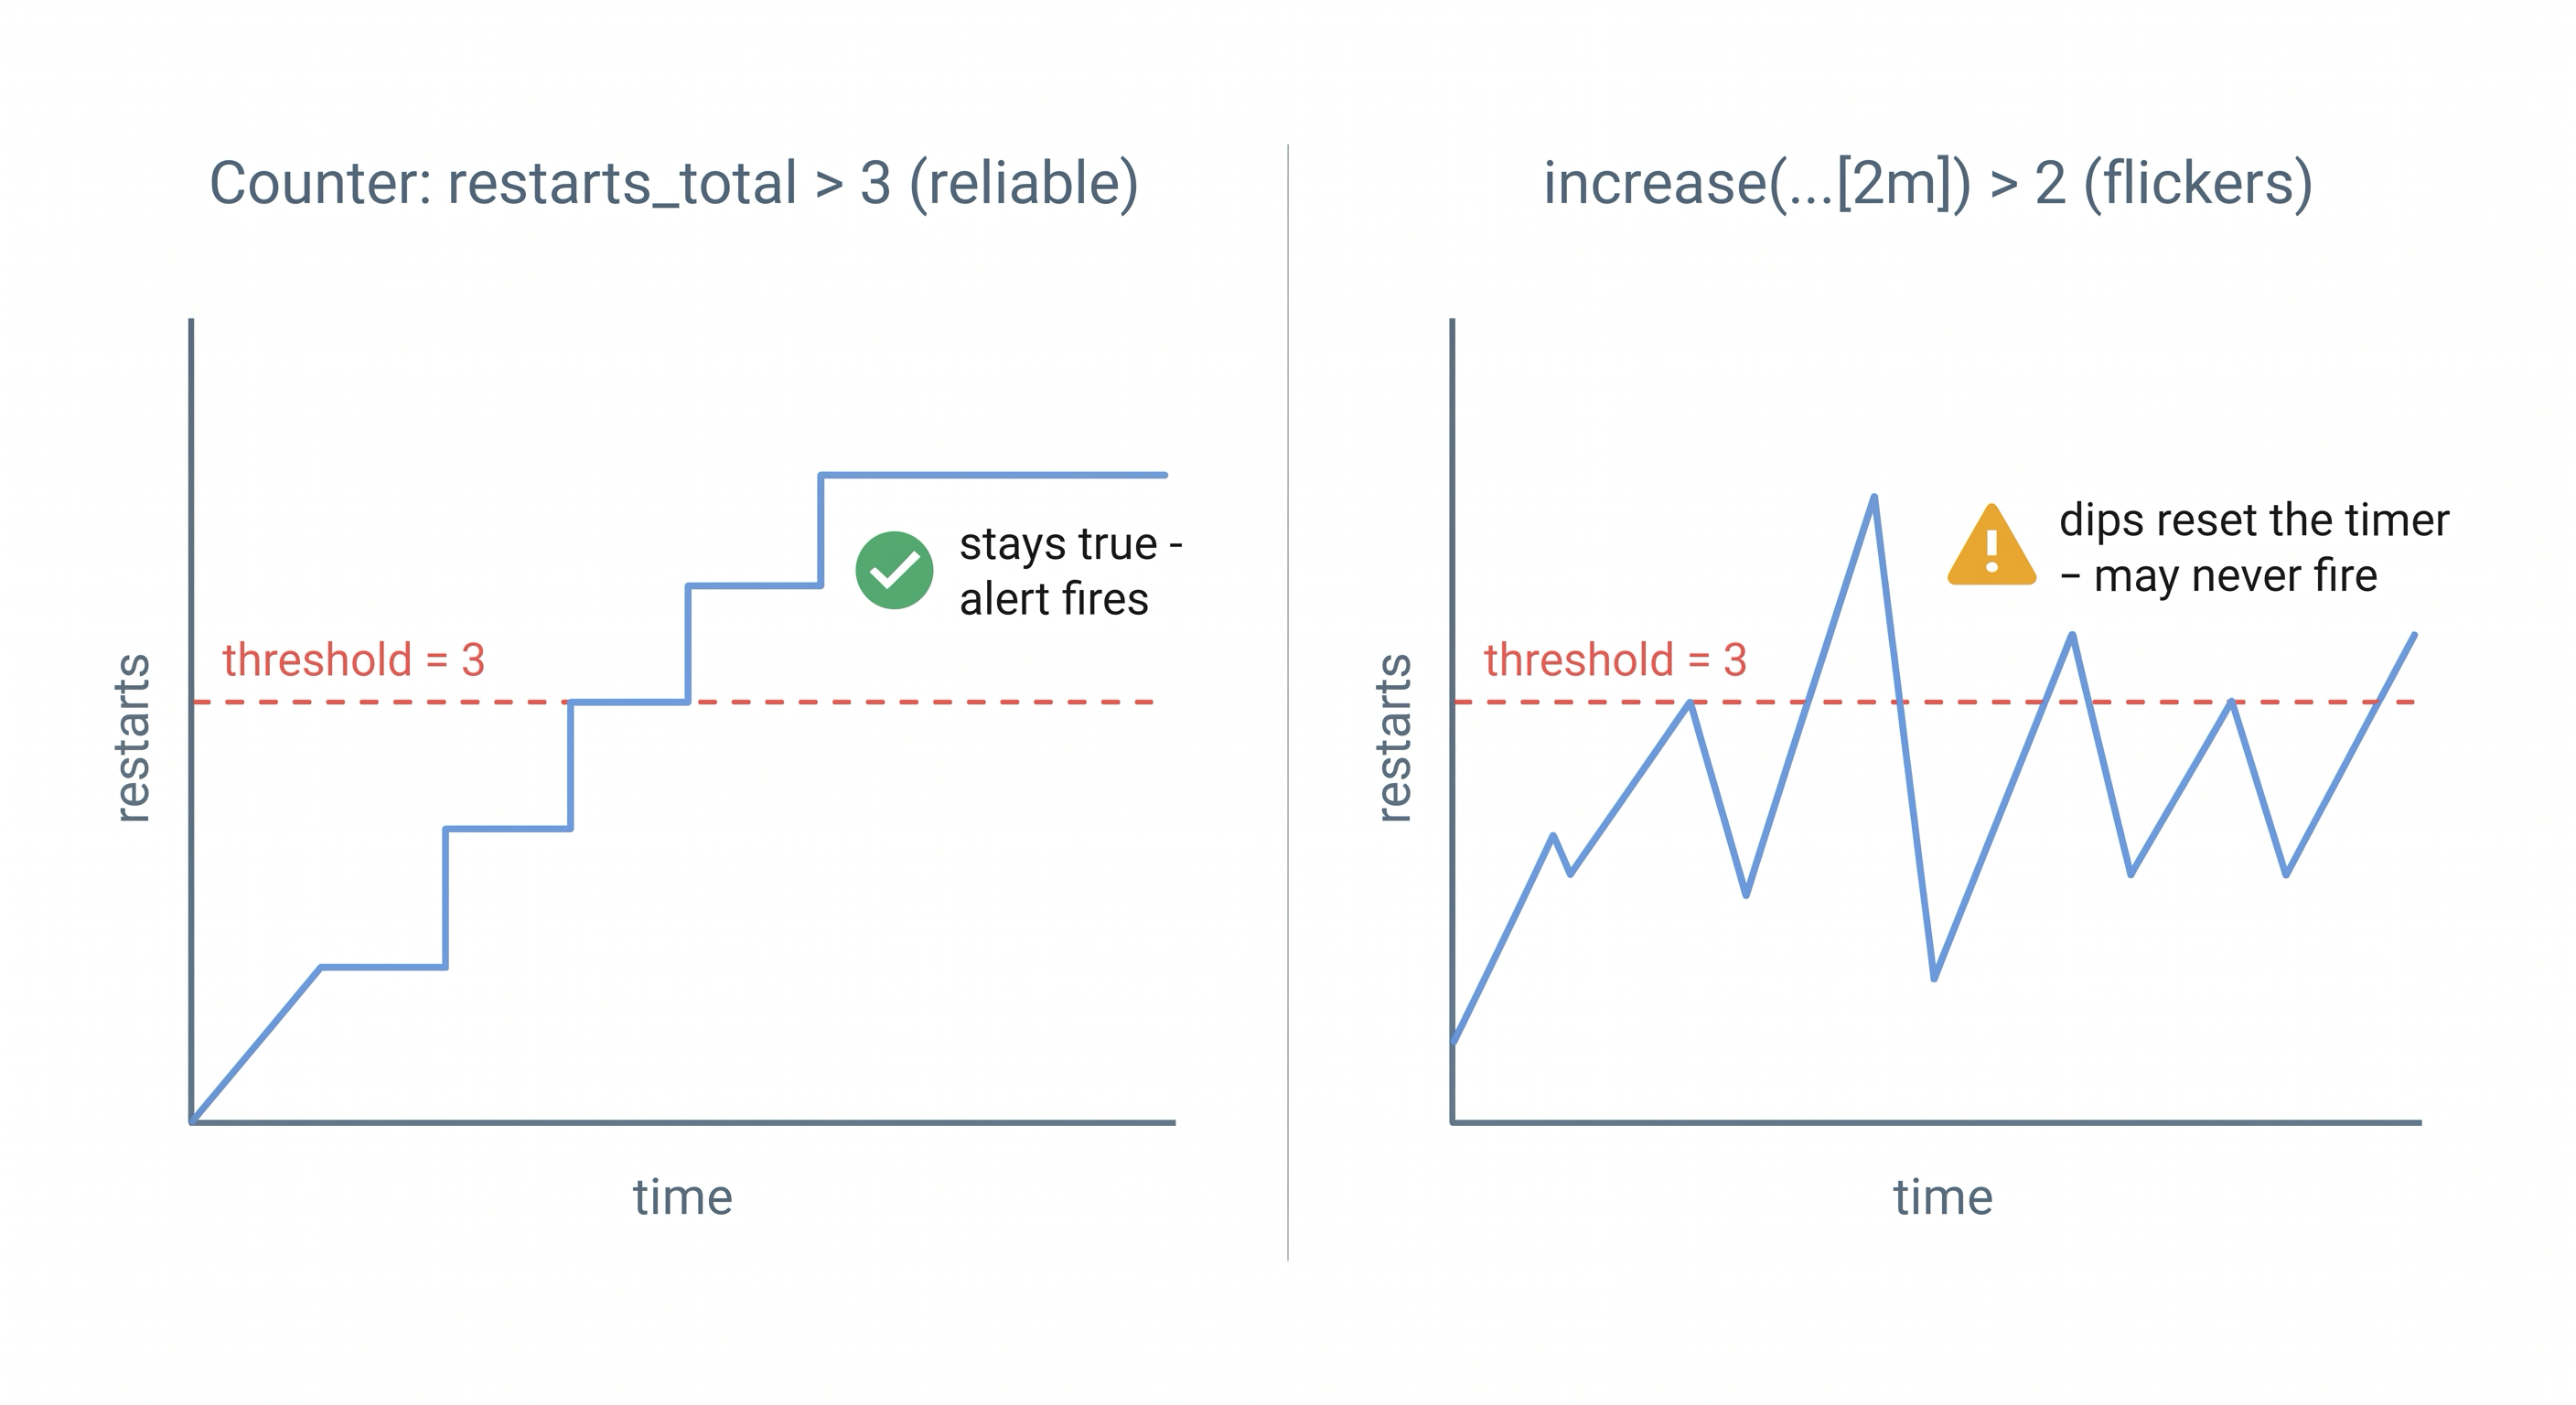
A monotonic counter stays above the threshold once crossed (left), while a sliding-window increase can dip and reset the alert timer (right).
Step 5: Watch the Alert Fire
An alert does not fire the instant you create it. It moves through states: inactive (condition false), pending (condition true, waiting out the for: window), then firing. With a crash-looping pod the whole trip takes a few minutes - crash-loop backoff slows the restarts, then Prometheus scrapes, then the one-minute for: elapses.
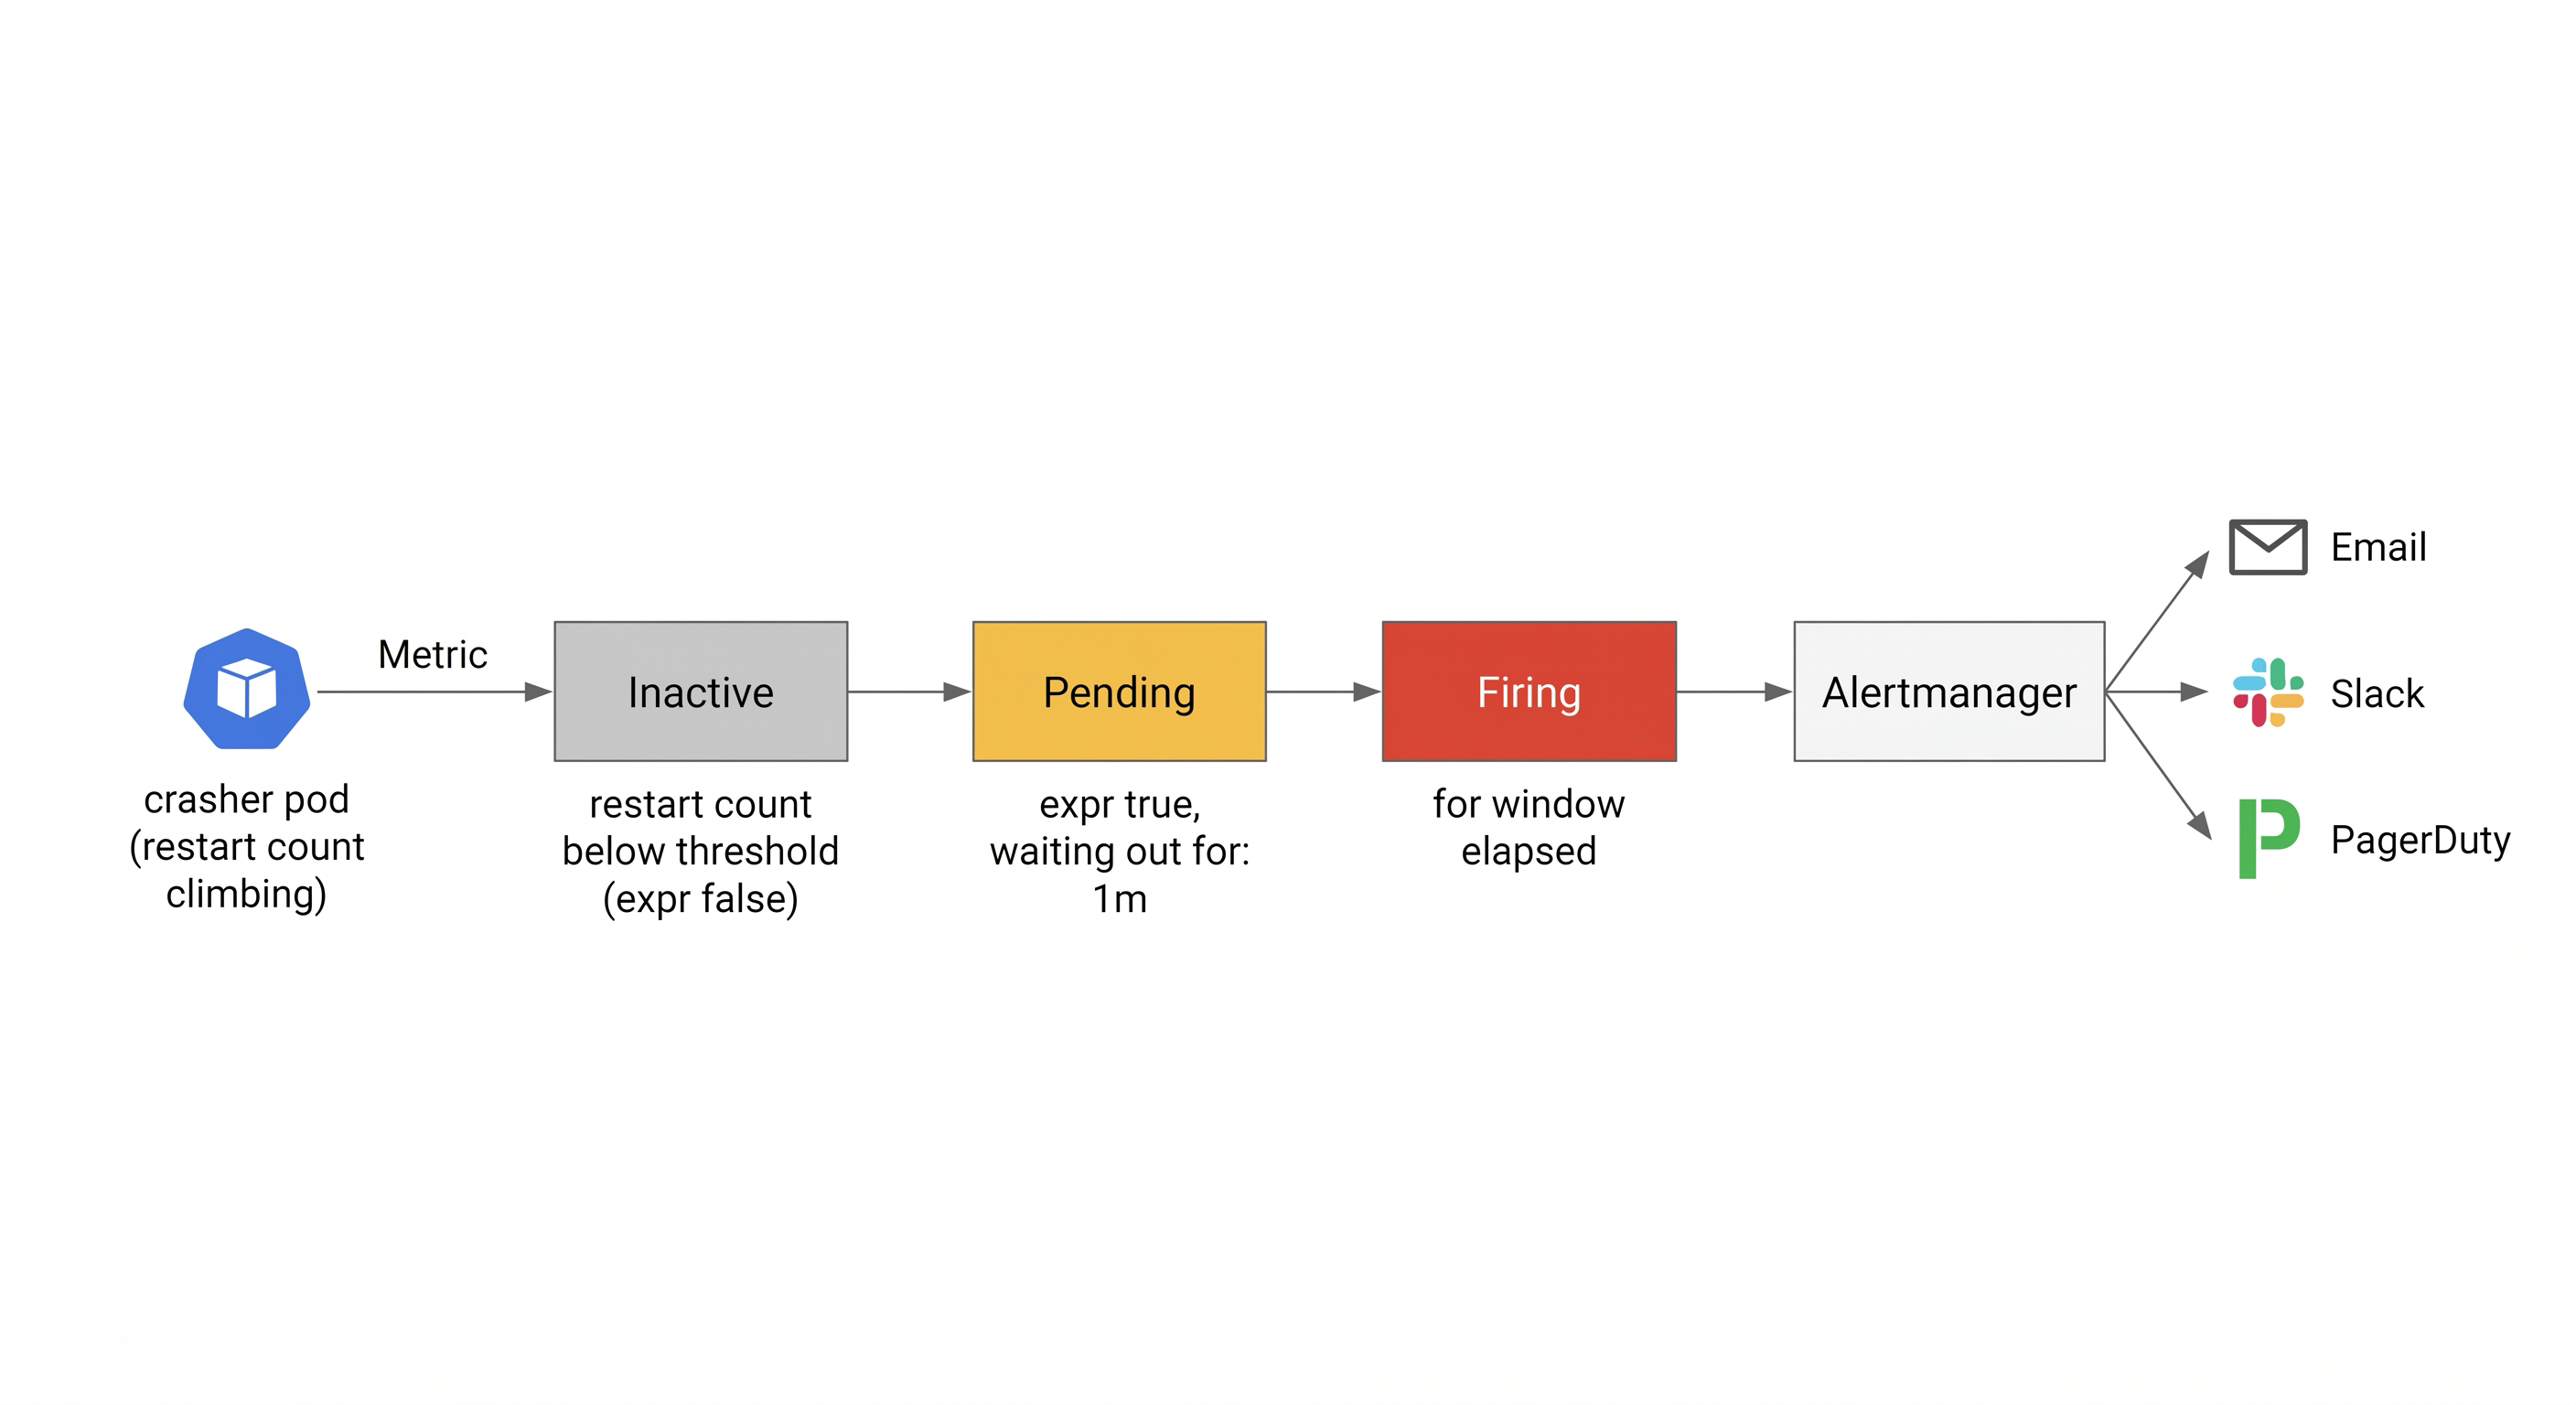
An alert travels from inactive to pending to firing; once firing, Prometheus hands it to Alertmanager for routing.
Watch the state change from the dev-machine terminal. This loop briefly forwards the Prometheus port to the workstation and queries the alert's state every 15 seconds:
while true; do
  kubectl -n monitoring port-forward svc/monitoring-kube-prometheus-prometheus 9099:9090 >/dev/null 2>&1 &
  PF=$!; sleep 3
  STATE=$(curl -sf -G 'http://127.0.0.1:9099/api/v1/query' \
    --data-urlencode 'query=ALERTS{alertname="PodCrashLooping"}' \
    | grep -o '"alertstate":"[a-z]*"' | head -1)
  kill $PF 2>/dev/null
  echo "$(date +%T) PodCrashLooping: ${STATE:-inactive}"
  echo "$STATE" | grep -q firing && break
  sleep 12
done
You will see it print pending for a minute or so, then flip to firing. Press Ctrl+C to stop the loop once it fires.
You can also see it visually in Grafana. Open the Grafana tab, go to Alerting > Alert rules, and find PodCrashLooping - it shows the same Pending, then Firing transition. Alertmanager (which the stack also installed) is what would route that firing alert to email, Slack, or PagerDuty in a real setup.
Rancher's built-in rules caught it too
If you look at the Alerts page, you will notice the stack's own KubePodCrashLooping rule also picked up your crasher and went pending. The kube-prometheus-stack ships a large set of sensible default alerts for exactly these common failures, so in practice you get broad coverage out of the box and add your own rules for application-specific conditions - which is precisely what you just did.
Why the release label matters
The Prometheus operator does not adopt every PrometheusRule in the cluster - it only picks up the ones whose labels match the ruleSelector configured on the Prometheus object. The kube-prometheus-stack chart sets that selector to match its Helm release label, so a rule needs release: monitoring (matching the release name you installed) to be loaded. Leave it off and your rule is a valid object that Prometheus simply ignores - a common and confusing first mistake. You can confirm a rule was adopted in the Prometheus UI under Status > Rules.
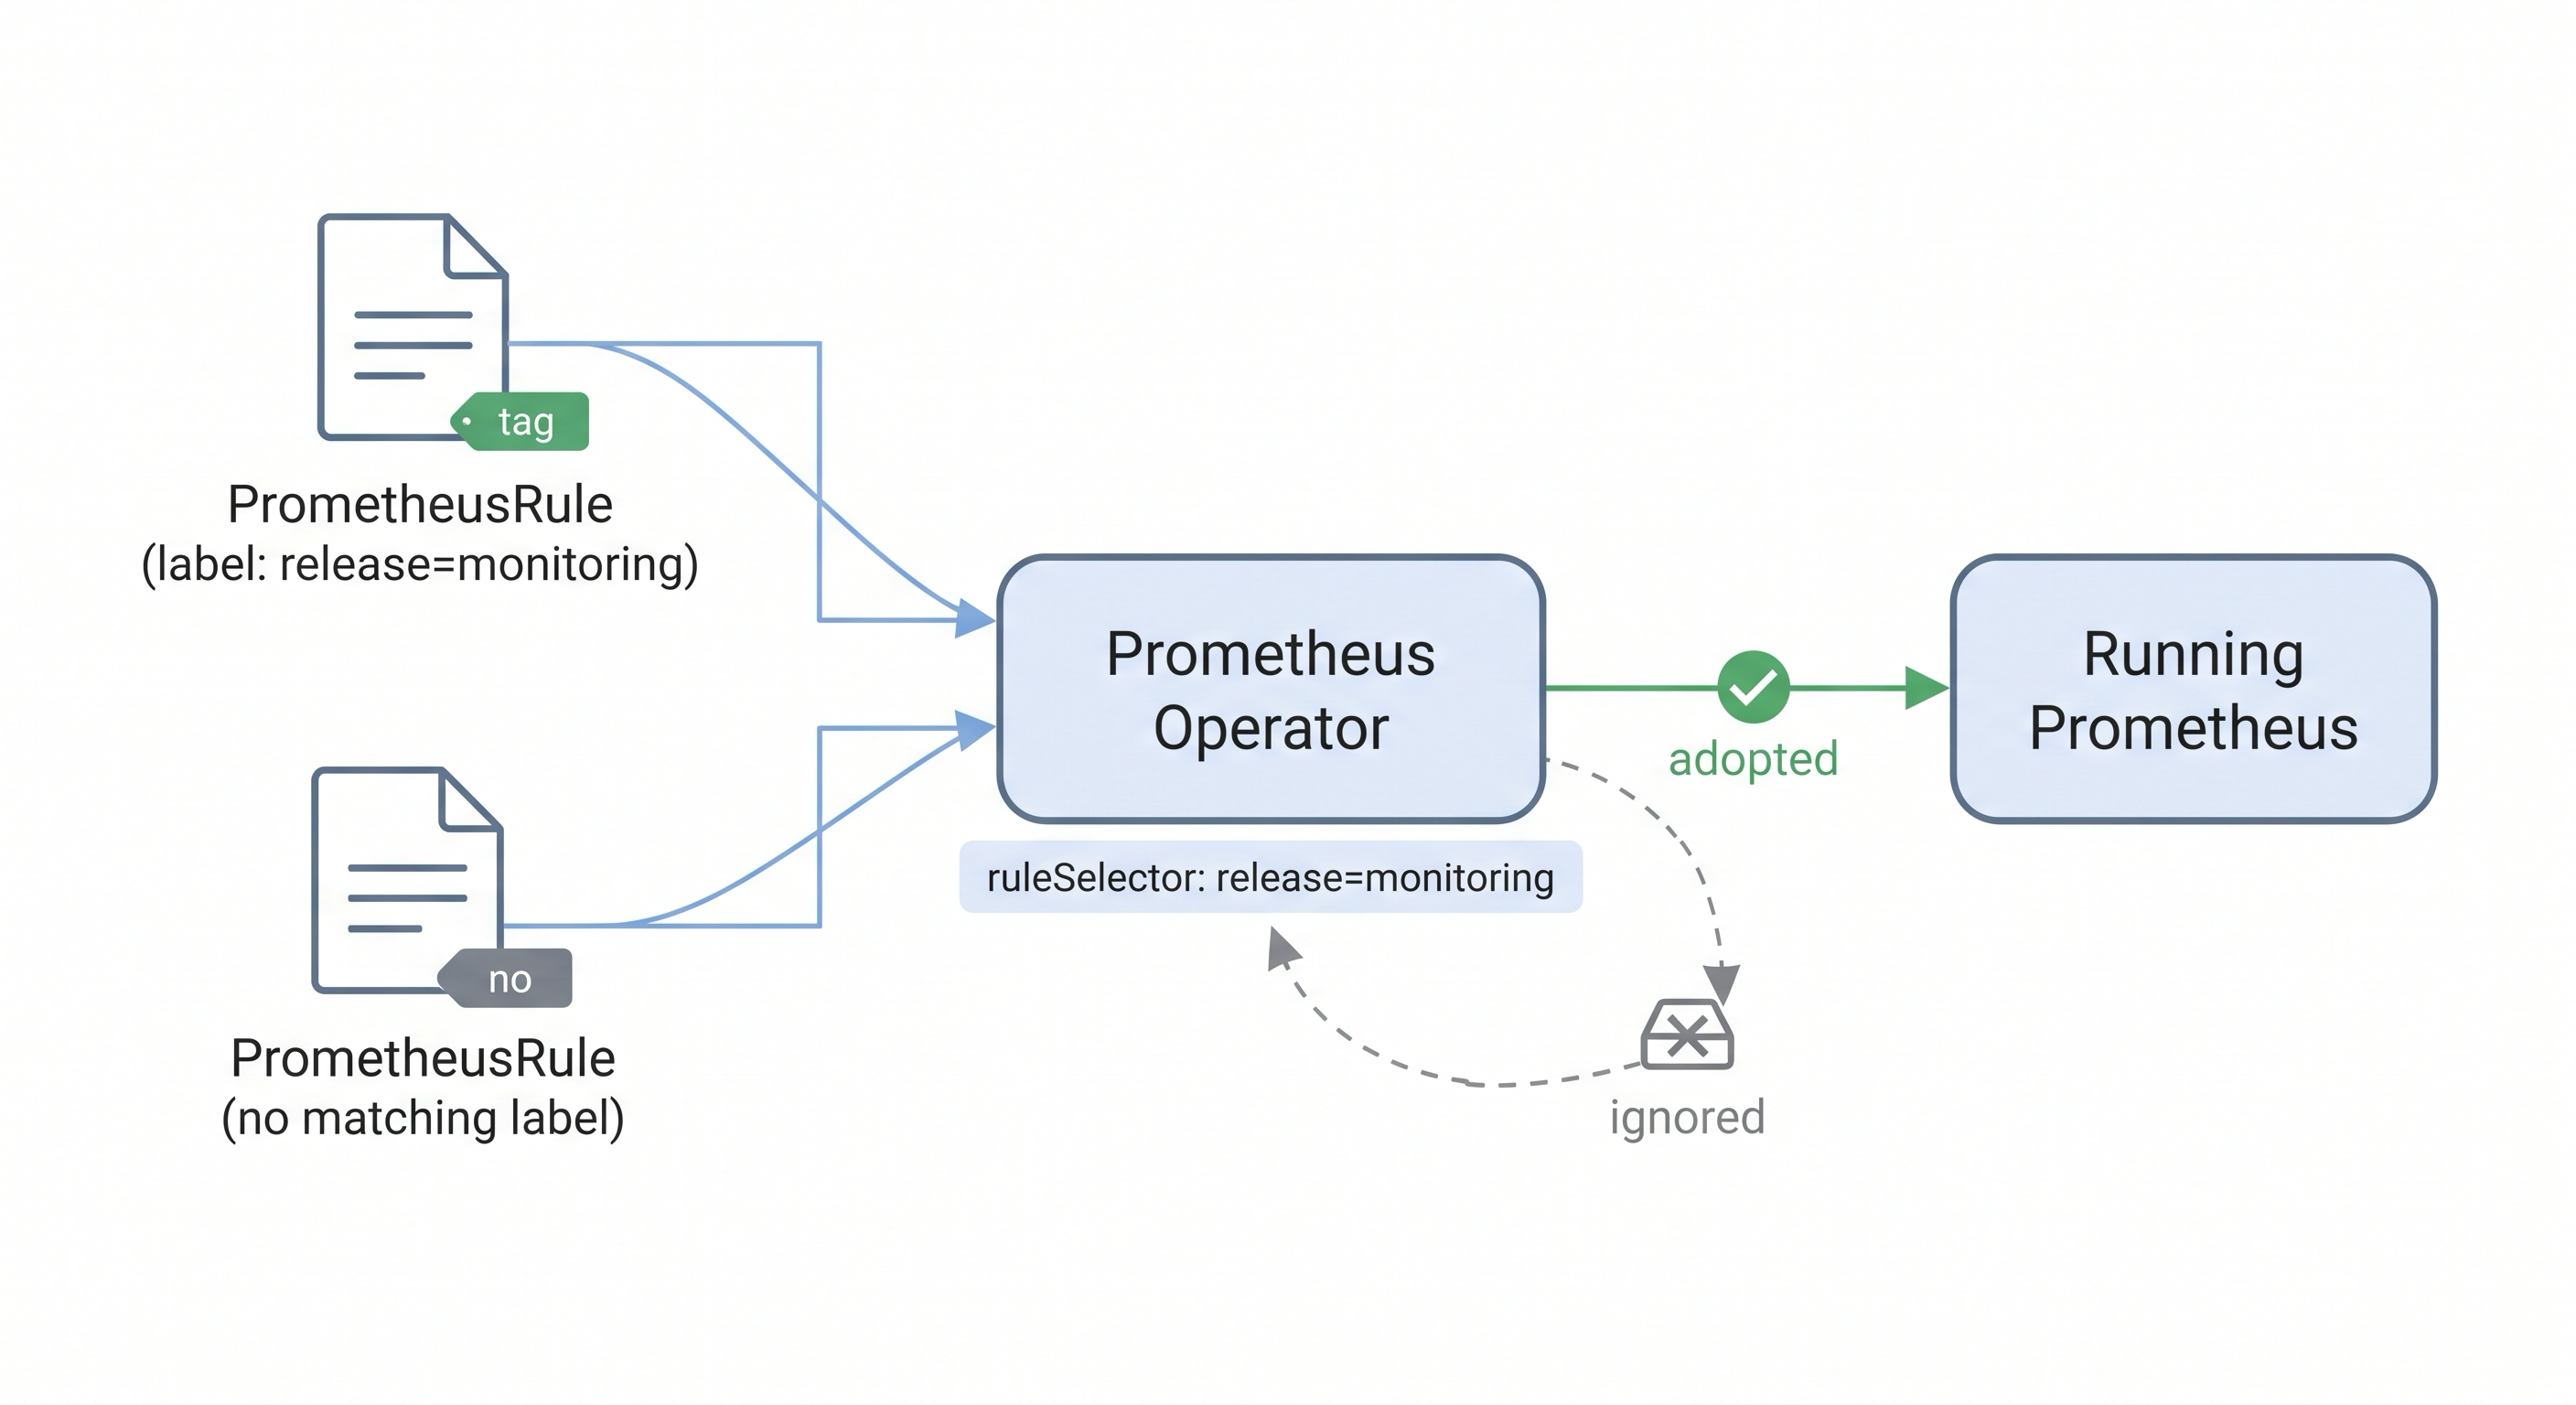
The operator only loads PrometheusRules whose labels match its selector; a rule missing the release label is silently ignored.
Step 6: Build Your Own Dashboard
Browsing the built-in dashboards is one thing; building your own is where Grafana earns its place. Now that the crasher pod has been restarting for a few minutes, its restart count is a perfect live metric to graph. You will create a small dashboard with a single panel that tracks it.
Forgot the Grafana login?
Grafana logs in with the username admin. The password was generated at install and is kept in a Kubernetes secret - reprint it any time from the dev-machine terminal:
kubectl -n monitoring get secret monitoring-grafana \
  -o jsonpath='{.data.admin-password}' | base64 -d; echo
Copy that value into the Grafana login. If the Grafana tab is blank or shows a connection error, Grafana's proxy just needs a moment - reload the tab a couple of times.
Open the Grafana tab and, in the left menu, choose Dashboards > New > New dashboard. Grafana asks how to lay out the dashboard - choose Auto grid (the simpler default; with a single panel the choice does not matter).
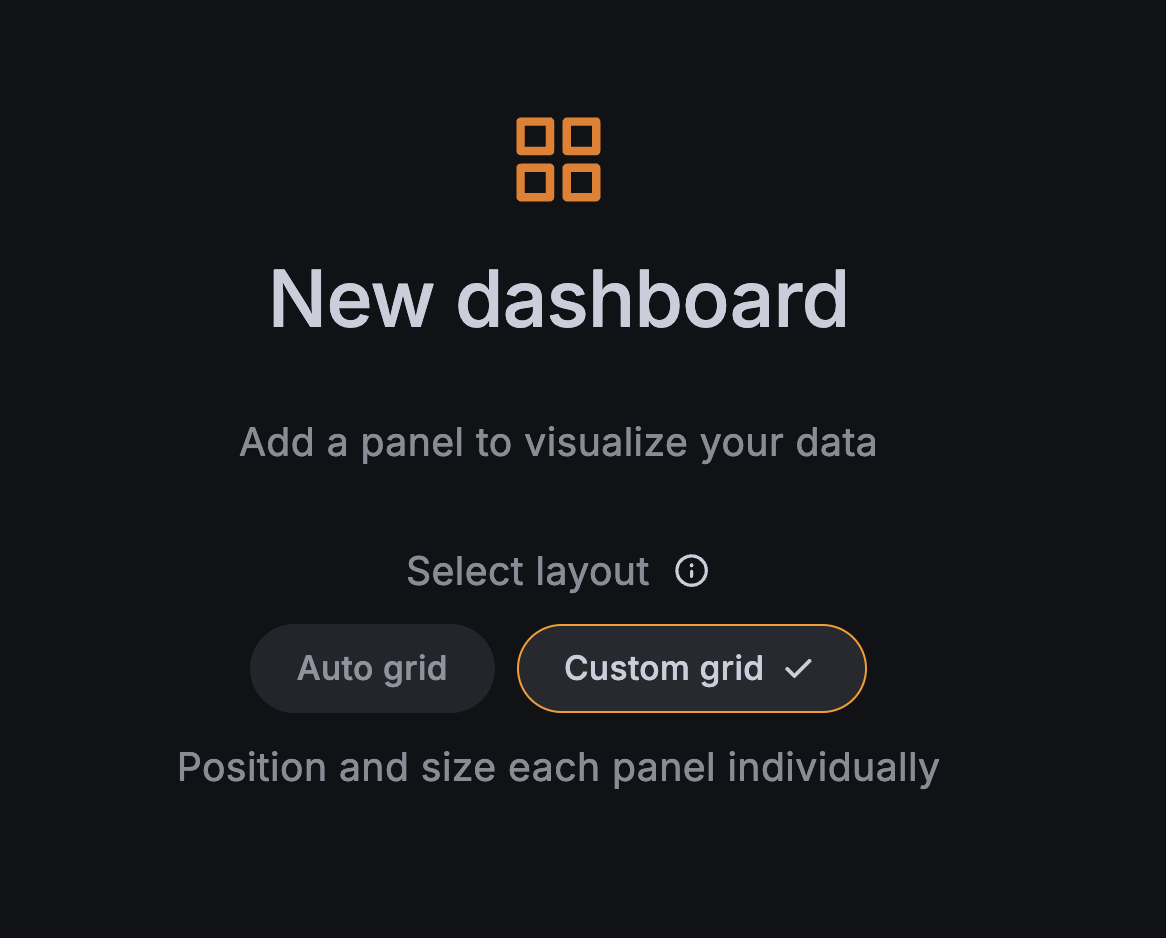
A new dashboard offers an Auto grid or Custom grid layout - Auto grid is fine here.
Now add a panel: click the + Add new element button and choose Panel. The empty panel appears with a blue Configure visualization button in its middle - click it to open the panel editor.
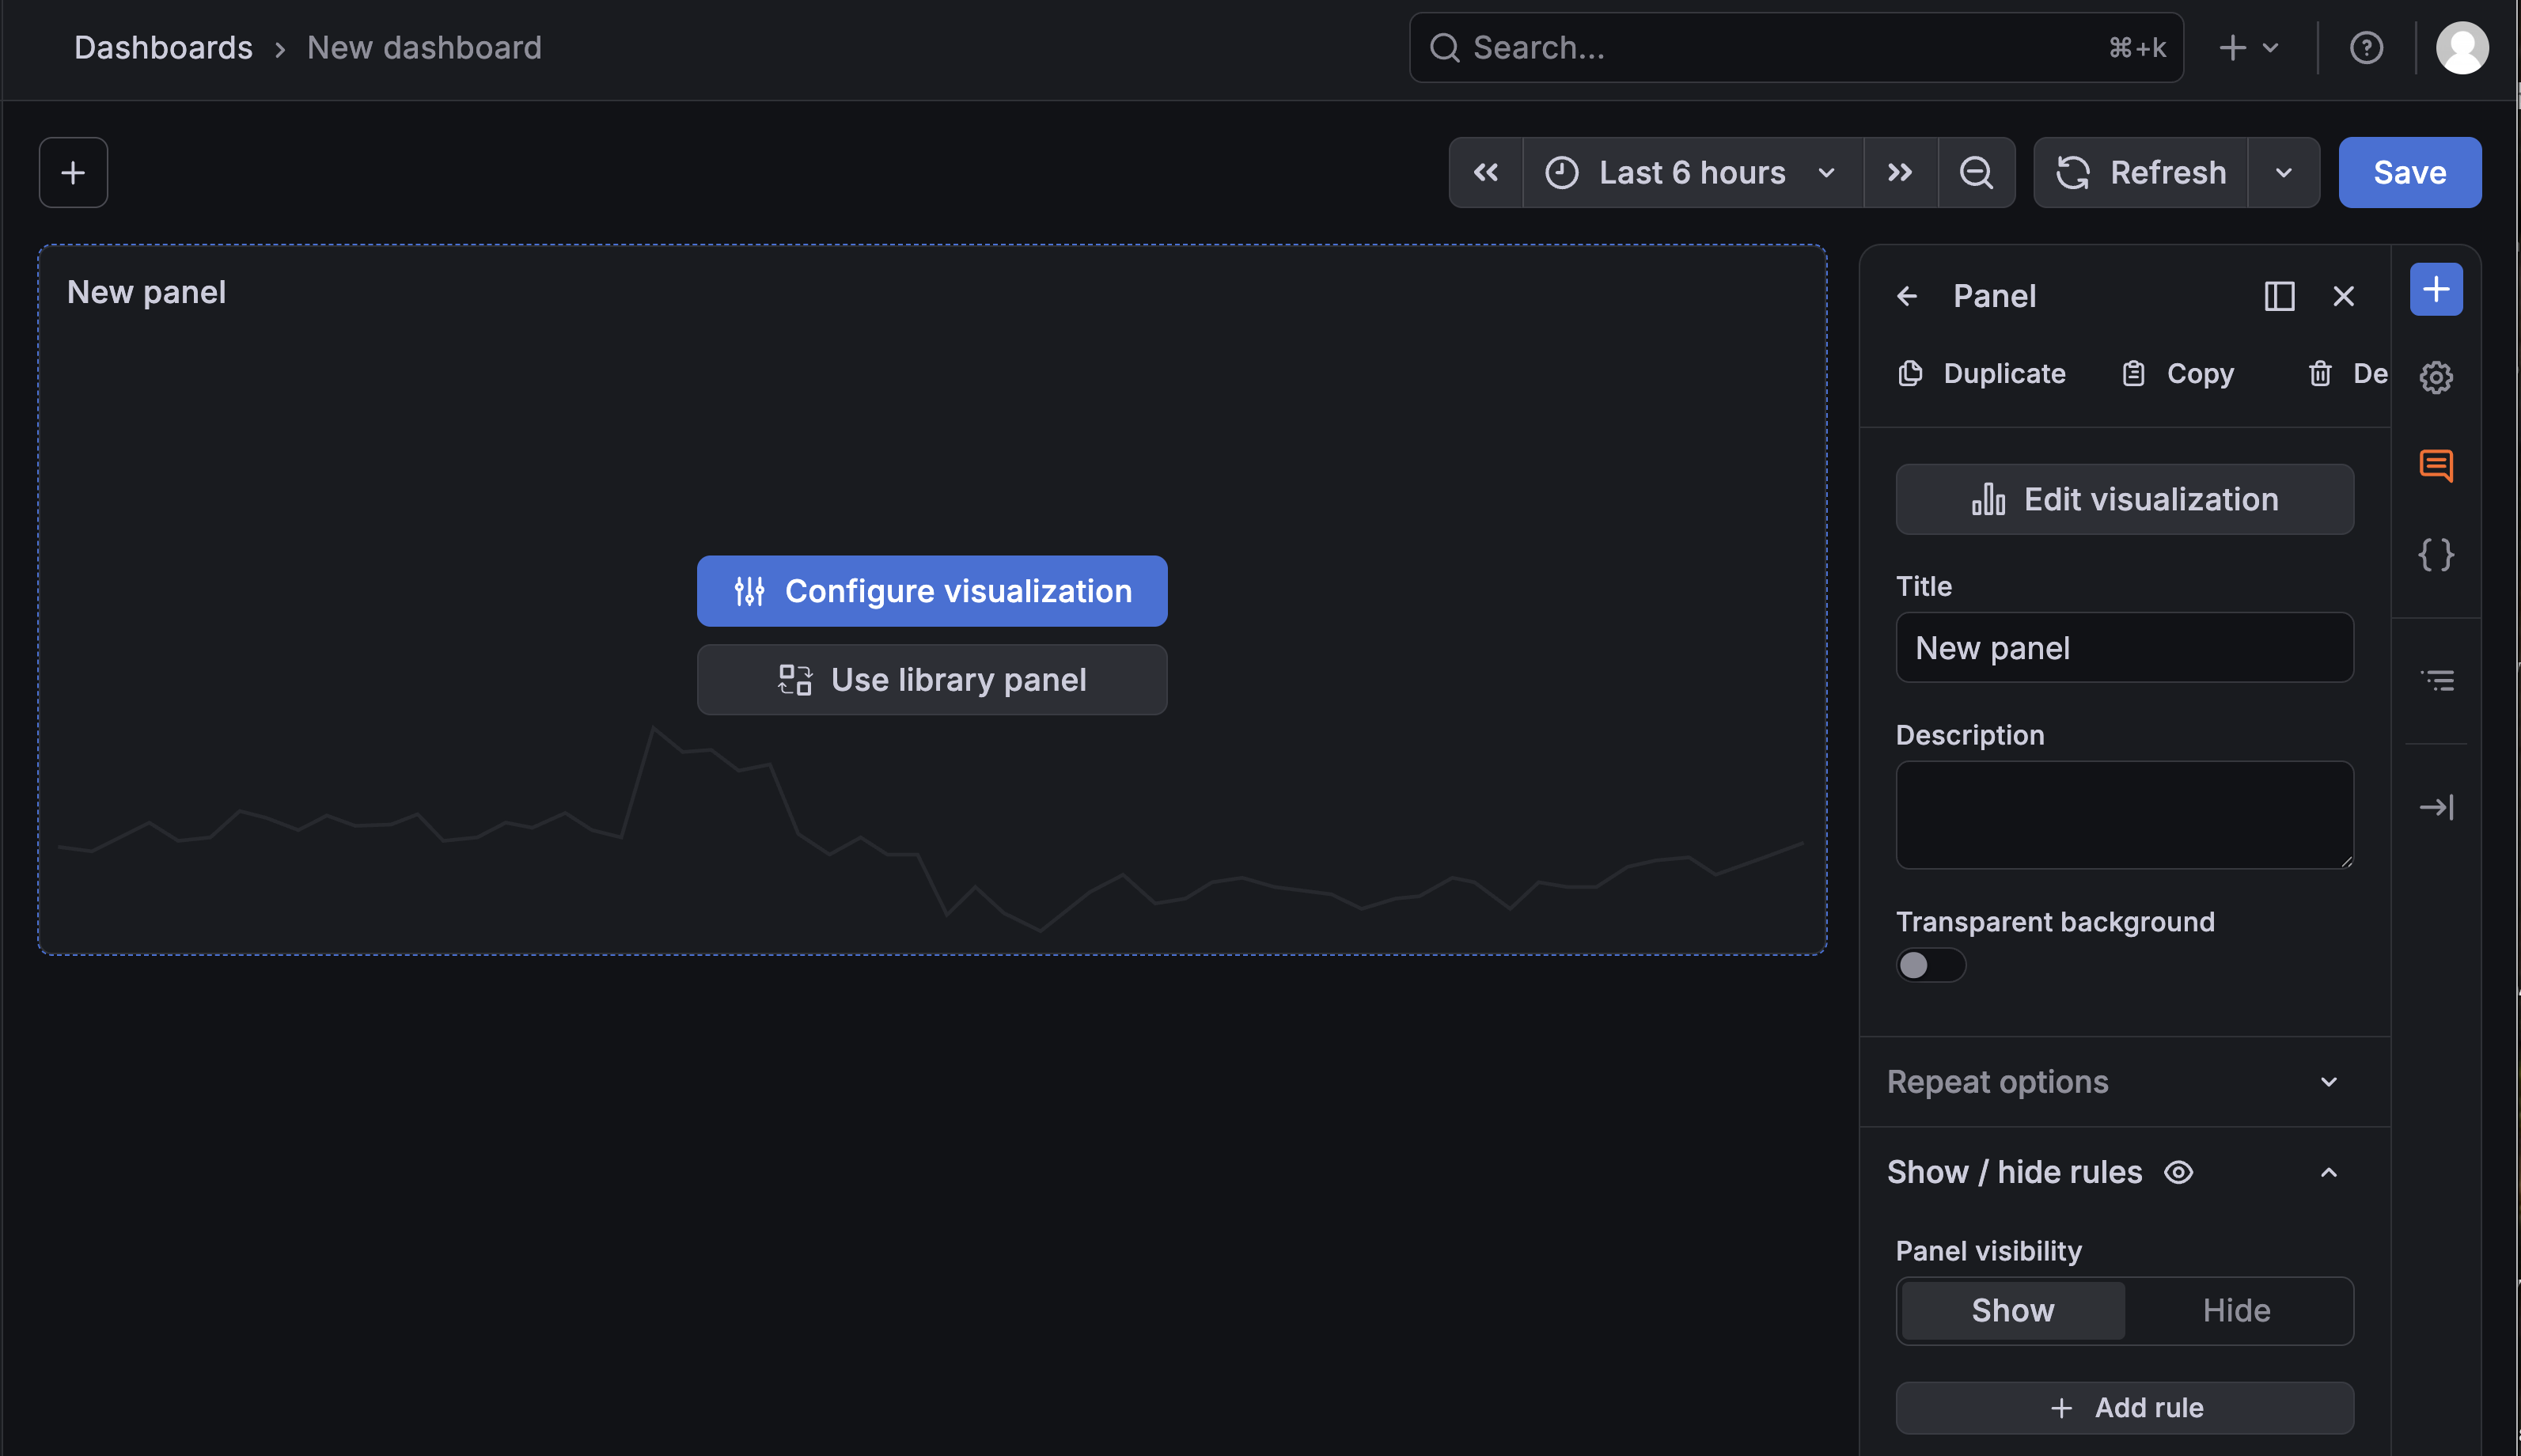
A new panel shows a blue "Configure visualization" button in the middle - click it to open the panel editor.
The data source should already be Prometheus (the stack wired it in as the default). In the Query section below the graph, switch the query mode from Builder to Code - notice how the UI changes to a free-text field reading Enter a PromQL query. Type:
kube_pod_container_status_restarts_total{namespace="demo"}
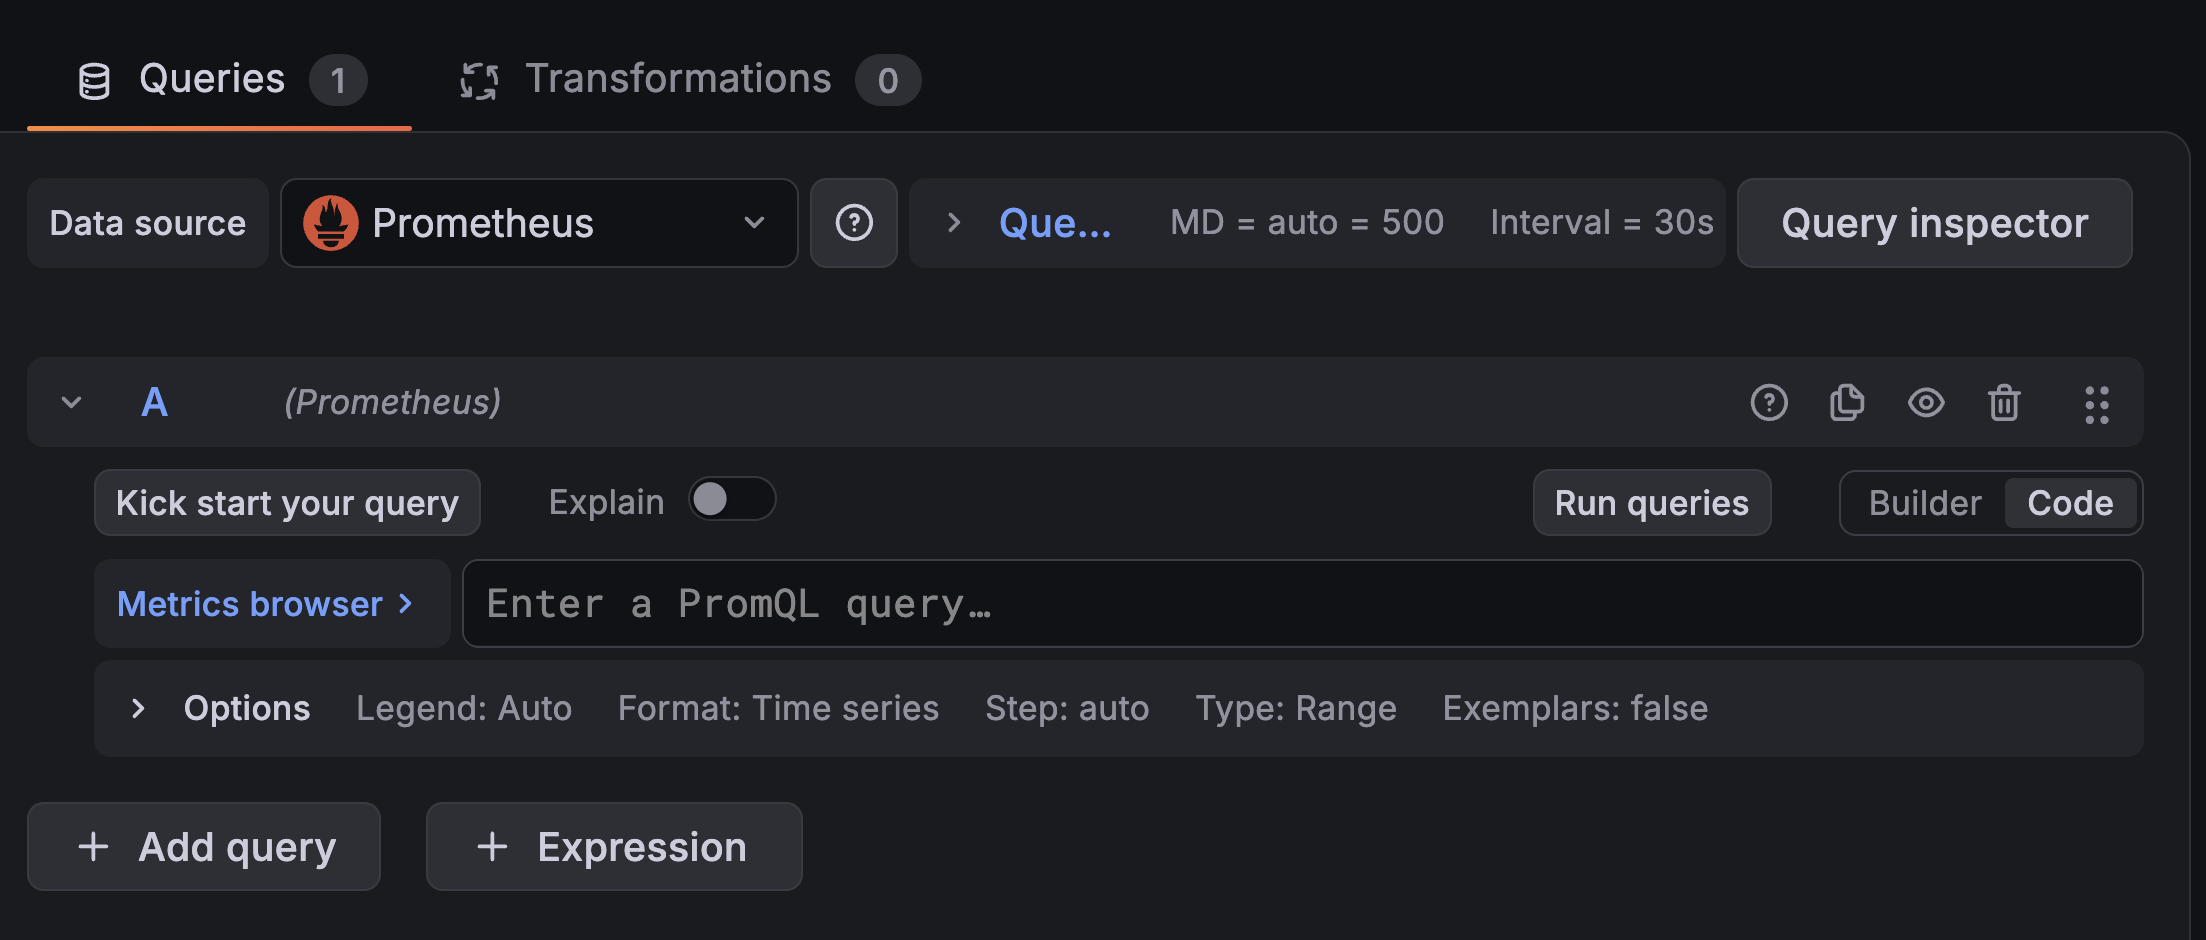
Switch the Query section from Builder to Code to type raw PromQL in the "Enter a PromQL query" field.
Reading that query - a first taste of PromQL
That line is PromQL, Prometheus's query language. It has two parts: the metric name kube_pod_container_status_restarts_total (the series you want), and a label filter in braces {namespace="demo"} (narrowing it to the demo namespace). PromQL goes far beyond this - rates, aggregations, and math across series - but selecting a metric and filtering by label, as here, is the everyday case you will reach for most. The official Querying basics guide is the place to go deeper. (External link; content was rephrased for compliance with licensing restrictions.)
Give the panel a title like "Crasher restarts", then Save the dashboard with any name you like (for example, "My Cluster Health"). The panel immediately shows the crasher's climbing restart count - the same metric your alert rule watches, now visualized.
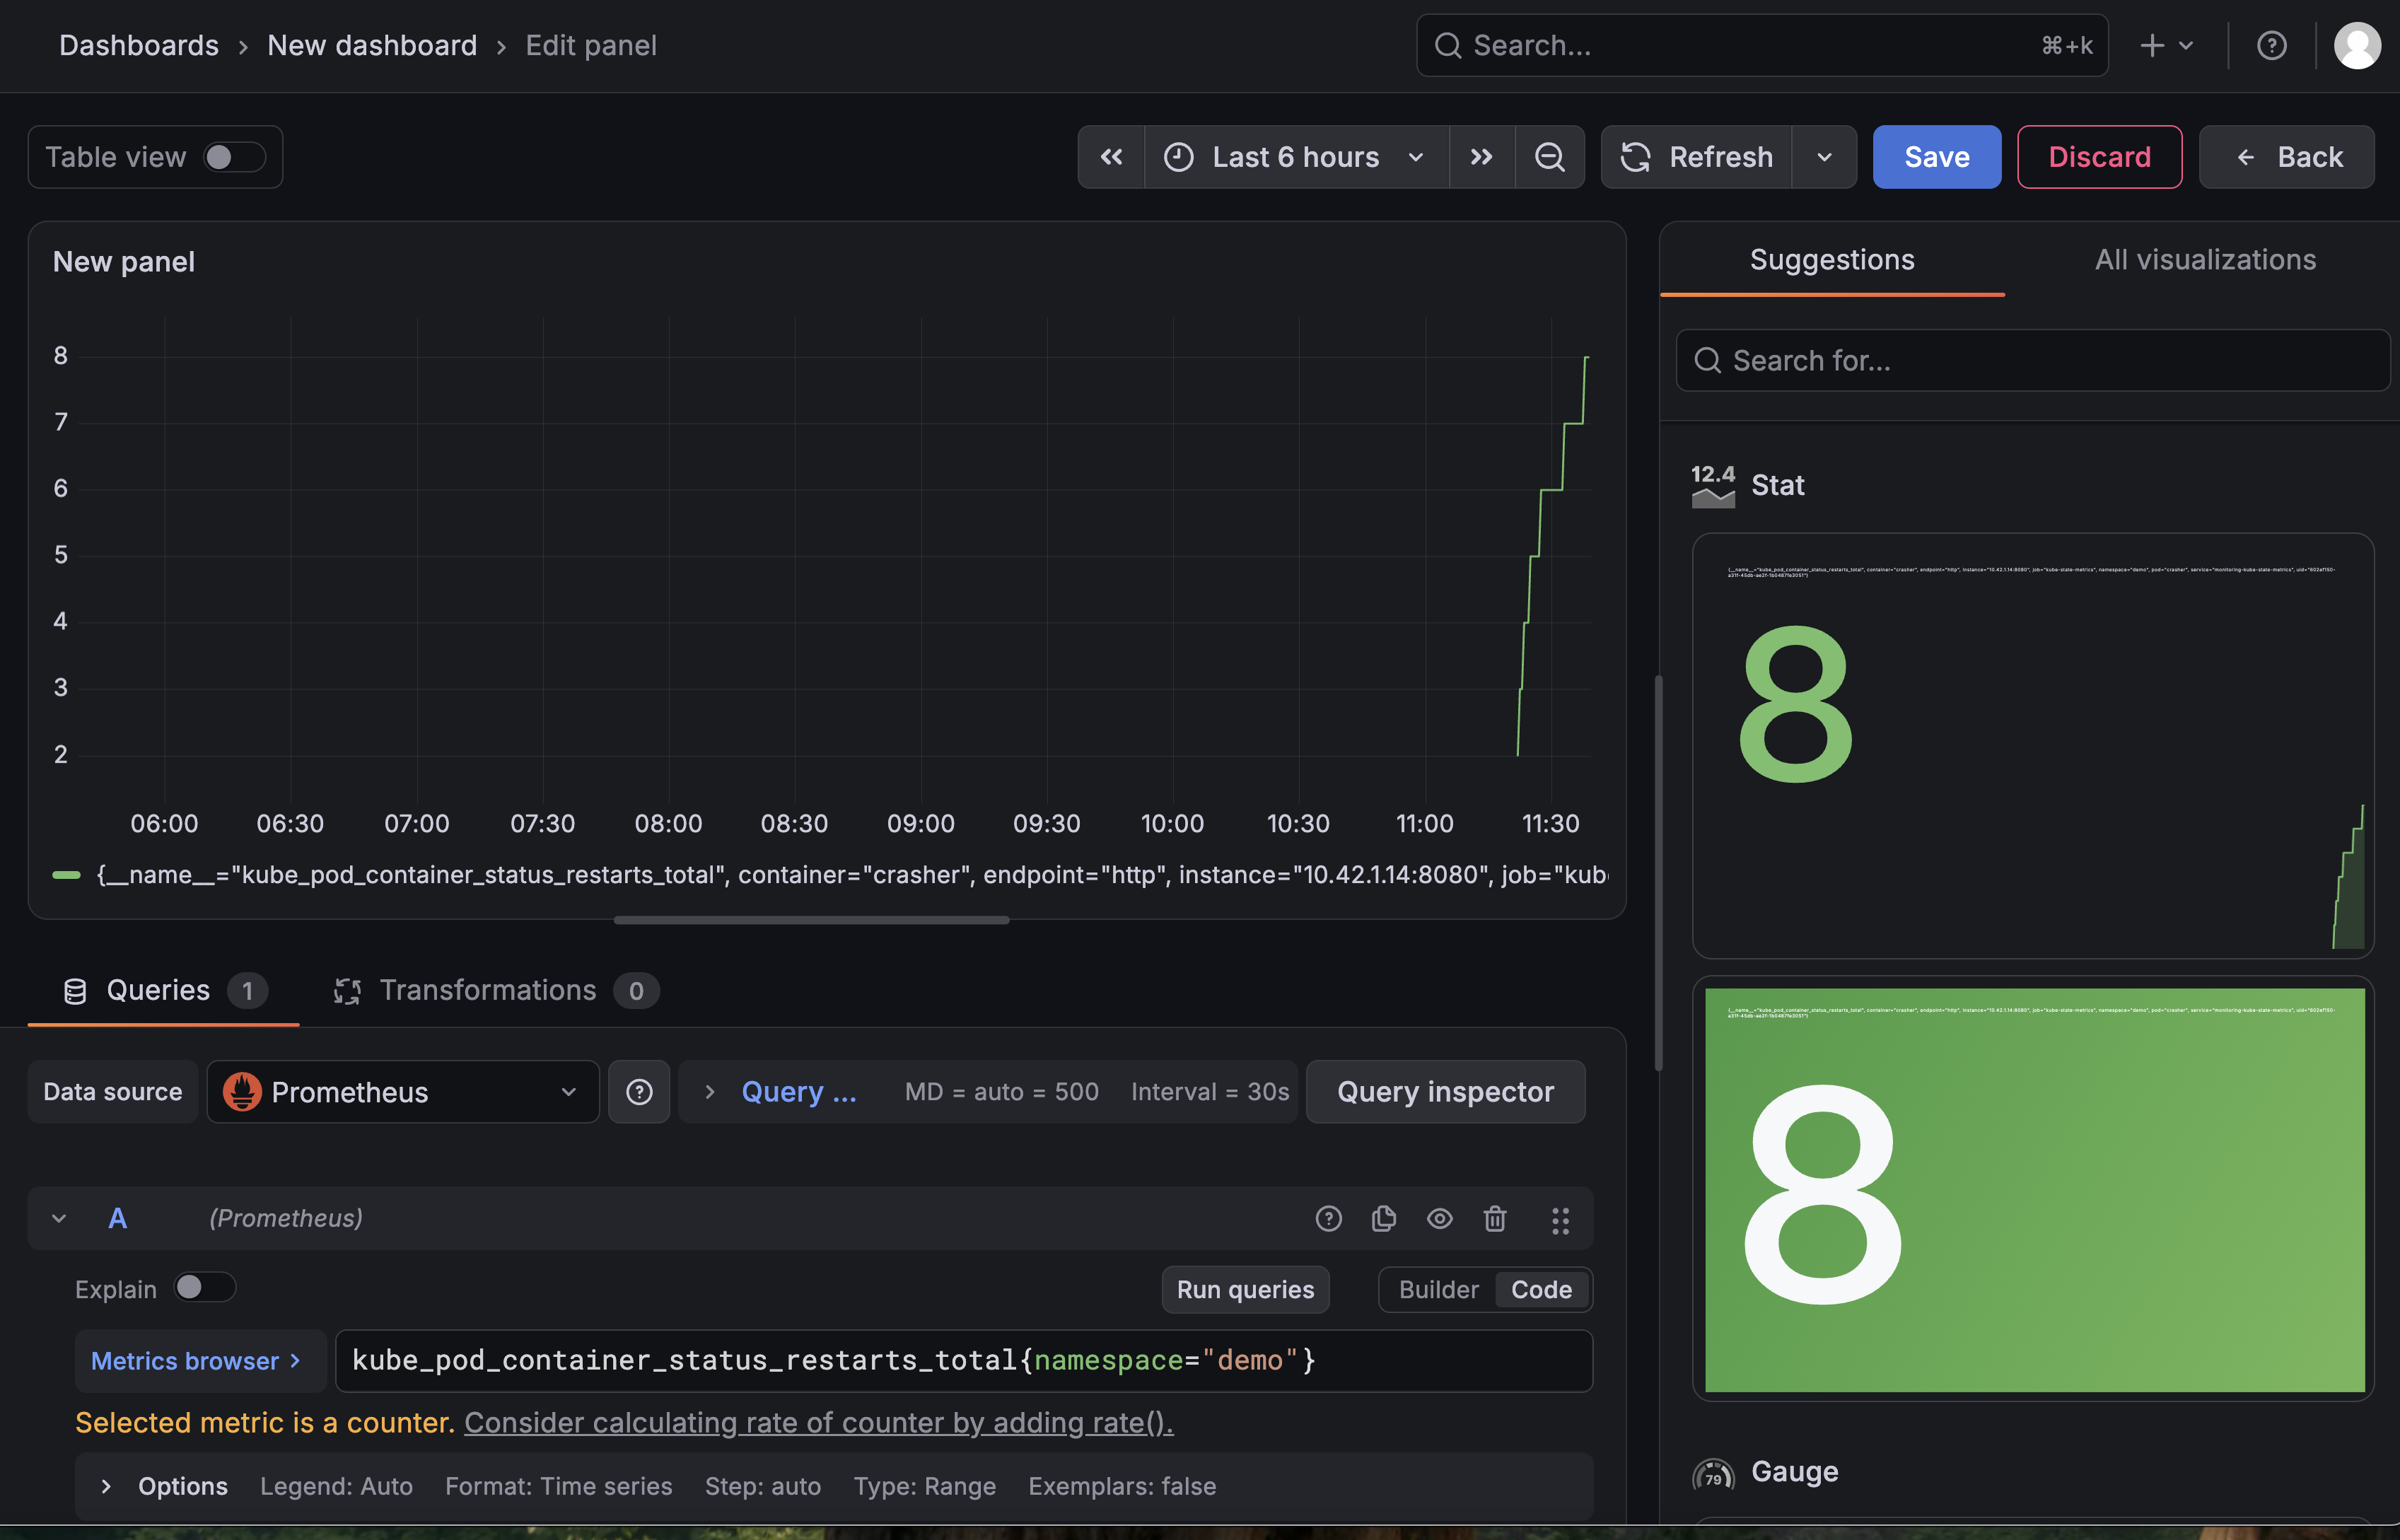
The finished panel graphing the crasher's restart count - built from a single PromQL query.
Where the pieces are in the Grafana UI
The New dashboard button is under Dashboards in the left navigation (the four-squares icon). Add a panel with + Add new element > Panel, then click the blue Configure visualization button in the middle of the panel. With the Prometheus data source selected, the Query section defaults to Builder mode - switch it to Code to type raw PromQL. Paste kube_pod_container_status_restarts_total{namespace="demo"}, then use the Save (disk) icon at the top right. The panel does not need a specific title, but the query must use that metric so the dashboard is recognizably yours.
You're Done
You installed the Prometheus and Grafana stack that underpins Rancher Monitoring, browsed the built-in dashboards, caused a real failure, watched your own alert catch it and fire, and built a dashboard panel from a raw metric. That is the core observability loop: collect metrics, visualize them, and alert on the conditions that matter. On a production cluster you would enable Rancher's Monitoring app for the same stack with UI integration, but the objects you worked with here - Prometheus, Grafana, and PrometheusRule - are identical.
This lesson covered the metrics pillar of observability. Logs and traces are the other two; the next lesson adds the logs pillar by installing Grafana Loki and the Alloy log shipper, then querying your cluster's logs in this same Grafana.
The challenge below has you stand up the stack, break a pod, and prove your alert fires. Solving it records your progress.
- Previous lesson
- CI/CD with Rancher Fleet and a Git Server
- Next lesson
- Logging with Loki and Grafana Alloy