The previous lesson covered the metrics pillar of observability with Prometheus and Grafana. Metrics tell you that something is wrong - a pod is restarting, latency is climbing. Logs tell you why. This lesson adds the logs pillar: you install Grafana Loki to store and search logs, and Grafana Alloy to collect them from every node and ship them to Loki. Then you query those logs in the same Grafana you already use for metrics, so one place answers both "what is happening" and "why".
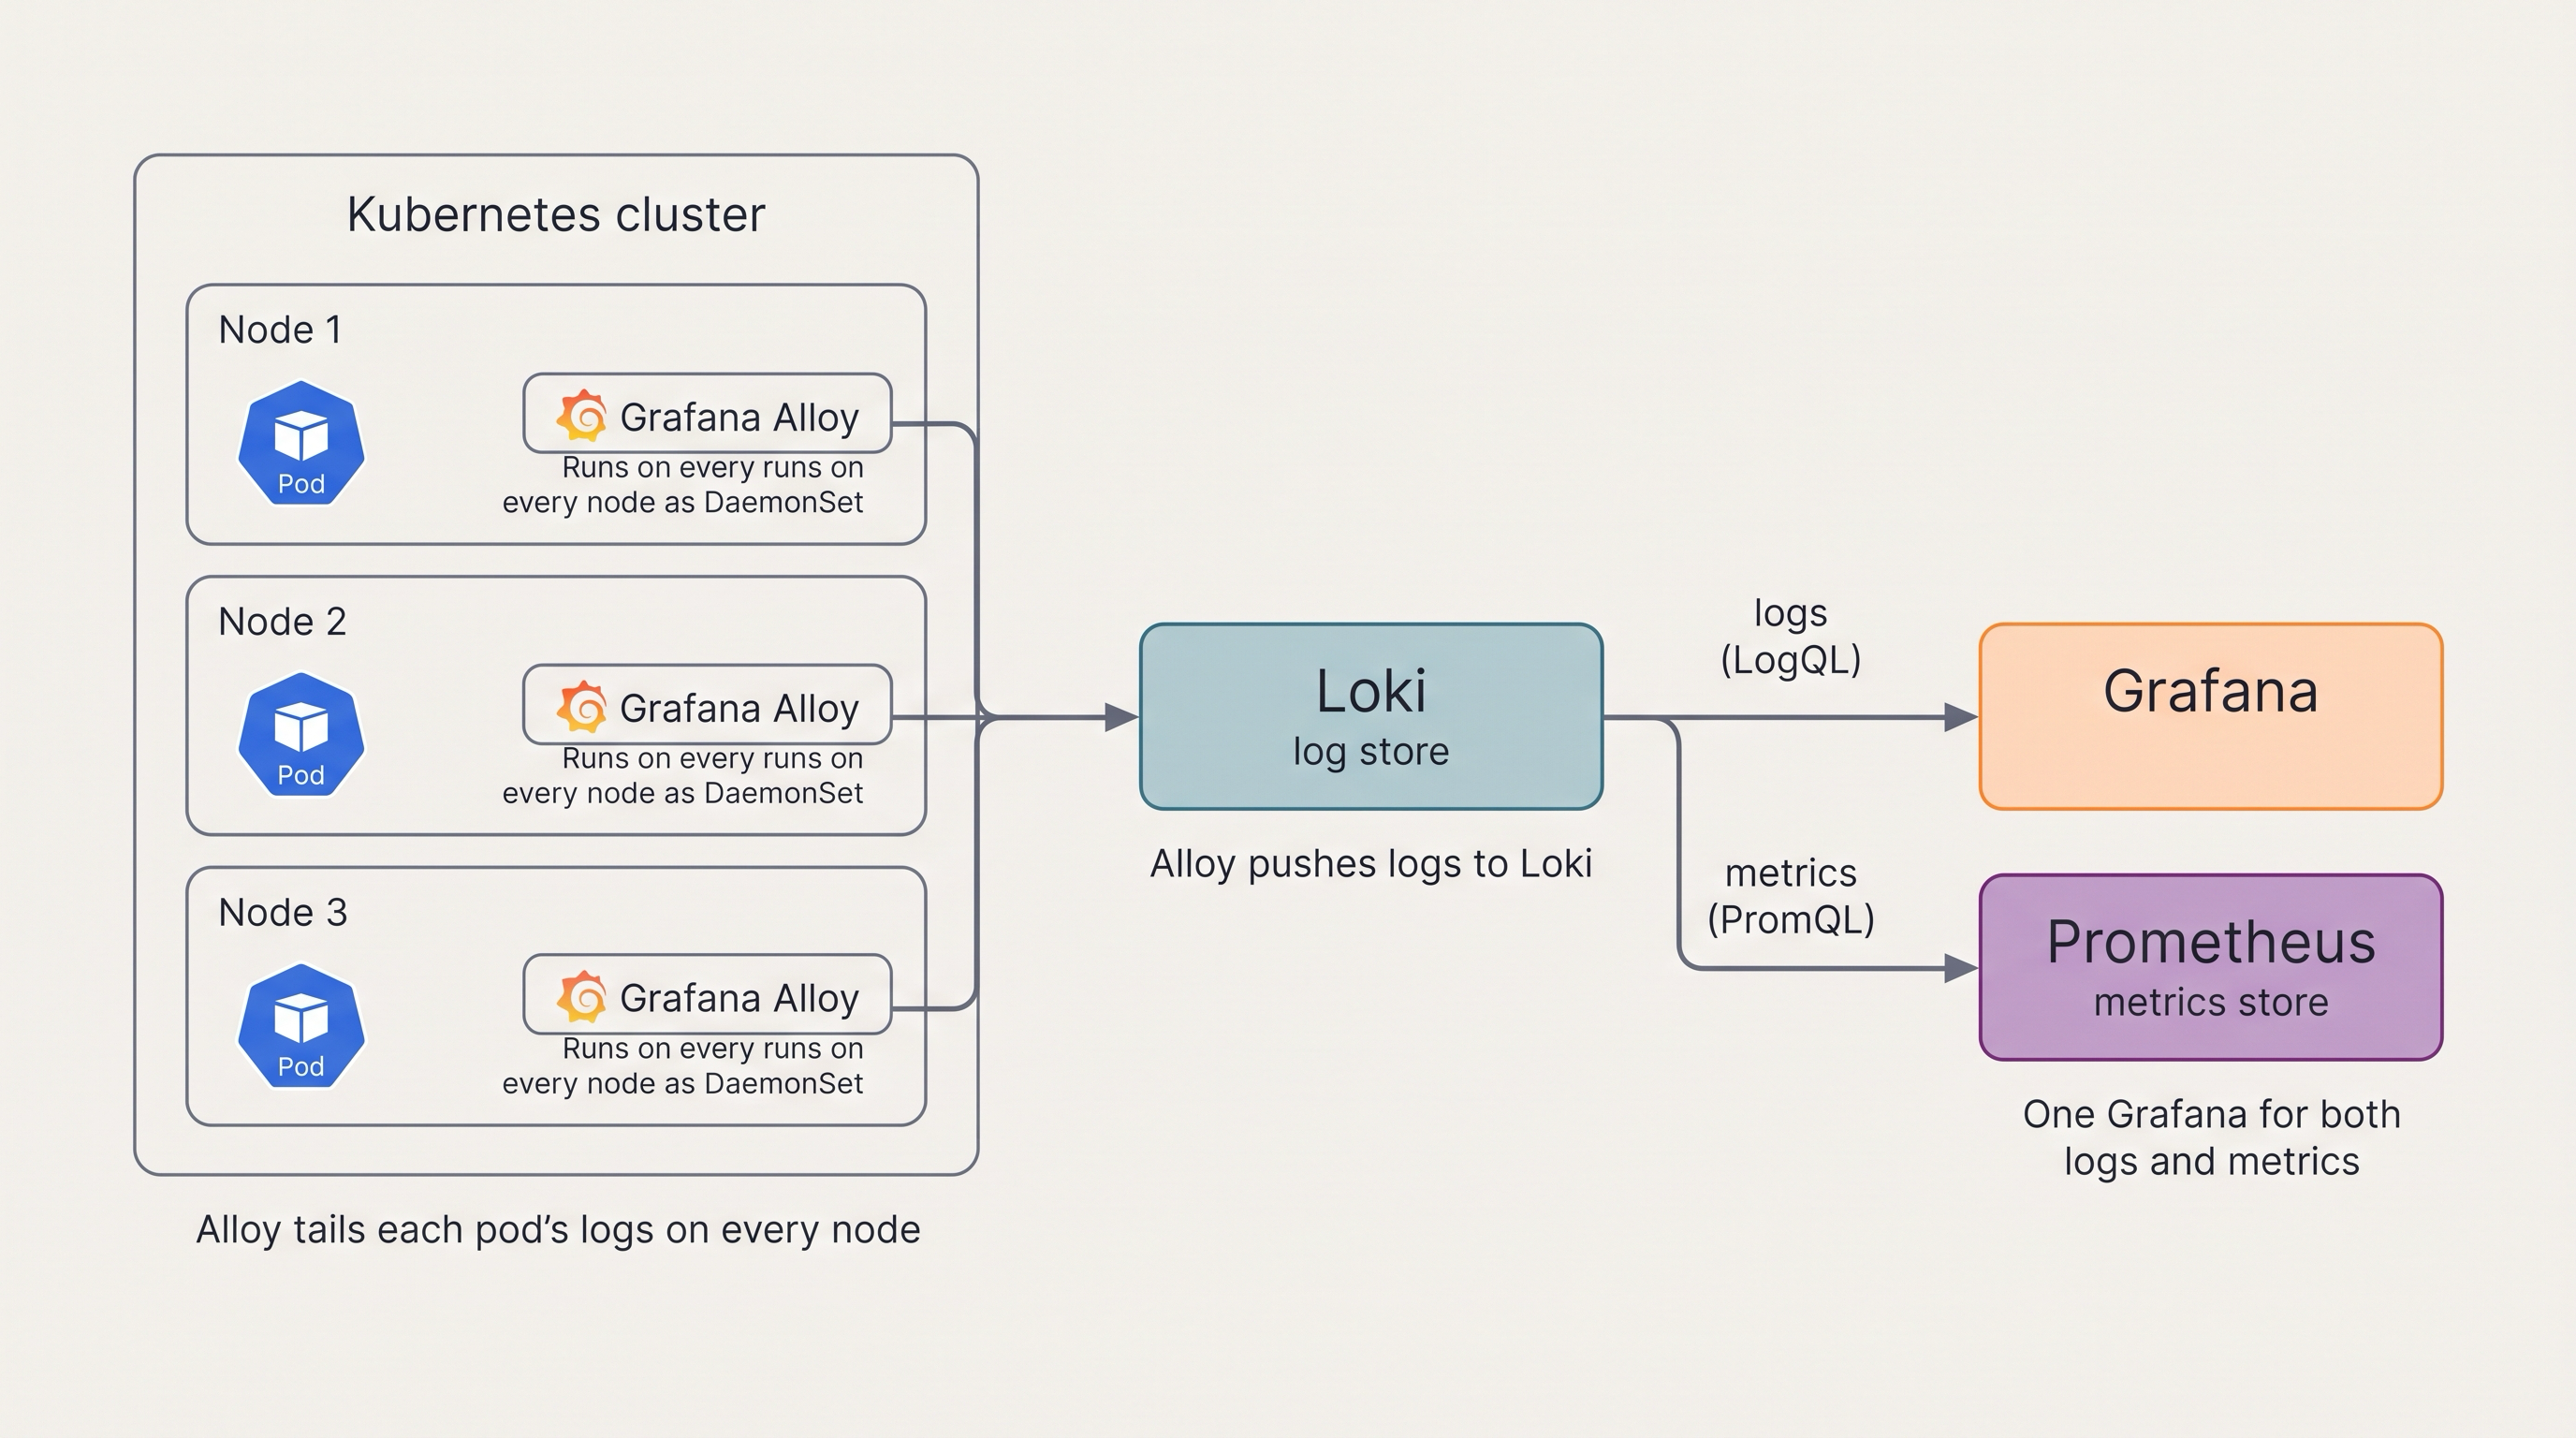
Alloy collects logs on every node and ships them to Loki; the Grafana you already run queries both Loki (logs) and Prometheus (metrics).
Rancher Logging and What It Packages
Just as Rancher offers a one-click Monitoring app for metrics, it offers a Logging app (under Cluster Tools) for logs. That app packages a log collector and wires it to a store like Loki. As in the monitoring lesson, here you install the pieces directly with Helm so you can see exactly what a logging stack is made of and where each part lives. Everything you learn maps back to what Rancher's Logging app sets up for you.
The design goal is deliberate: you already installed Grafana for metrics in the previous lesson, so you will reuse it rather than stand up a second one. That mirrors production, where a single Grafana sits over both Prometheus (metrics) and Loki (logs).
New to this? What is Loki?
Loki is a log aggregation system - think "Prometheus, but for logs". It collects log lines from across the cluster and lets you search them with a query language called LogQL, which is deliberately close to PromQL so the two feel consistent. Its defining design choice is that it does not index the contents of your logs. It indexes only a small set of labels (namespace, pod, container) and stores the raw log text compressed. That makes it far lighter on CPU, memory, and storage than a full-text search engine, and it is why Loki pairs so naturally with Prometheus - the same labels tie a pod's metrics and its logs together.
Loki is actively developed and maintained by Grafana Labs (it is not deprecated), and it is the store Rancher's Logging app is built around.
Alternatives to Loki:
- Elasticsearch / OpenSearch (the ELK or EFK stack) - full-text indexing of every field. Very powerful search, but heavy on resources. Often more than a small or mid-size cluster needs.
- Cloud-managed logging - AWS CloudWatch Logs, Google Cloud Logging, Datadog, Splunk. Nothing to run yourself, but paid and off-cluster.
- Loki - lightweight, label-based, and it reuses the Grafana you already run for metrics. That is why we use it here.
New to this? What is Grafana Alloy?
Loki stores logs, but something has to collect them from every node and ship them to Loki. That collector is Grafana Alloy. It runs as a DaemonSet - one agent per node - tails each container's log files, attaches labels (which namespace, pod, and container the line came from), and pushes the lines to Loki. Alloy is a general-purpose telemetry collector built on OpenTelemetry; it can handle metrics and traces too, but here we use it only for logs.
If you have followed Loki tutorials before, you likely saw Promtail as the shipper. Promtail reached end-of-life in March 2026 and its code was merged into Alloy, so Alloy is now the current, supported way to ship logs to Loki. That is why this lesson uses Alloy.
Alternatives to Alloy (log collectors):
- Fluent Bit - a very lightweight collector, extremely common in Kubernetes and historically the shipper Rancher's Logging app used.
- Fluentd - Fluent Bit's older, heavier sibling, with more plugins.
- Vector - a fast, modern collector that is gaining adoption.
- OpenTelemetry Collector - the vendor-neutral standard that Alloy itself is built on.
- Promtail - the former Loki default, now end-of-life; listed so you recognize it in older docs, not something to start with today.
Step 1: Install Loki
You install everything from the dev-machine workstation, the same way you installed the monitoring stack. Add the Grafana community Helm repository (the Loki chart moved there in 2026), then install Loki in a small, lab-friendly shape.
Add the repositories:
helm repo add grafana-community https://grafana-community.github.io/helm-charts
helm repo add grafana https://grafana.github.io/helm-charts
helm repo update
Loki's chart can deploy a large, production-scale topology, so you trim it to a single binary with local filesystem storage - enough to see the whole pipeline work on one lab node. Create the values file and install:
cat > loki-values.yaml <<'EOF'
deploymentMode: SingleBinary
loki:
  commonConfig:
    replication_factor: 1
  storage:
    type: filesystem
  useTestSchema: true
  limits_config:
    retention_period: 24h
    allow_structured_metadata: true
    volume_enabled: true
  auth_enabled: false
singleBinary:
  replicas: 1
  resources:
    requests:
      cpu: 100m
      memory: 128Mi
  persistence:
    enabled: false
backend: {replicas: 0}
read: {replicas: 0}
write: {replicas: 0}
ingester: {replicas: 0}
querier: {replicas: 0}
queryFrontend: {replicas: 0}
queryScheduler: {replicas: 0}
distributor: {replicas: 0}
compactor: {replicas: 0}
indexGateway: {replicas: 0}
bloomPlanner: {replicas: 0}
bloomBuilder: {replicas: 0}
bloomGateway: {replicas: 0}
gateway:
  enabled: false
lokiCanary:
  enabled: false
monitoring:
  selfMonitoring:
    enabled: false
    grafanaAgent:
      installOperator: false
chunksCache:
  enabled: false
resultsCache:
  enabled: false
minio:
  enabled: false
test:
  enabled: false
EOF

helm install loki grafana-community/loki \
  --namespace loki --create-namespace \
  -f loki-values.yaml
Watch it come up - a single loki-0 pod and a loki service on port 3100:
kubectl -n loki rollout status statefulset/loki --timeout=300s
kubectl -n loki get pods
Why "single binary" and filesystem storage, and what would production use?
Loki can run as a set of separately scalable microservices (distributor, ingester, querier, compactor, and more), backed by object storage like S3. That is the right shape for high log volume, but it is far more than a lab node already running Rancher and the monitoring stack can host.
So here you set deploymentMode: SingleBinary (one process handling reads and writes) with storage.type: filesystem and every other component and cache disabled. The useTestSchema: true value lets the chart generate a valid schema for you so you do not have to hand-write one. This is perfect for learning and small clusters, but for production you would use object storage (S3, GCS, or Azure Blob), a real schema configuration, and persistent volumes - and likely more than one replica. The objects you interact with are the same; only the scale and durability change.
Step 2: Install Grafana Alloy to Ship Logs
Loki is ready to receive logs, but nothing is sending any yet. Install Alloy as a DaemonSet so one agent runs on every node, discovers pods, tails their logs, and pushes them to Loki.
Alloy is configured with its own component-based config. This configuration discovers every pod, labels each log stream with its namespace, pod, container, and node, and writes to the Loki service:
cat > alloy-values.yaml <<'EOF'
alloy:
  configMap:
    content: |-
      discovery.kubernetes "pods" {
        role = "pod"
      }

      discovery.relabel "pod_logs" {
        targets = discovery.kubernetes.pods.targets

        rule {
          source_labels = ["__meta_kubernetes_namespace"]
          target_label  = "namespace"
        }
        rule {
          source_labels = ["__meta_kubernetes_pod_name"]
          target_label  = "pod"
        }
        rule {
          source_labels = ["__meta_kubernetes_pod_container_name"]
          target_label  = "container"
        }
        rule {
          source_labels = ["__meta_kubernetes_node_name"]
          target_label  = "node"
        }
      }

      loki.source.kubernetes "pods" {
        targets    = discovery.relabel.pod_logs.output
        forward_to = [loki.write.default.receiver]
      }

      loki.write "default" {
        endpoint {
          url = "http://loki.loki.svc.cluster.local:3100/loki/api/v1/push"
        }
      }
  resources:
    requests:
      cpu: 50m
      memory: 64Mi
controller:
  type: daemonset
EOF

helm install alloy grafana/alloy \
  --namespace alloy --create-namespace \
  -f alloy-values.yaml
Confirm one Alloy pod is running per node:
kubectl -n alloy rollout status daemonset/alloy --timeout=300s
kubectl -n alloy get pods -o wide
What does that Alloy config actually do?
Alloy's configuration is a small pipeline of components, each feeding the next:
discovery.kubernetesfinds all pods in the cluster (the same idea as how Prometheus discovers scrape targets).discovery.relabelcopies useful Kubernetes metadata onto each log stream as labels -namespace,pod,container,node- which are exactly the labels you will filter on in LogQL.loki.source.kubernetestails the container log files for those discovered pods.loki.writepushes the collected lines to the Loki service at its push endpoint.
Because Alloy is a DaemonSet, this pipeline runs on every node, so logs from pods anywhere in the cluster reach Loki.
Step 3: Add Loki as a Data Source in Grafana
You will not open a new tool for logs. Instead you add Loki to the Grafana you installed in the previous lesson, so metrics and logs live side by side.
Open the Grafana tab and log in as admin. If you need the password again, print it from the dev-machine terminal:
kubectl -n monitoring get secret monitoring-grafana \
  -o jsonpath='{.data.admin-password}' | base64 -d; echo
In Grafana, go to Connections > Data sources. You will see the data sources the monitoring stack already configured, including Prometheus. Click Add data source and choose Loki.
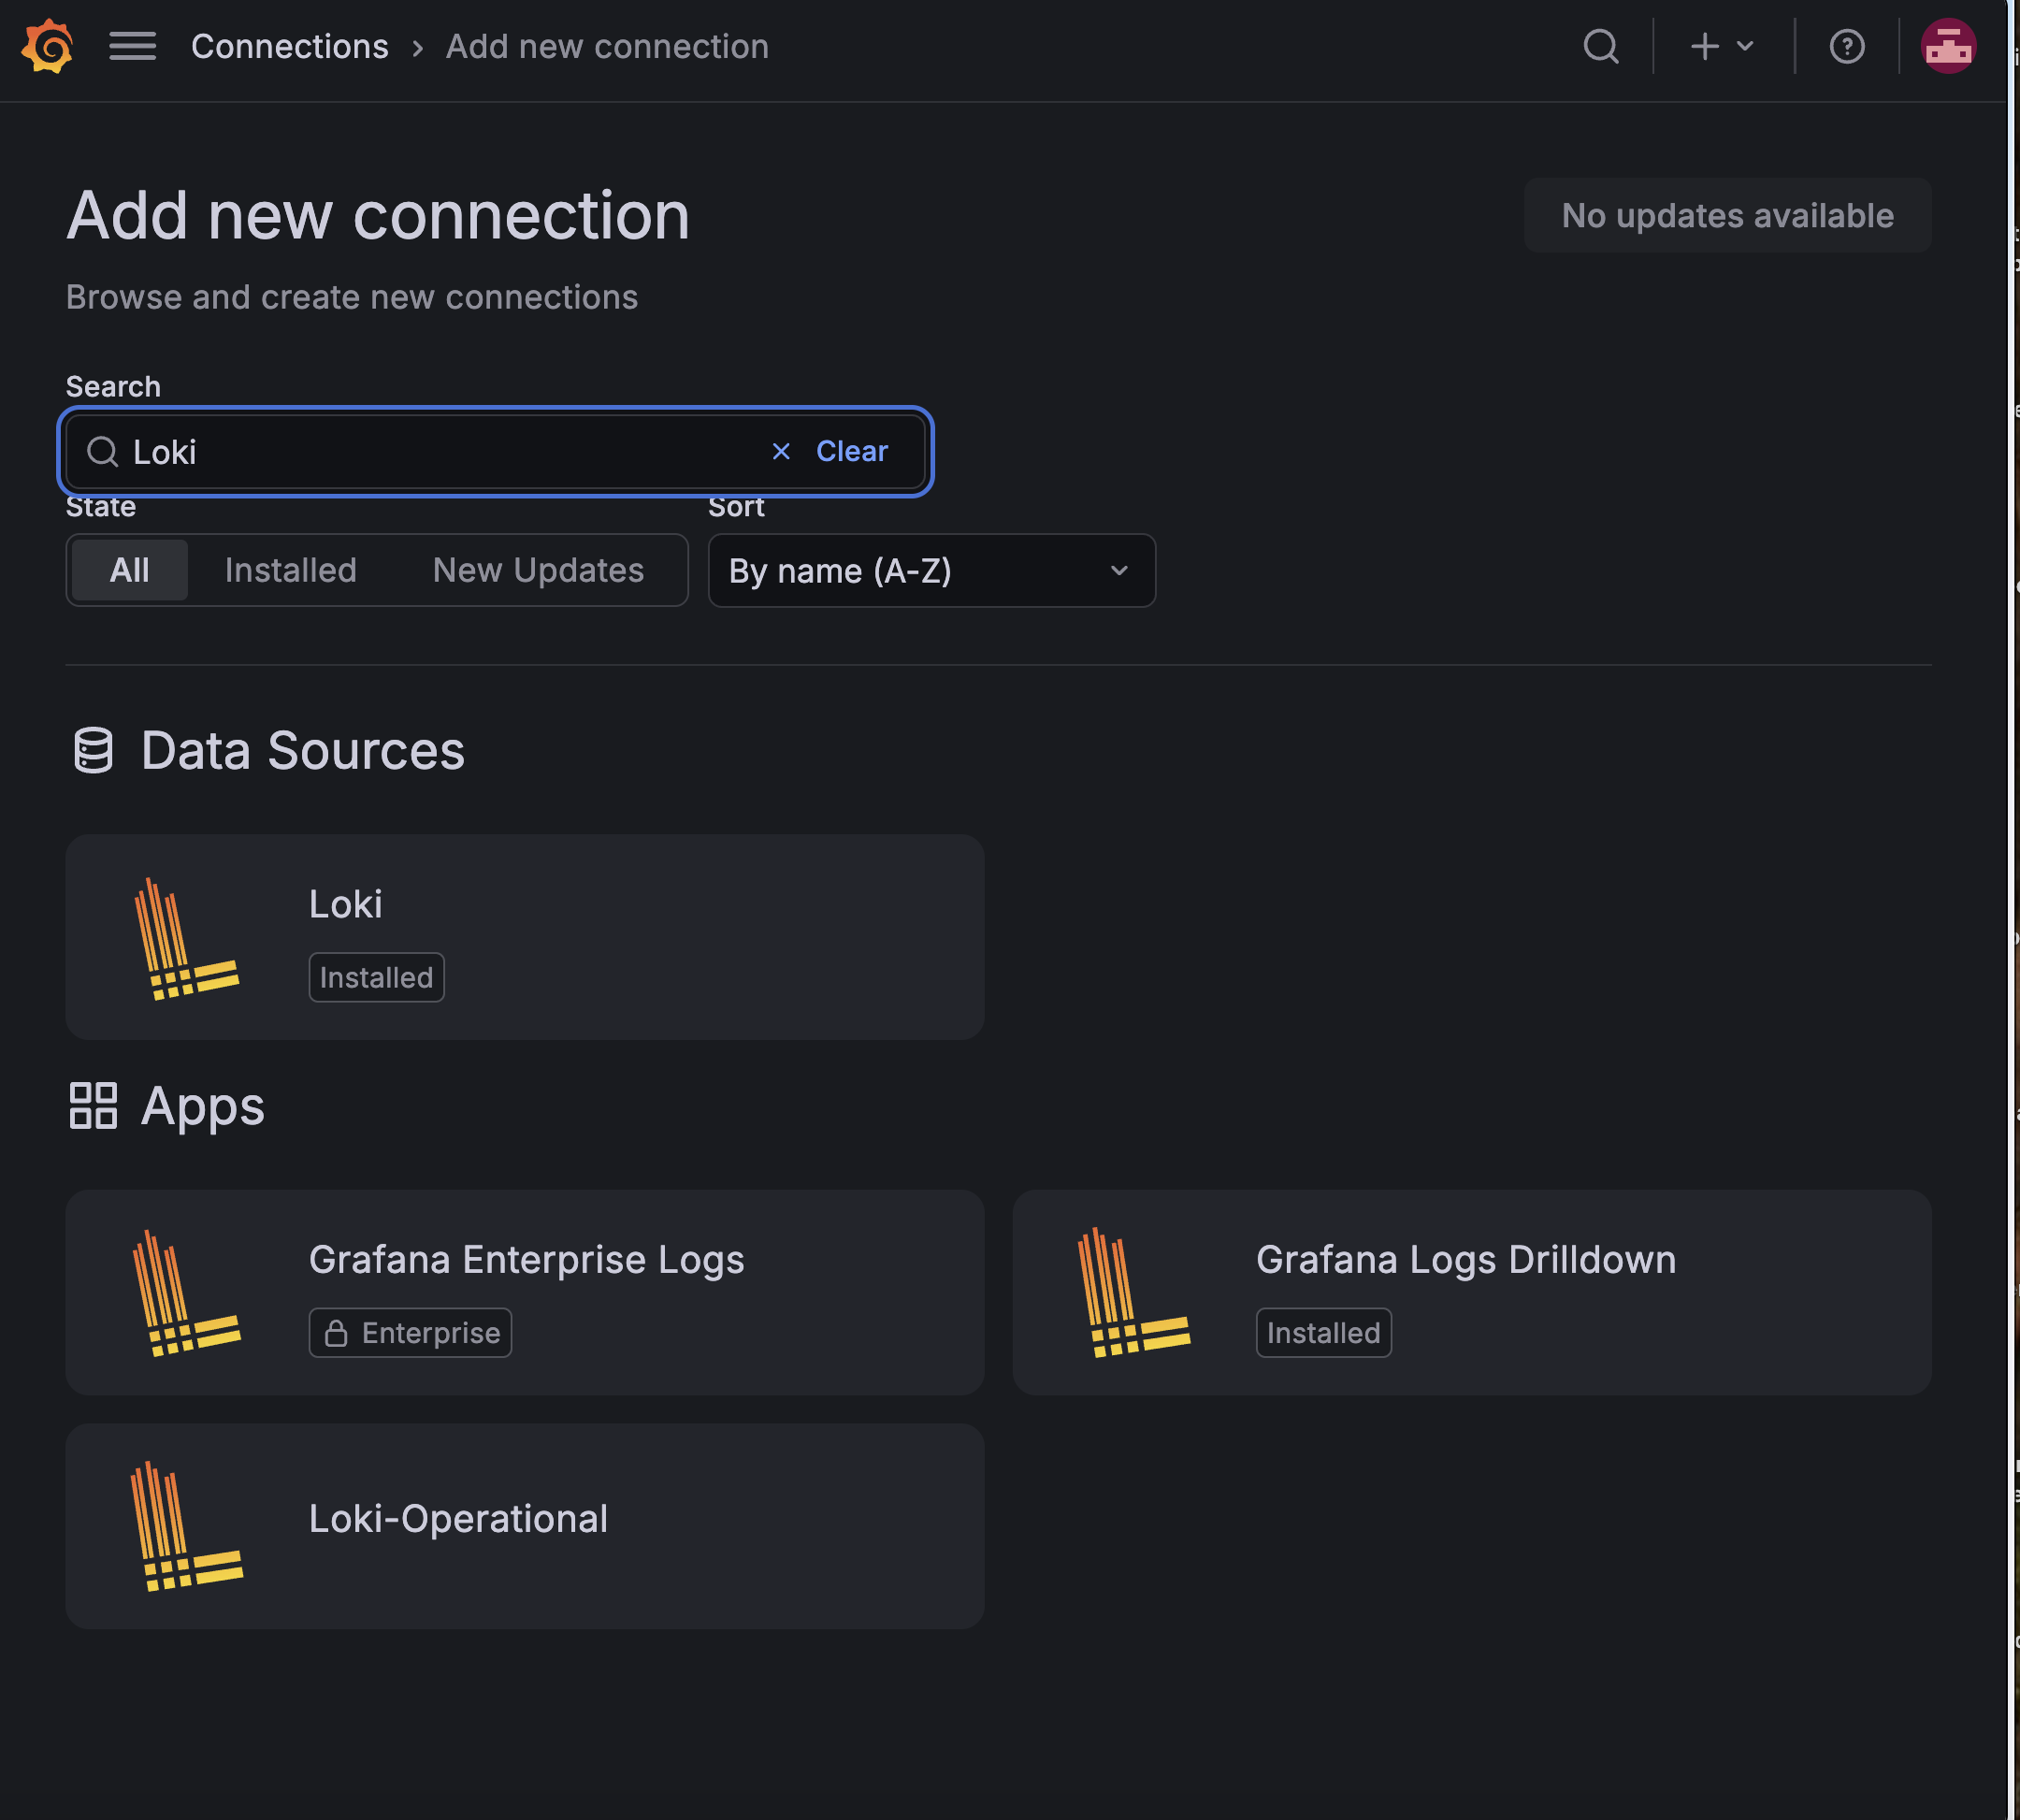
Grafana's Data sources view - Prometheus is already here from the monitoring lesson; you add Loki alongside it.
Set the URL to the in-cluster Loki service:
http://loki.loki.svc.cluster.local:3100
Just below the URL, Grafana shows an Authentication section. Leave it on No Authentication. The Loki you installed runs with auth_enabled: false, and it is reached over the cluster's internal network, so no credentials are needed here.
What are the other authentication options for?
Grafana offers several ways to authenticate to a data source, and which one you use depends on how the data source is exposed and secured - not on Grafana itself:
- No Authentication - Grafana connects with no credentials. Correct here: this Loki has authentication disabled and is only reachable inside the cluster, which is the common setup for a lab or for a Loki that sits behind an internal, trusted network.
- Basic authentication - a username and password sent with each request. You would use this if Loki (or a proxy in front of it) were configured to require basic-auth credentials, for example a Loki exposed outside the cluster.
- Forward OAuth Identity / OAuth2 - Grafana forwards the logged-in user's OAuth token, or authenticates with an OAuth2 client. This fits managed or multi-tenant setups (such as Grafana Cloud Logs or a Loki gateway that enforces per-user access) where each request must carry an identity.
- TLS options (client certificate, skip TLS verify, CA cert) - used when Loki is served over HTTPS and you need to present a client certificate or trust a custom CA.
In production you would typically put Loki behind a gateway or ingress that enforces one of these. Because this lab keeps Loki internal and unauthenticated, No Authentication is both correct and the simplest.
Click Save & test. Grafana confirms it can reach Loki.
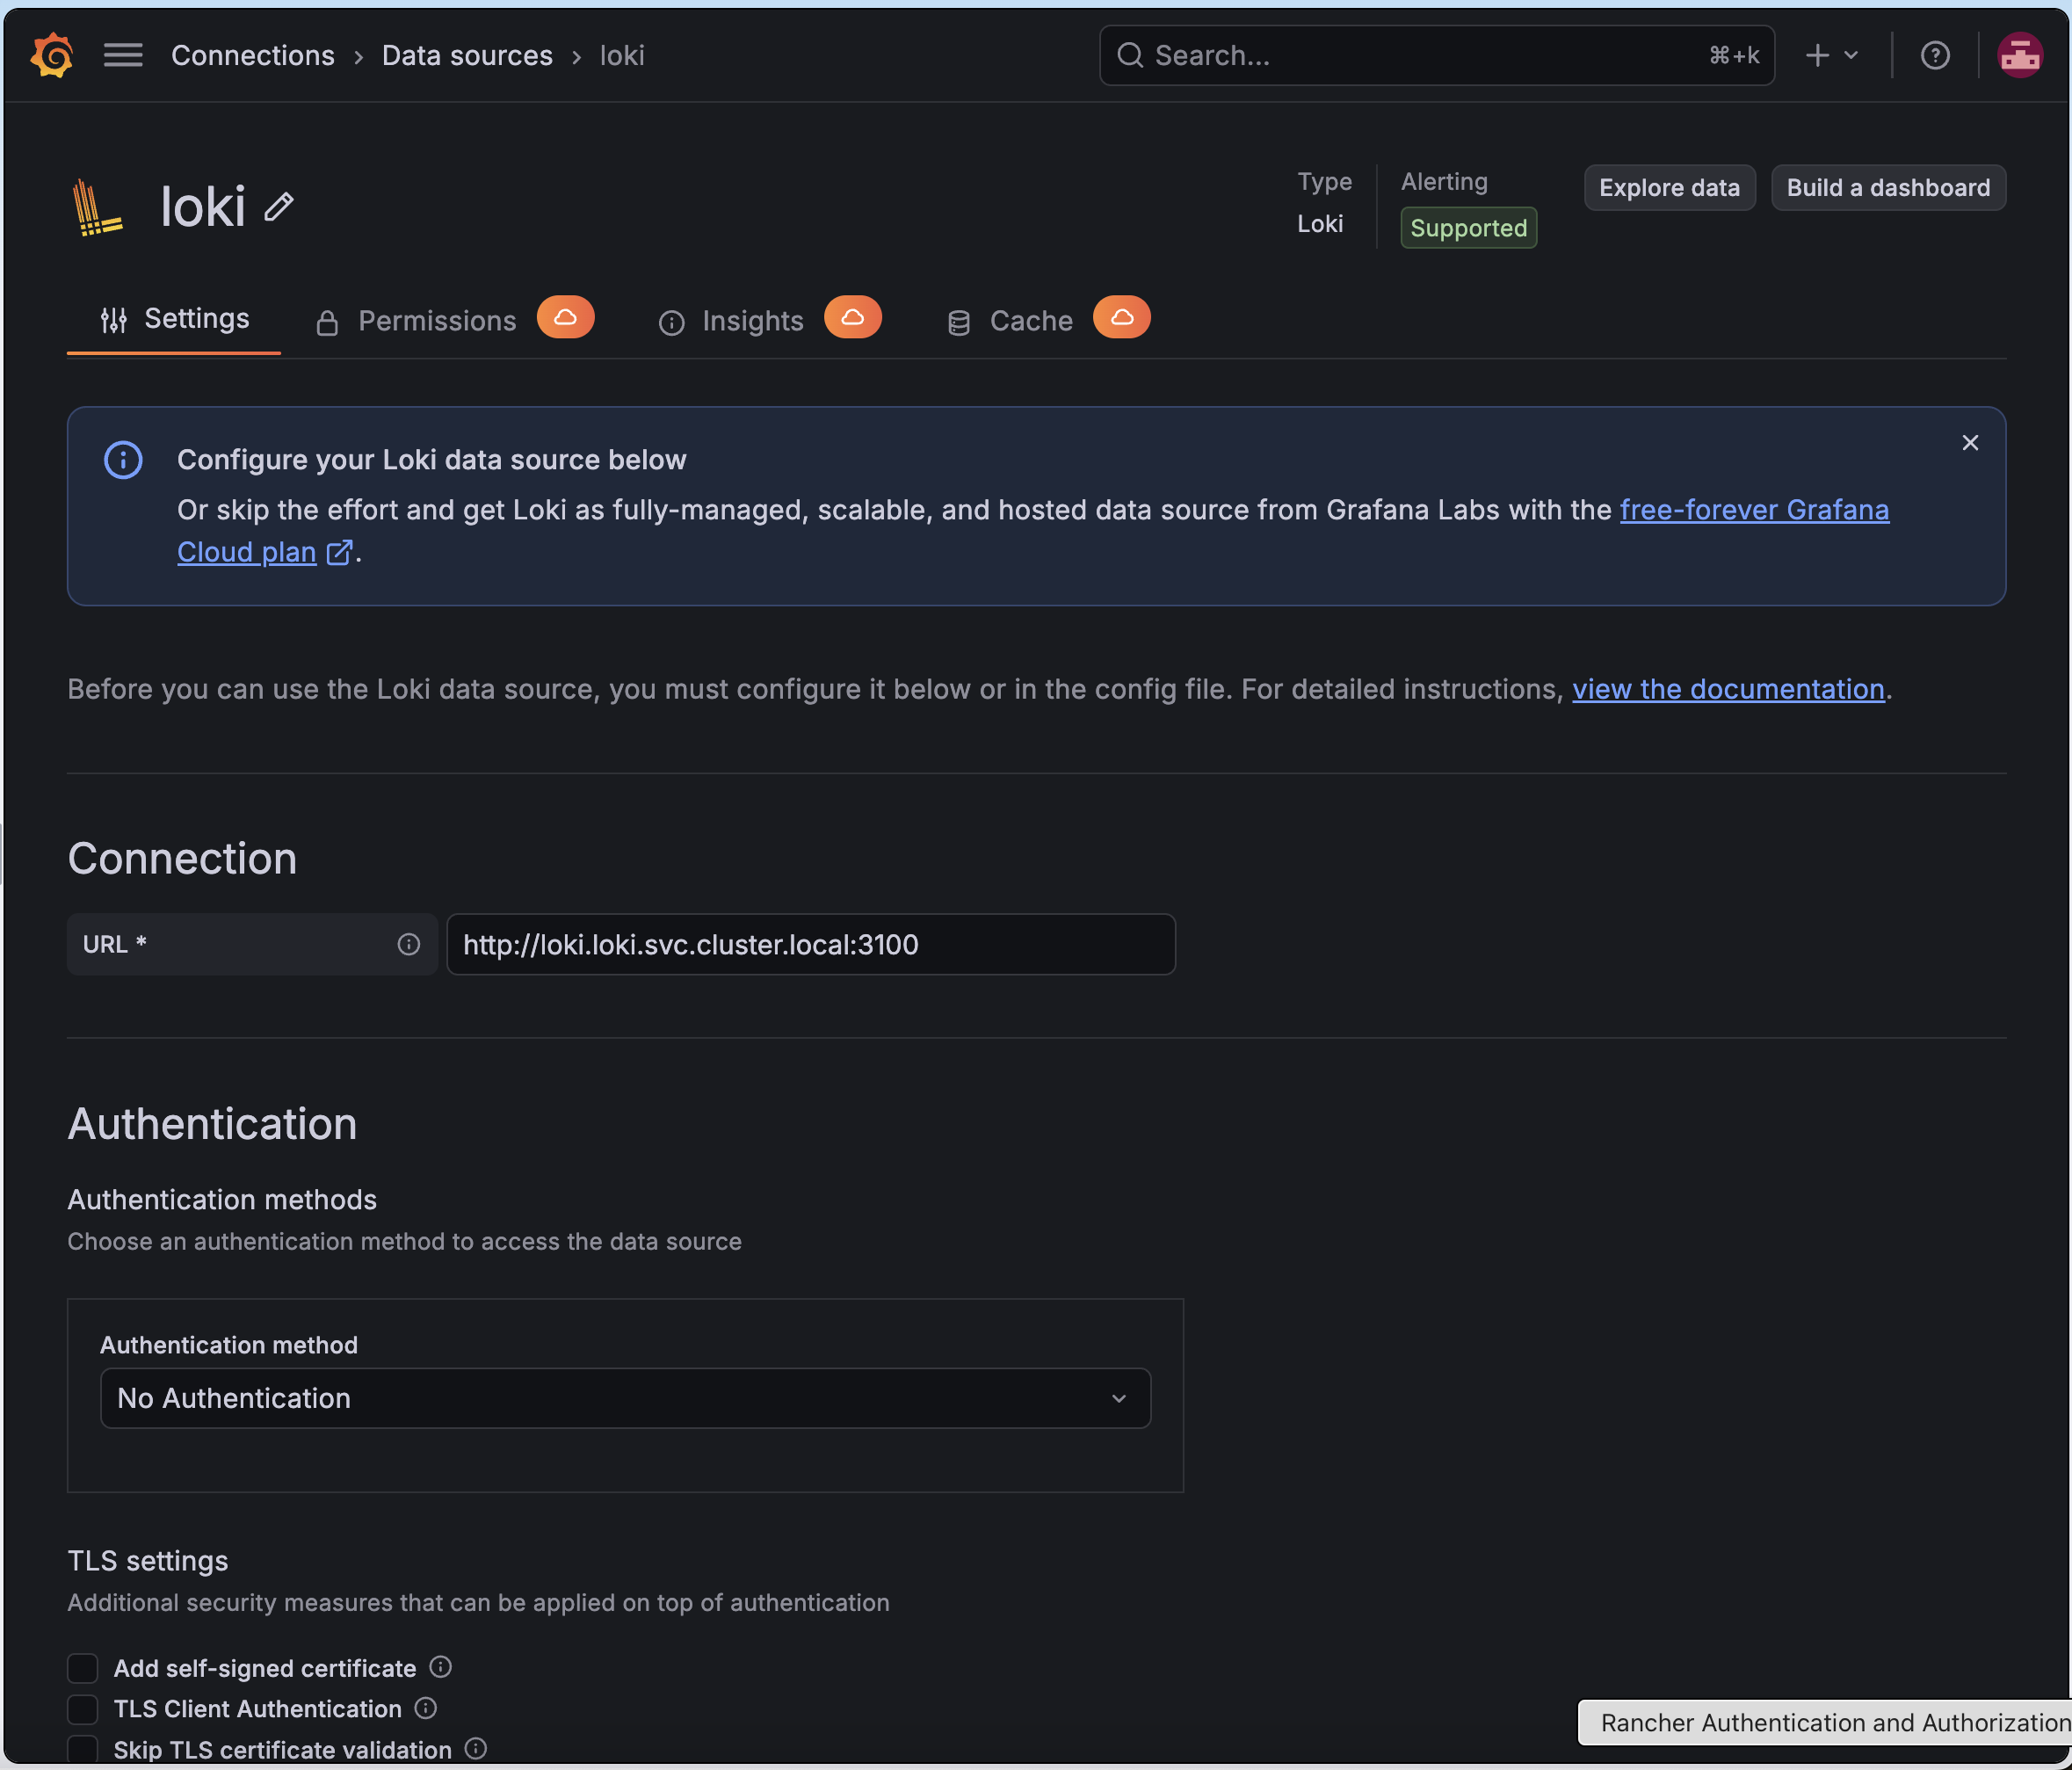
Adding Loki as a Grafana data source - the same Grafana that already holds the Prometheus data source for metrics.
Step 4: Query Your Cluster's Logs
Now explore the logs. In Grafana's left menu open Explore, select the Loki data source at the top, and enter a LogQL query. LogQL selects log streams by label, just like PromQL selects metrics. Start broad - all logs from a busy namespace:
{namespace="cattle-system"}
Run it, and you will see live log lines from Rancher's own pods. Because this cluster runs Rancher and the monitoring stack, there is always real activity to look at. Try other namespaces - kube-system, monitoring, loki itself - to see logs from across the cluster.
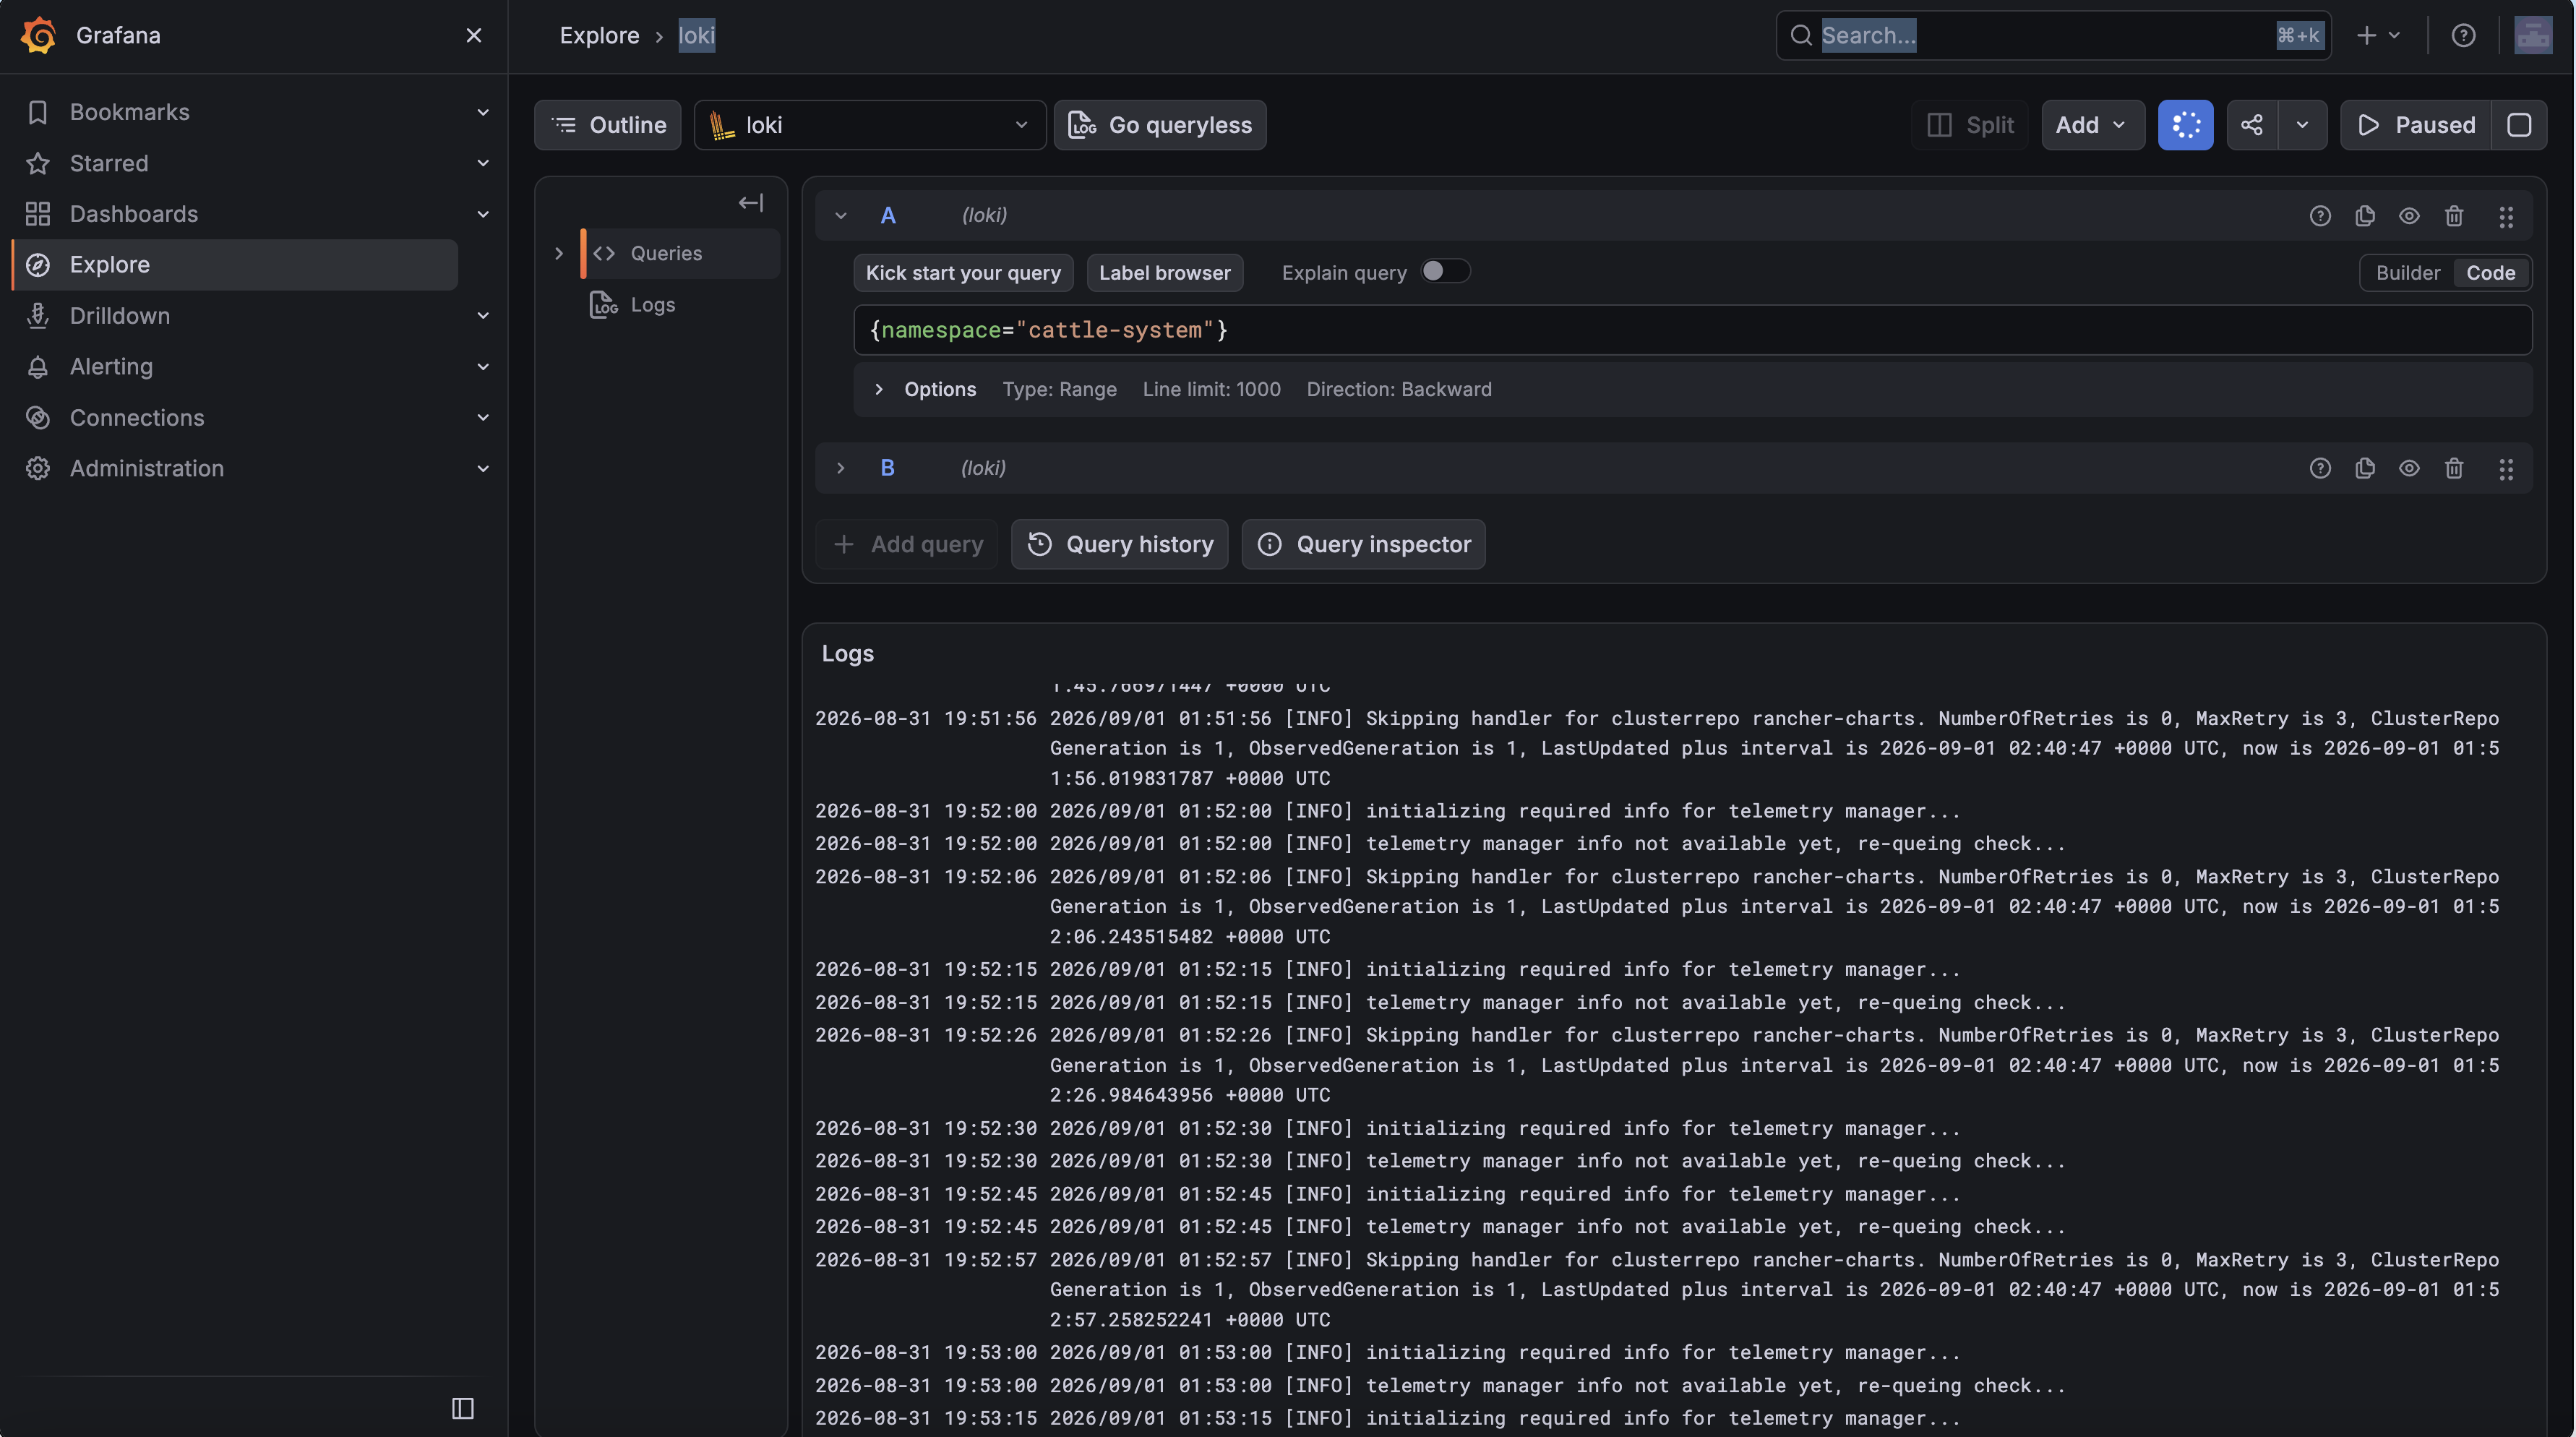
Querying logs in Grafana Explore with LogQL - the same interface you use for metrics, now over Loki.
A first taste of LogQL
A LogQL query has two parts. The stream selector in braces picks log streams by label, for example {namespace="cattle-system"}. You can then add a line filter to search the text, for example {namespace="cattle-system"} |= "error" to keep only lines containing "error". This mirrors PromQL: select by label, then refine. The official LogQL documentation goes deeper. (External link; content was rephrased for compliance with licensing restrictions.)
You're Done
You added the logs pillar to your observability setup: Loki stores logs, Alloy ships them from every node, and the Grafana you already run now queries both metrics and logs from one place. On a production cluster you would enable Rancher's Logging app for a managed version of this same pipeline, backed by object storage - but the parts you worked with here, Loki and a log collector feeding a shared Grafana, are exactly what it packages.
The challenge below has you build this pipeline yourself: install Loki and Alloy, wire Loki into Grafana, and prove a LogQL query returns your cluster's logs. Solving it records your progress.
- Previous lesson
- Observability and Monitoring
- Next lesson
- Security and Access Control