Doom Perf Lab Playground

Explore live host CPU/Memory/Disk/Network telemetry as an interactive Doom diagnostics lab. All the elements in the game react to system signals (eg, the cpu cores glow red when there's high utilization).
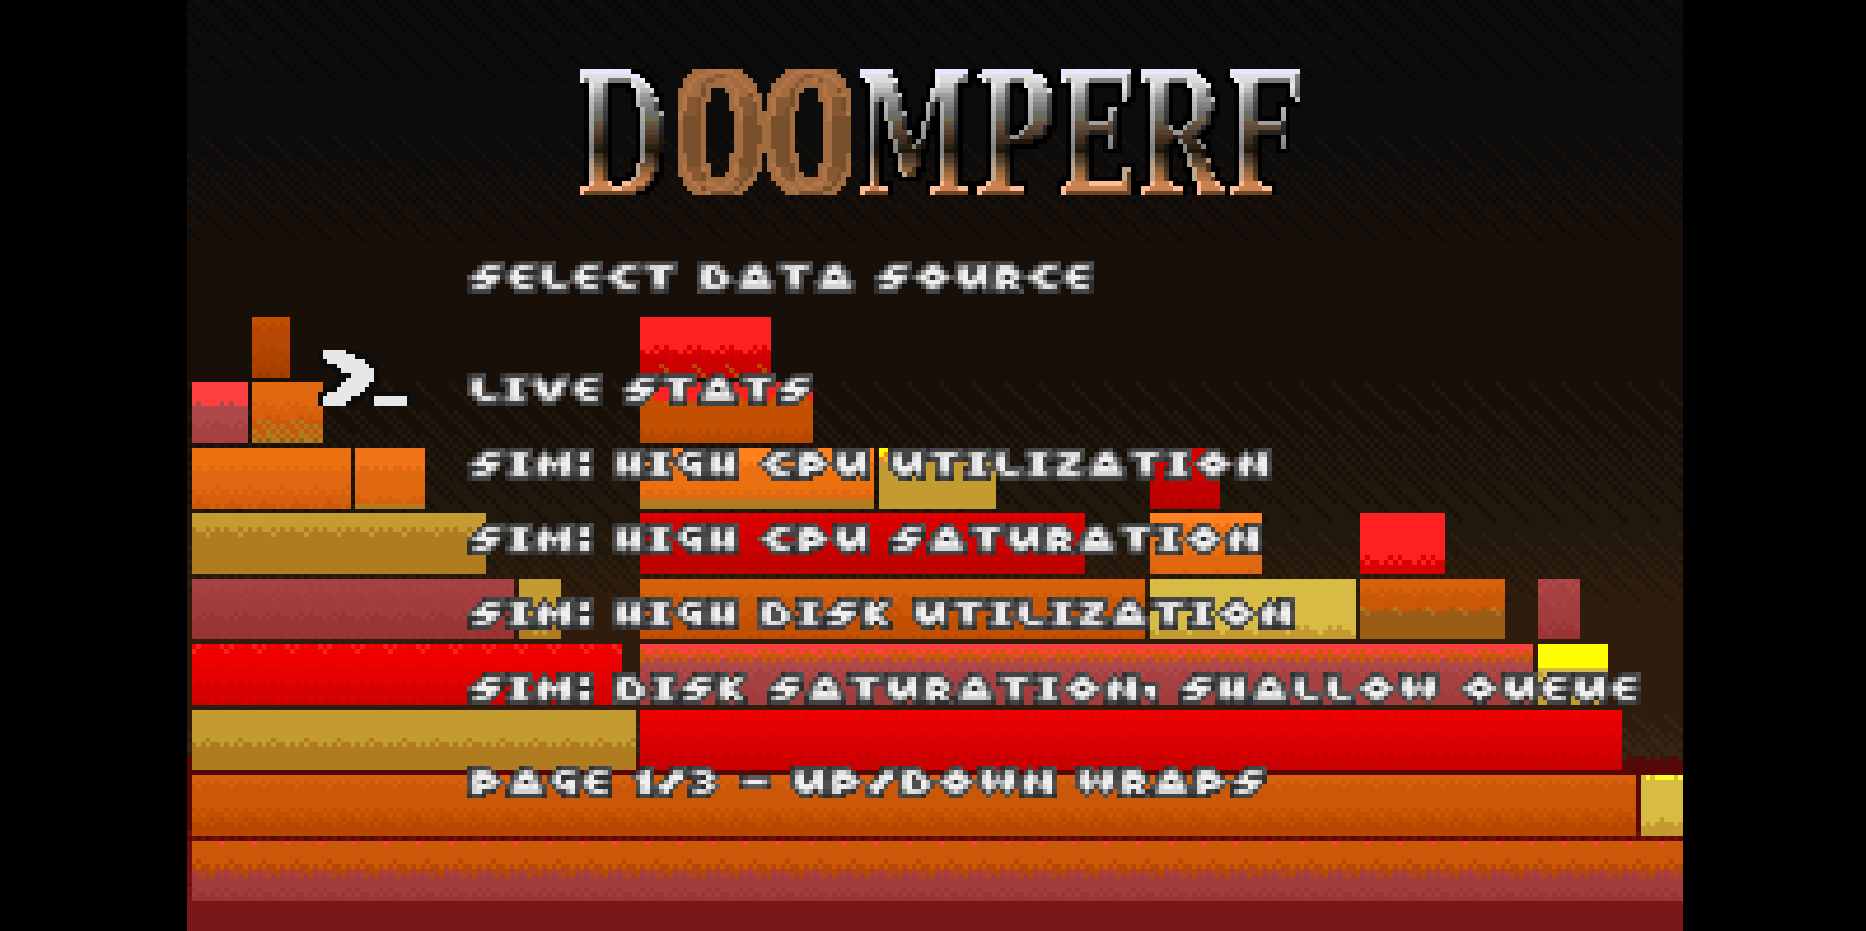
Brendan Gregg's USE Methodology is a super cool way to explore potential bottlenecks in different linux system components (CPU/Memory/Disk/Network), but a lot of the ways you'll see people demonstrating it are via a terminal.
This is a way to see the different system telemetry signals in a Doom environment. Based on the very cool https://github.com/pascalvanderheiden/doom-typescript.
The elements in each of the wings actually respond to live system telemetry (in live stats mode), so cpu cores glow red, disk IO orbs fly around faster, and memory pages fly in and out of the physical RAM.
Play one of the sim modes to see what utilization/saturation looks like, or combine live stats mode with the use-practice tool bundled in the playground to generate real load on the VM.
How to play
Open the "Doom Perf" tab, then click "Open Game" to launch it
in a separate browser tab with direct keyboard input.

Generate real host load to watch in the game's live-stats mode:
  use-practice run          # pick a resource + profile
  use-practice run cpu      # or target cpu|memory|disk|network
  use-practice status       # active run + PIDs
  use-practice reveal       # show the answer
  use-practice stop         # end the run

The scenarios intentionally stress CPU, memory, disk, or network;
this VM is disposable. CPU/memory/disk load appears in the game
immediately; network runs in a namespace, so verify it live.
You can wander freely, checking out the different visual elements of each wing, and there are also various wall terminals spaced around each wing so that you can see something closer to the output of real Linux commands.
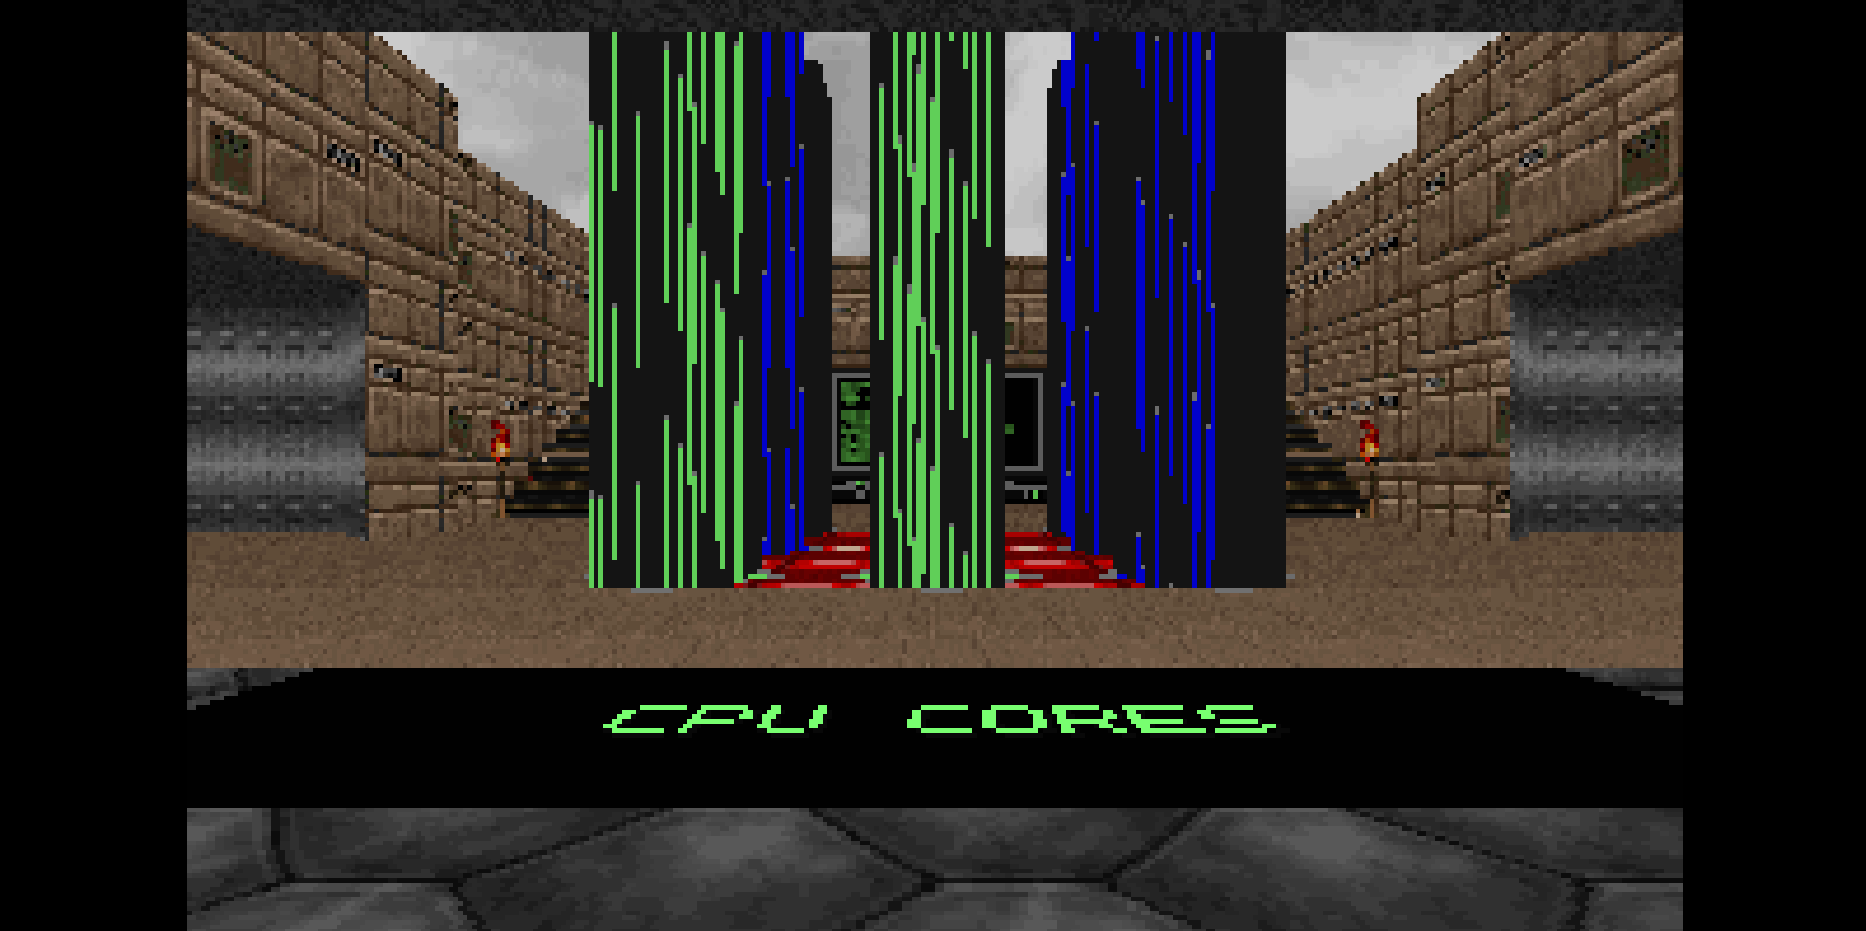
The CPU cores in the CPU wing will show the number of logical CPUs as well as the current utilization (color) and saturation (speed of motion) of the live VM.
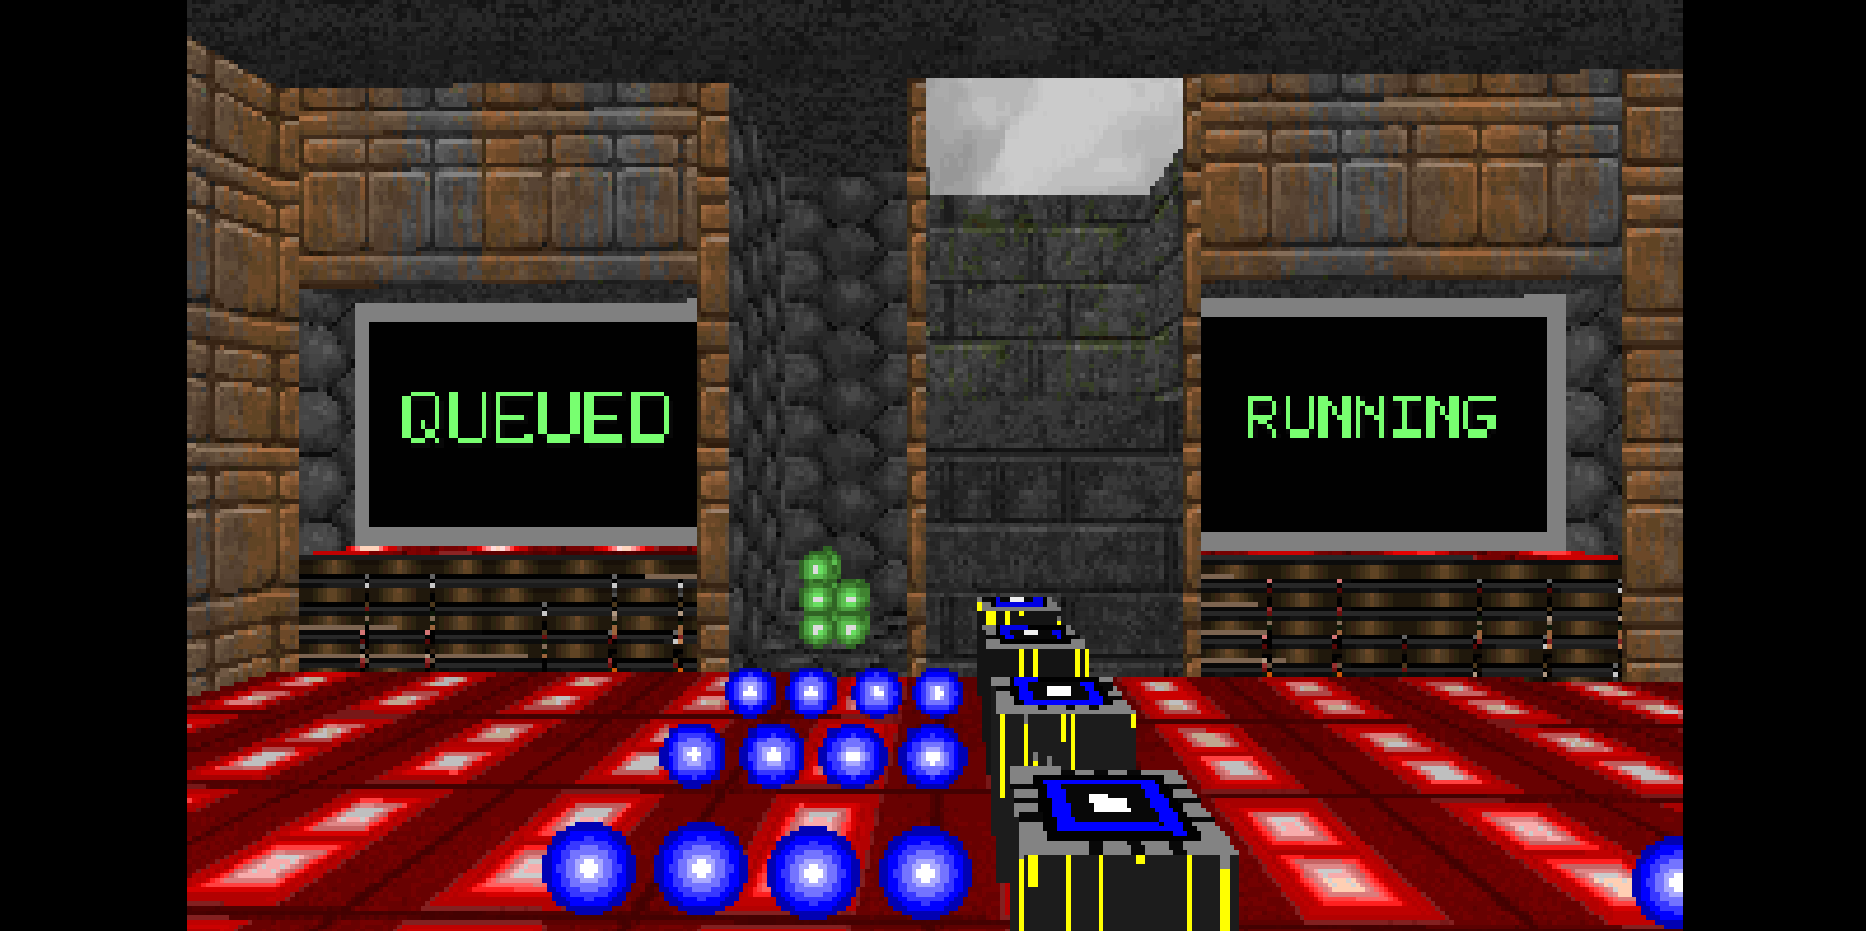
The run queue shows both threads that are waiting for time on-cpu as well as threads in D state blocked on IO from the live VM system.
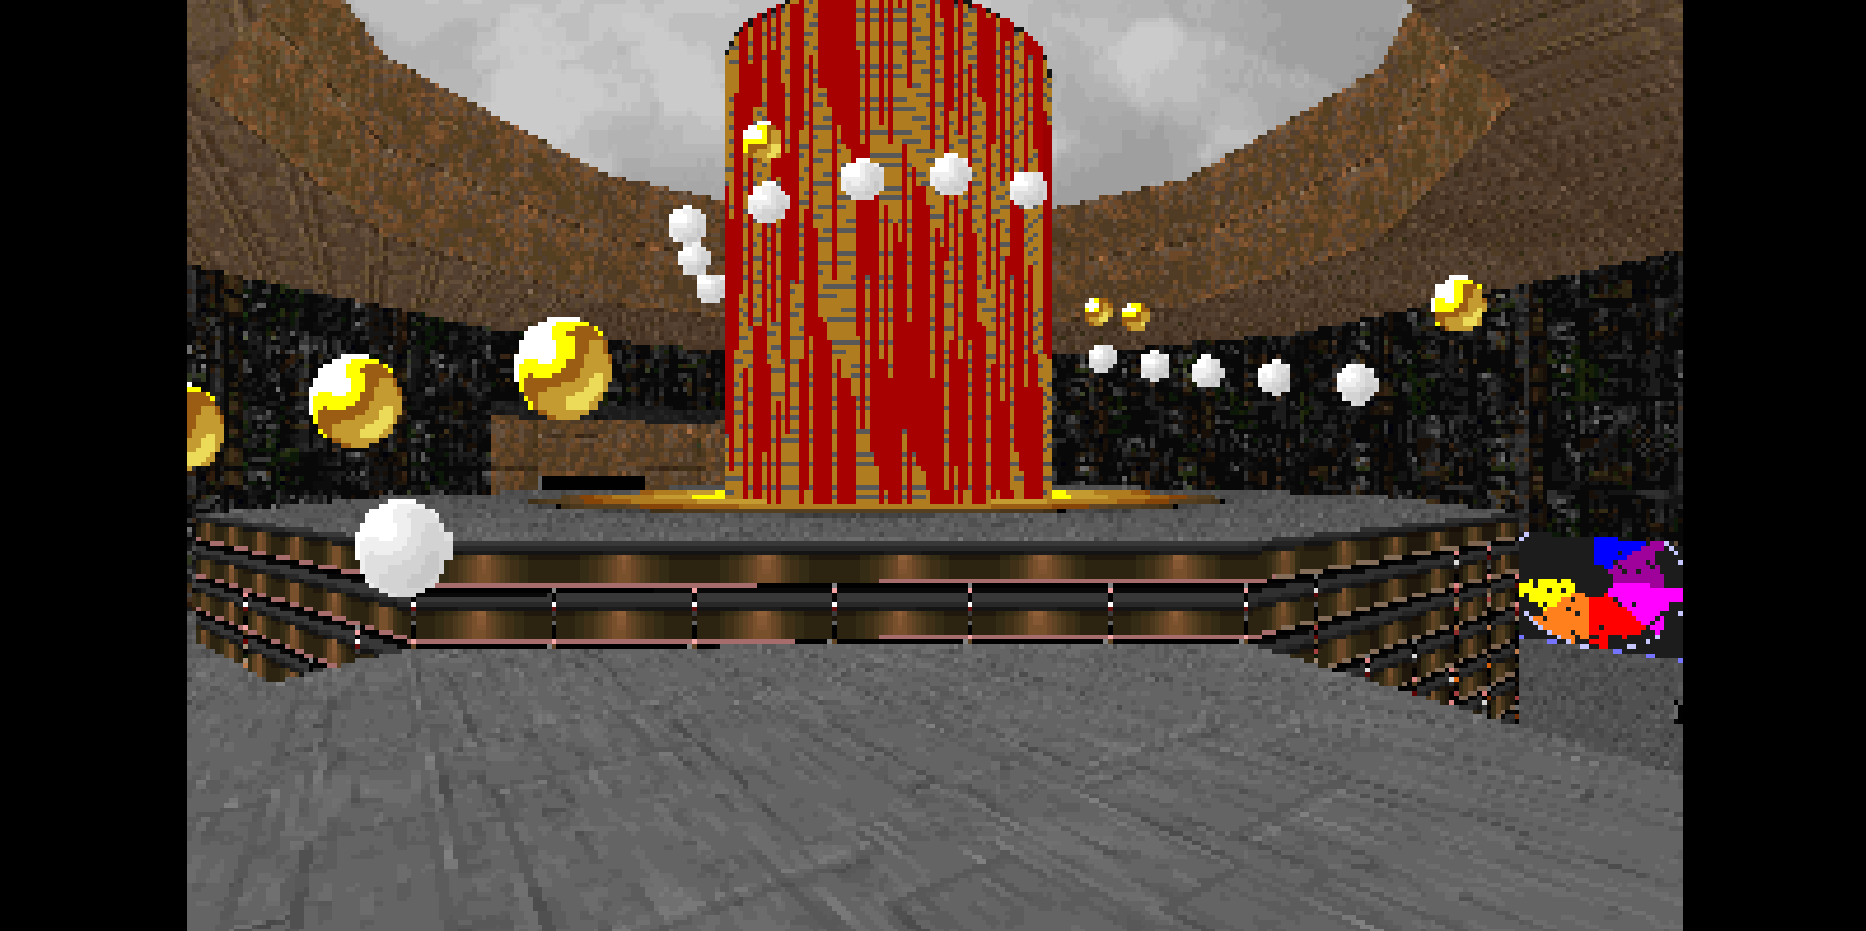
The central Disk wing element shows the utilization of the main disk in the live VM
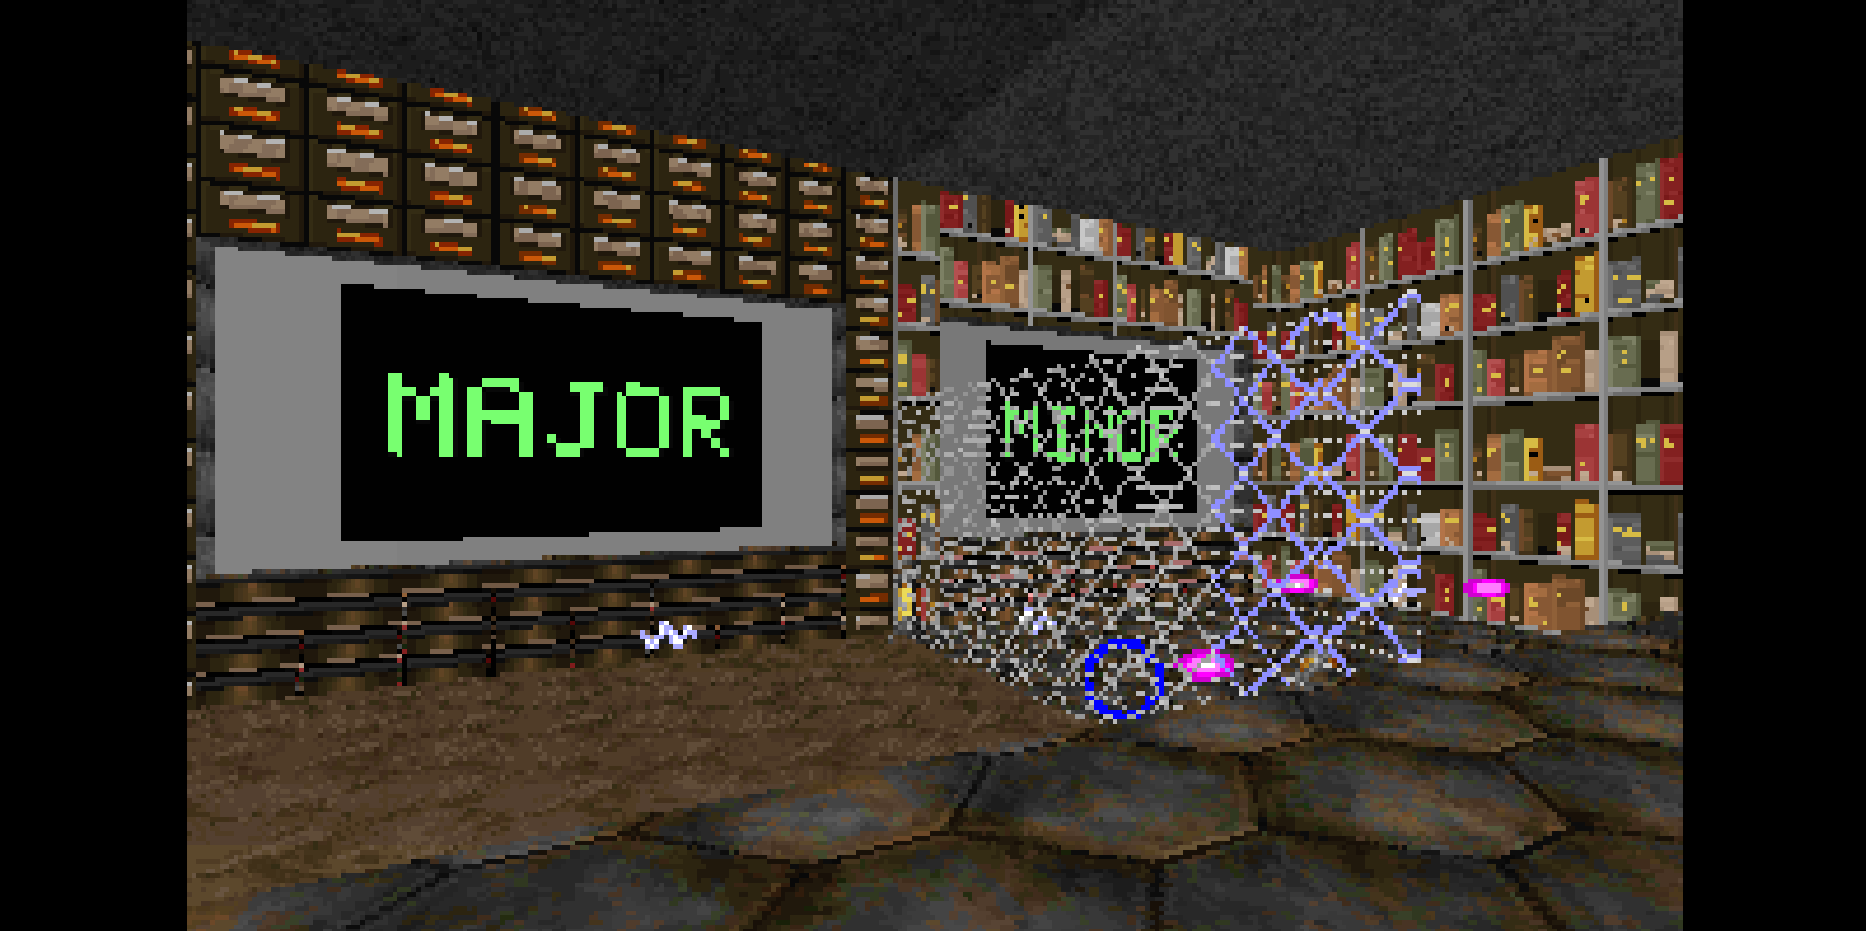
The minor and major page faults as pages get moved in and out of physical RAM on the live VM
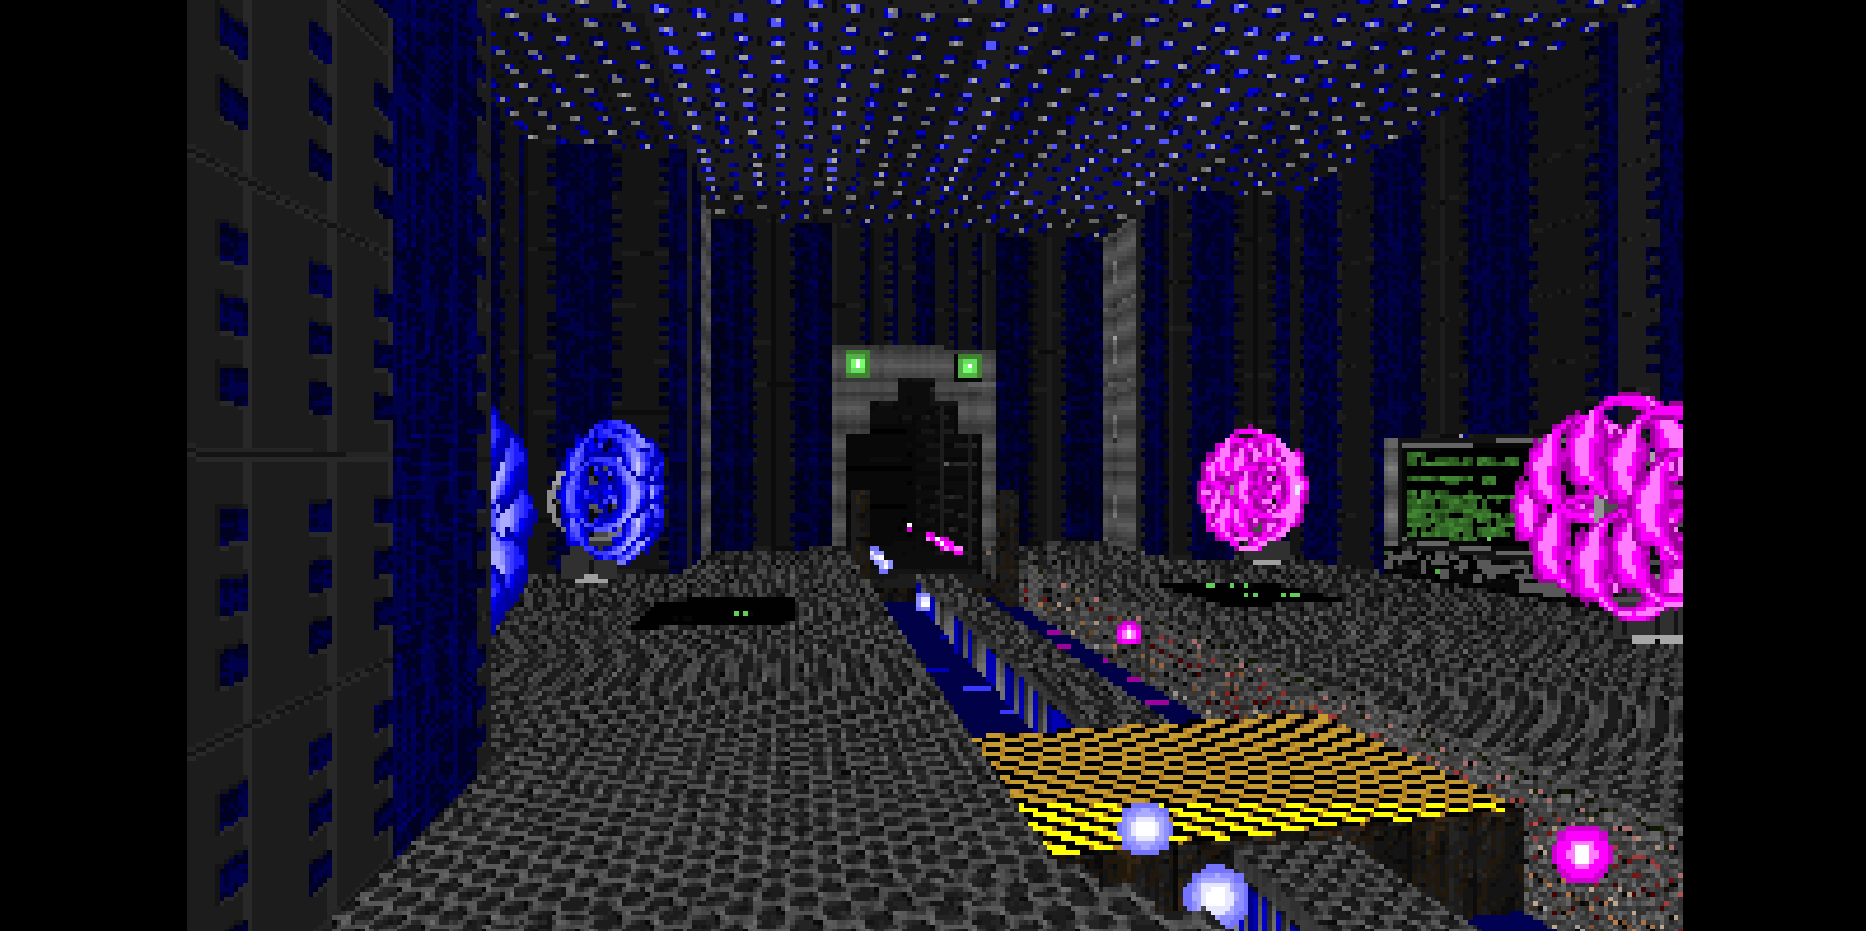
The network wing shows a downsampled representation of live network traffic from the VM
It's also got the use-practice and use-tool tools installed, so you can put real stress on the system to visualize in the Doom world. You can even run a random load and see if you can find it in the environment.
And if you're really curious, you might even find the easter egg hidden in there somewhere...
The source code is available at https://github.com/lpmi-13/doom-perf
A real VM, not a container
Get root on a VM with its own kernel, so Docker, Kubernetes, and systemd just work.
Read the docs →
SSH from browser or CLI
Use the built-in web terminal, or connect with labctl ssh, plain ssh, scp, or rsync.
Read the docs →
Drive it with AI
Let Claude, Codex, or any MCP client start this playground and run commands in it.
Read the docs →
Expose HTTP(S) ports
Give any web app running inside the VM a public URL - for yourself or to share with others.
Read the docs →
Share terminals
Invite others into your terminal session, or open it yourself from another device.
Read the docs →
Customize with init scripts
Add shell scripts that run at boot to install packages, clone repos, or seed test data.
Read the docs →
Private networking
VMs reach the internet via NAT with no public IP; several VMs share bridge networks.
Read the docs →
Ephemeral or persistent
By default, VMs are destroyed when the session ends; enable persistence to keep the disks for next time.
Read the docs →
Built-in container registry
A private registry.iximiuz.com for every playground to share images across services and VMs.
Read the docs →