MCP Fundamentals: Observability

Three modules in, the notes server speaks the MCP protocol, exposes tools,
resources, and prompts, and accepts only notes.access tokens bound to
its audience. Production's first question is the unglamorous one: when
it misbehaves at 2am, what do I look at? The answer has the familiar
service skeleton - logs, latency, distributed traces - plus MCP's
standardized messages and correlation semantics on the response stream.
This module builds both layers hands-on: first the protocol-native stream
- log lines and progress updates a tool emits while it runs, arriving as SSE frames your curl can watch in real time - then the OpenTelemetry layer, where the framework already emits spans for every protocol exchange and you wire them to Jaeger, including the spec's trace-context propagation that lets a client-chosen trace ID thread through the server.
Each tutorial starts a fresh playground; disks are not carried from one
module to the next. To make the series cumulative, this play seeds
server-obs.py with Module 3's canonical, complete protected server and
seeds the same Keycloak realm. You will add only the observability slice.
Prerequisites
- Module 1,
Module 2,
and Module 3,
or equivalent familiarity with MCP sessions, primitives,
and Bearer-protected calls. (
Contextis introduced here, not Module 2.) - Module 1's curl fluency - the SSE stream reading habit pays off here.
- curl, jq, and a tolerance for hex IDs.
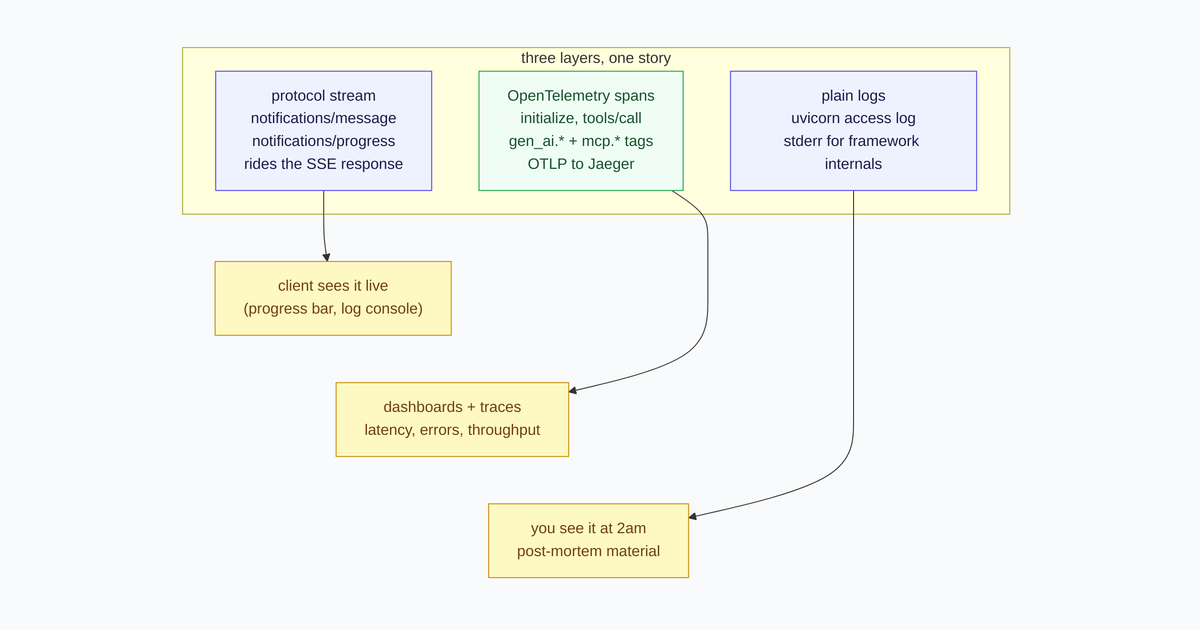
Three layers, one story: the protocol stream tells the client what is happening right now; spans tell you what happened; plain logs catch what neither can.
The protocol's own telemetry channel
Everything in this section comes from one insight you already own from
module 1 (MCP is Just HTTP POSTs): a tools/call POST can be answered with an SSE stream, and
nothing in the spec says that stream must carry only the final result.
If your SSE is rusty, here it is in one breath: Server-Sent Events is
an ordinary HTTP response that refuses to end. The server answers the
POST immediately with Content-Type: text/event-stream, then keeps the
connection open and pushes small text events down it while the tool
works. Each event is a two-line block - event: names the frame type,
data: carries the JSON-RPC payload - and curl -N just means "print
each event the moment it arrives, do not buffer". Keep those two roles
apart: SSE is the pipe, frames are the cargo traveling inside it.
While the tool runs, the server can interleave three kinds of frames:
- log messages -
notifications/messageframes with a severity level, a logger name, and free-form data (RFC 5424 severities, fromdebugtoemergency). They answer what is the tool doing right now. - progress updates -
notifications/progressframes. They answer how far along is it, and they are tied to the request via a token the caller supplies - why that matters in a moment. - and finally the JSON-RPC result.
FastMCP exposes this as a Context object your tool receives as a
parameter. ~/mcp-lab/server-obs.py already contains Module 3's complete
server: audience and scope validation, add_note, note_stats,
note_get with ToolError, static and templated resources with
ResourceError, review_notes, and tool annotations. Do not rewrite
that inherited code. Add asyncio and Context to its imports:
import asyncio
from fastmcp import Context, FastMCP
Then insert this one focused tool before the if __name__ == "__main__"
@mcp.tool(annotations={"readOnlyHint": True, "openWorldHint": False})
async def slow_report(ctx: Context, steps: int = 3) -> dict:
    """A deliberately slow audit that reports progress and logs as it works.

    Args:
        steps: How many audit steps to run (1-5).
    """
    results = []
    for i in range(1, steps + 1):
        await asyncio.sleep(0.5)
        await ctx.info(f"audit step {i}/{steps}: scanning notes")
        if i % 2 == 0:
            await ctx.debug(f"step {i}: cache hit, no rescan needed")
        await ctx.report_progress(progress=i, total=steps)
        results.append(f"step {i} ok")
    return {"audit": results, "total": steps}
Three details that make this file more than a loop:
ctx: Contextas the first parameter - the framework injects it; it never appears in the tool'sinputSchema, so the model never sees it.ctx.info(...)andctx.debug(...)becomenotifications/messageframes on the wire.ctx.report_progress(...)is opt-in from the caller's side - the ticks only flow if the request carries a_meta.progressToken. Why that is good design in a moment.
Start it and run the slow tool with streaming enabled. Note the
_meta.progressToken in the request below: the caller invents the label
tok-1 and ships it as a return address for progress ticks - watch it
come back in the stream:
cd ~/mcp-lab
uv run --with 'fastmcp==4.0.0' python server-obs.py
INFO     Starting MCP server 'notes-obs' with transport 'http' on http://127.0.0.1:8000/mcp
INFO:     Uvicorn running on http://127.0.0.1:8000 (Press CTRL+C to quit)
Module 3's OAuth dance is condensed into auth-env.sh: sourcing it
mints a fresh notes-cli token with HTTP Basic and the RFC 8707
resource parameter. The MCP calls remain expanded so the two boundaries
stay visible: Authorization proves access on every request;
mcp-session-id carries protocol state after initialization.
source ~/mcp-lab/auth-env.sh
SID=$(curl -sD- -o /dev/null -X POST "$MCP_URL" \
  -H "Authorization: Bearer $TOK" \
  -H 'Content-Type: application/json' \
  -H 'Accept: application/json, text/event-stream' \
  -d '{"jsonrpc":"2.0","id":1,"method":"initialize","params":{"protocolVersion":"2025-06-18","capabilities":{},"clientInfo":{"name":"curl","version":"1.0"}}}' \
  | grep -i '^mcp-session-id:' | tr -d '\r' | cut -d' ' -f2)
curl -s -o /dev/null -X POST "$MCP_URL" \
  -H "Authorization: Bearer $TOK" \
  -H 'Content-Type: application/json' -H 'Accept: application/json, text/event-stream' \
  -H "mcp-session-id: $SID" \
  -H 'MCP-Protocol-Version: 2025-06-18' \
  -d '{"jsonrpc":"2.0","method":"notifications/initialized"}'
curl -s -N -X POST "$MCP_URL" \
  -H "Authorization: Bearer $TOK" \
  -H 'Content-Type: application/json' -H 'Accept: application/json, text/event-stream' \
  -H "mcp-session-id: $SID" \
  -H 'MCP-Protocol-Version: 2025-06-18' \
  -d '{"jsonrpc":"2.0","id":3,"method":"tools/call","params":{"name":"slow_report","arguments":{"steps":2},"_meta":{"progressToken":"tok-1"}}}' \
  | tee ~/mcp-lab/telemetry.sse
event: message
data: {"jsonrpc":"2.0","method":"notifications/message","params":{"level":"info","data":{"msg":"audit step 1/2: scanning notes","extra":null}}}

event: message
data: {"jsonrpc":"2.0","method":"notifications/progress","params":{"progressToken":"tok-1","progress":1.0,"total":2.0}}

event: message
data: {"jsonrpc":"2.0","method":"notifications/message","params":{"level":"info","data":{"msg":"audit step 2/2: scanning notes","extra":null}}}

event: message
data: {"jsonrpc":"2.0","method":"notifications/message","params":{"level":"debug","data":{"msg":"step 2: cache hit, no rescan needed","extra":null}}}

event: message
data: {"jsonrpc":"2.0","method":"notifications/progress","params":{"progressToken":"tok-1","progress":2.0,"total":2.0}}

event: message
data: {"jsonrpc":"2.0","id":3,"result":{"content":[{"text":"{\"audit\":[\"step 1 ok\",\"step 2 ok\"],\"total\":2}","type":"text"}],"isError":false,"structuredContent":{"audit":["step 1 ok","step 2 ok"],"total":2}}}
With curl -N (unbuffered) you are watching this happen live: two log
lines and two progress ticks streamed out of the running tool, then the
answer, all inside one HTTP response. HTTP POST responses can stream too;
MCP's contribution is standardizing the JSON-RPC message types and the
correlation semantics clients use while that stream is open.
Progress is opt-in - and that is the design
Two kinds of frames just streamed past you, and they are easy to blur together. Split them first: they answer different questions and obey different switches.
- Log frames (
notifications/message, emitted byctx.infoandctx.debug) answer what is the tool doing right now. The caller controls their volume withlogging/setLevel- that is the next section. - Progress frames (
notifications/progress, emitted byctx.report_progress) answer how far along is it. Whether they exist at all is decided per request by the caller, with_meta.progressToken.
Prove the second switch: run the same call without the progress token -
and without the tee, so telemetry.sse keeps the complete stream the
grader checks.
curl -s -N -X POST "$MCP_URL" \
  -H "Authorization: Bearer $TOK" \
  -H 'Content-Type: application/json' -H 'Accept: application/json, text/event-stream' \
  -H "mcp-session-id: $SID" \
  -H 'MCP-Protocol-Version: 2025-06-18' \
  -d '{"jsonrpc":"2.0","id":3,"method":"tools/call","params":{"name":"slow_report","arguments":{"steps":2}}}'
event: message
data: {"jsonrpc":"2.0","method":"notifications/message","params":{"level":"info","data":{"msg":"audit step 1/2: scanning notes","extra":null}}}

event: message
data: {"jsonrpc":"2.0","id":3,"result":{...}}
Read the asymmetry carefully: the progress ticks are gone, but the log lines still arrive and so does the result. Exactly one frame type obeyed the switch - the logs were never gated on it.
Why is progress the picky one? Because a progress tick is addressed
mail, and the token is its return address. The caller invents a label -
tok-1 - and ships it in _meta with the request. Every tick the
server sends carries that exact label back, so a client with five tool
calls in flight knows which tick belongs to which call. No token in the
request means no return address - nobody to address the update to - so
the server sends none. Compare with REST: the server decides whether you
get telemetry. MCP flips it: the client declares, per request, which
updates it wants to receive and how to correlate them. A headless
batch job skips the token and receives pure results; a chat UI sends a
token per call and renders a progress bar from the ticks.
The level dial
Log volume is also client-controlled. The logging/setLevel request
tells the server the minimum severity to ship:
curl -s -X POST http://127.0.0.1:8000/mcp \
  -H "Authorization: Bearer $TOK" \
  -H 'Content-Type: application/json' -H 'Accept: application/json, text/event-stream' \
  -H "mcp-session-id: $SID" \
  -H 'MCP-Protocol-Version: 2025-06-18' \
  -d '{"jsonrpc":"2.0","id":4,"method":"logging/setLevel","params":{"level":"info"}}'
event: message
data: {"jsonrpc":"2.0","id":4,"result":{}}
An empty result - the protocol's way of saying "acknowledged". Now re-run
slow_report: the info lines still arrive, the debug line ("cache
hit") is filtered server-side before it ever leaves. Severity levels
follow RFC 5424 (the syslog scale): debug, info, notice, warning, error,
critical, alert, emergency - and a noisy tool can no longer flood a
quiet caller.
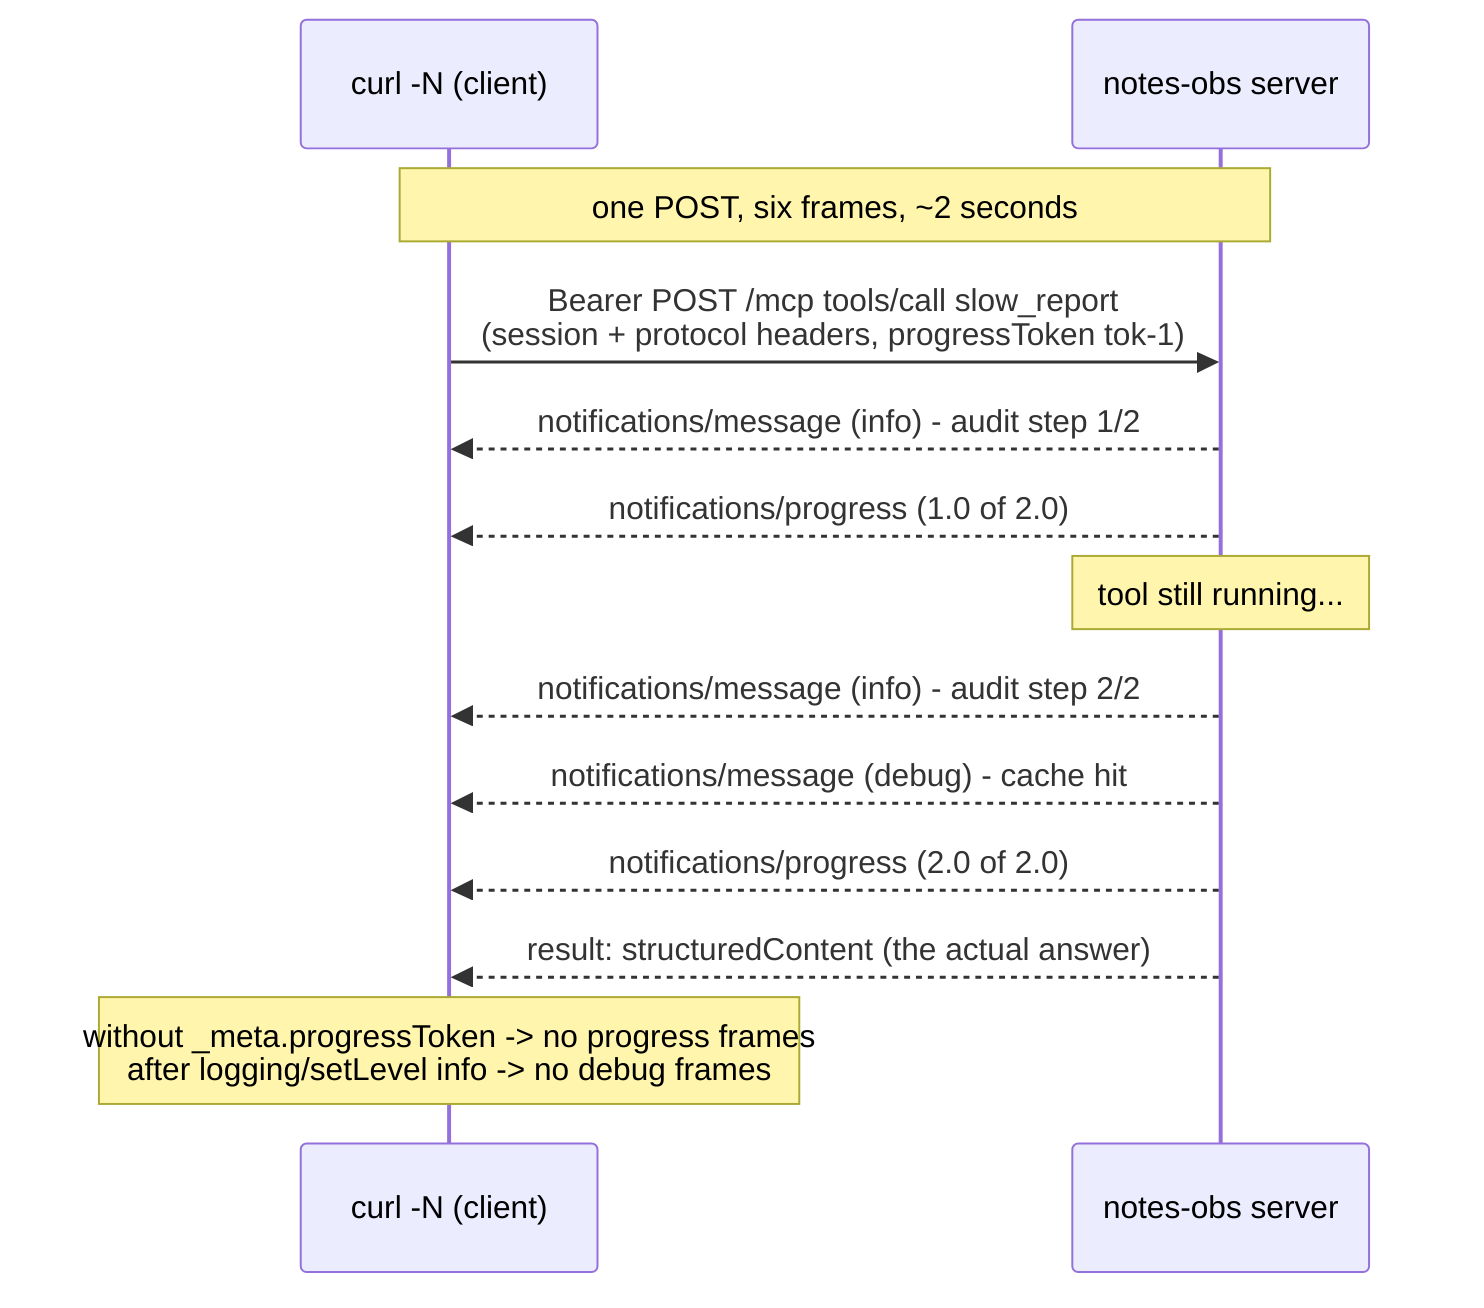
One POST, six frames, in order. MCP gives the streamed response a shared message vocabulary and request-correlation contract.
2026 compatibility: protocol logging is deprecated
This lab deliberately pins protocol version 2025-06-18. Under that
protocol, notifications/message and logging/setLevel are
client-facing compatibility behavior and are correct to exercise. In the
2026-07-28 revision, protocol Logging is deprecated in favor of
OpenTelemetry, logging/setLevel disappears, and log level moves to
per-request _meta. Keep the compatibility path for pinned 2025 clients,
but build operational collection around OpenTelemetry.
Spans: what your framework already emits
FastMCP emits OpenTelemetry spans natively - but only writes them if you configure an SDK and an exporter. First, look at what the spans contain by pointing them at a collector. Jaeger's all-in-one image gives you a collector, storage, query API, and UI in one container; the playground already started it (UI on port 16686, OTLP on 4318).
Add the four-line SDK block at the top of server-obs.py - above
the FastMCP import, so the provider exists before any span is created:
from opentelemetry import trace
from opentelemetry.exporter.otlp.proto.http.trace_exporter import OTLPSpanExporter
from opentelemetry.sdk.resources import Resource
from opentelemetry.sdk.trace import TracerProvider
from opentelemetry.sdk.trace.export import BatchSpanProcessor

provider = TracerProvider(resource=Resource.create({"service.name": "notes-mcp"}))
provider.add_span_processor(
    BatchSpanProcessor(OTLPSpanExporter(endpoint="http://127.0.0.1:4318/v1/traces"))
)
trace.set_tracer_provider(provider)
The direct dependencies are pinned to metadata resolved for this module.
OpenTelemetry's MCP/GenAI semantic conventions are still Development
and version-sensitive (opentelemetry-semantic-conventions==0.65b0 is
resolved transitively here), so do not treat individual attribute names
as a stable production contract yet.
uv run --with 'fastmcp==4.0.0' \
  --with 'opentelemetry-sdk==1.44.0' \
  --with 'opentelemetry-exporter-otlp-proto-http==1.44.0' \
  python server-obs.py
INFO     Starting MCP server 'notes-obs' with transport 'http' on http://127.0.0.1:8000/mcp
INFO:     Uvicorn running on http://127.0.0.1:8000 (Press CTRL+C to quit)
No other code changes - the framework already emits spans around every protocol operation; the SDK block merely gives them somewhere to go. Now prove the whole pipeline in two moves: generate a span, then ask Jaeger what it received.
Move 1 - generate a span. The restart invalidated the old session. Source the helper to refresh the five-minute token, then run the familiar initialize, notify, call choreography. Every MCP request carries Bearer; every post-initialize request also carries the negotiated protocol header.
source ~/mcp-lab/auth-env.sh
SID=$(curl -sD- -o /dev/null -X POST "$MCP_URL" \
  -H "Authorization: Bearer $TOK" \
  -H 'Content-Type: application/json' \
  -H 'Accept: application/json, text/event-stream' \
  -d '{"jsonrpc":"2.0","id":1,"method":"initialize","params":{"protocolVersion":"2025-06-18","capabilities":{},"clientInfo":{"name":"curl","version":"1.0"}}}' \
  | grep -i '^mcp-session-id:' | tr -d '\r' | cut -d' ' -f2)
curl -s -o /dev/null -X POST "$MCP_URL" \
  -H "Authorization: Bearer $TOK" \
  -H 'Content-Type: application/json' -H 'Accept: application/json, text/event-stream' \
  -H "mcp-session-id: $SID" \
  -H 'MCP-Protocol-Version: 2025-06-18' \
  -d '{"jsonrpc":"2.0","method":"notifications/initialized"}'
curl -s -X POST "$MCP_URL" \
  -H "Authorization: Bearer $TOK" \
  -H 'Content-Type: application/json' -H 'Accept: application/json, text/event-stream' \
  -H "mcp-session-id: $SID" \
  -H 'MCP-Protocol-Version: 2025-06-18' \
  -d '{"jsonrpc":"2.0","id":5,"method":"tools/call","params":{"name":"add_note","arguments":{"text":"first traced note","tag":"otel"}}}'
event: message
data: {"jsonrpc":"2.0","id":5,"result":{"content":[{"text":"{\"saved\":1,\"total\":1}","type":"text"}],"isError":false,"structuredContent":{"saved":1,"total":1}}}
The protocol exchange is familiar, now with Module 3's authorization boundary intact. What is new is invisible: for each request, FastMCP wrapped the handling in an OpenTelemetry span, and the four lines you added at the top of the file exported it over OTLP to Jaeger. You wrote no logging statements and created no spans by hand - you only gave the spans somewhere to go.
Move 2 - ask Jaeger what it received. Jaeger's all-in-one serves two things on port 16686: the web UI you could open in a browser, and a plain JSON query API that curl can drive - the API is what we will use. First question: which services have reported traces to you?
sleep 6
curl -s 'http://127.0.0.1:16686/api/services' | jq -c '.data'
["jaeger-all-in-one","notes-mcp"]
Read the answer: jaeger-all-in-one is Jaeger tracing its own
collector; notes-mcp is your server - it has become a service in a
tracing backend. (The sleep 6 is not about the tool call - it waits
out the exporter: BatchSpanProcessor buffers spans and flushes every
five seconds by default.)
Second question: what exactly is inside those traces? Ask Jaeger for
recent traces from notes-mcp; the jq keeps only the tools/call
spans and, within them, only the tags whose names start with mcp.
or gen_ai.:
curl -s 'http://127.0.0.1:16686/api/traces?service=notes-mcp&limit=20' \
  | jq -c '[.data[].spans[] | select(.operationName | startswith("tools/call")) | {operationName, tags: [.tags[] | select(.key | test("mcp\\.|gen_ai\\.")) | {key, value}]}]' \
  | head -c 900
[{
  "operationName": "tools/call add_note",
  "tags": [
    {"key": "gen_ai.tool.name", "value": "add_note"},
    {"key": "mcp.method.name", "value": "tools/call"},
    {"key": "mcp.protocol.version", "value": "2025-06-18"},
    {"key": "mcp.session.id", "value": "8e5a94041d3841d08e3c333427d76e3f"},
    {"key": "span.kind", "value": "server"}
  ]
}]
Read that as an SRE would:
operationName: "tools/call add_note"- what ran.gen_ai.tool.name- the Development GenAI semantic-conventions tag; it is useful today but may move as those conventions stabilize.mcp.session.id- the correlation key to module 1's session header.mcp.protocol.version- which dialect was spoken.span.kind: server- standard OTel: this span served a request.
And initialize shows up as its own span. Latency, error status,
throughput per tool - all of it is now a Jaeger query away, which is
exactly what the deprecation notice above meant: OpenTelemetry is where
MCP's operational story is headed.
Distributed tracing across the protocol boundary
Here is the piece that makes MCP observability genuinely interesting.
Because the caller is often another program (or another LLM pipeline),
the interesting question is not "what did the server do" but "how did
this user request traverse host, server, and upstream APIs". The
answer is trace-context propagation - and the MCP spec defines exactly
how (SEP-414): the client puts a W3C traceparent string in _meta,
and the server's span joins that trace instead of starting its own.
You can prove it with curl, because you can be the upstream system.
The session from Move 1 is still active; refresh TOK and initialize
again first if five minutes have passed.
TRACE_ID=$(openssl rand -hex 16)
SPAN_ID=$(openssl rand -hex 8)
TP="00-$TRACE_ID-$SPAN_ID-01"
echo "your trace: $TRACE_ID"
curl -s -o /dev/null -X POST "$MCP_URL" \
  -H "Authorization: Bearer $TOK" \
  -H 'Content-Type: application/json' -H 'Accept: application/json, text/event-stream' \
  -H "mcp-session-id: $SID" \
  -H 'MCP-Protocol-Version: 2025-06-18' \
  -d "{\"jsonrpc\":\"2.0\",\"id\":9,\"method\":\"tools/call\",\"params\":{\"name\":\"add_note\",\"arguments\":{\"text\":\"propagated trace\",\"tag\":\"otel\"},\"_meta\":{\"traceparent\":\"$TP\"}}}"
sleep 6
curl -s "http://127.0.0.1:16686/api/traces/$TRACE_ID" \
  | jq -c '{found: (.data | length), spans: [(.data[0].spans // [])[].operationName]}'
your trace: b082492b19513d8ebf1312340427e14a
{"found":1,"spans":["tools/call add_note"]}
You chose a random 128-bit trace ID, and the server's span - created
inside a framework you did not modify - landed under it. That is the
whole contract: traceparent in, server-side child spans out, same
trace. A real host does the identical thing for every model call, so
one Jaeger waterfalls shows: model call → tool selection → tools/call
→ server work. The 02222222 debug story becomes a picture.

From a raw curl command to a queryable trace, with the spec's _meta propagation carrying your trace ID across the protocol boundary.
What to actually watch in production
With both layers in place, a REST developer's operational instincts transfer almost unchanged:
- Latency per operation. Spans give you p50/p99 per
tools/calltool - the MCP equivalent of per-endpoint latency dashboards. - In-band errors are invisible to status-code dashboards. Module 1's
isError: trueresults ride inside HTTP 200s - so 5xx-based alerting misses them. Alert on spanstatus(FastMCP records tool errors on the span) and on tool-result error flags, not HTTP codes alone. - Session churn.
mcp.session.idtags let you follow one caller's whole conversation; 404-after-DELETE patterns (module 1) show up as session restart storms - the same metric session-tracking gives you in web apps. - The stream is part of the story. Long-lived SSE responses are long-lived HTTP requests; watch connection duration and open-stream counts, exactly as you would for websockets.
- Plain logs still matter. Uvicorn's access log lines (every frame you have seen scroll in Terminal 1) plus stderr logging for framework-internal failures. Protocol logging tells the client; stderr tells you; spans tell your dashboards.
Summary
You now have the series' complete server in one process: the MCP protocol;
tools, resources, and prompts; audience-bound notes.access
authorization; and observability. The slow tool wrote log and progress
messages into its authenticated response stream; the caller correlated
progress with a token; FastMCP's spans reached Jaeger; and _meta
propagated a client-chosen trace ID. Protocol logging remains
client-facing compatibility behavior for the pinned 2025 protocol,
while OpenTelemetry is the durable operational path.
The frame timeline from earlier in the module - now read it as: one request, one trace, and a client-controlled channel, all at once.
That closes the series loop. Every module started from a fresh play and seeded the canonical code from its predecessor rather than relying on preserved disk state. You began with one JSON-RPC POST; you end owning the protocol, all three server primitives, audience-bound auth, and observability in one cumulative server.
Where to go from here:
- The series in order: 1. MCP is Just HTTP POSTs - 2. Build a Real MCP Server - 3. OAuth 2.1 Auth and Security - 4. this module.
- The specification's logging and tracing material, with the 2026 deprecations in context: modelcontextprotocol.io - Logging (2025-06-18) and the OpenTelemetry trace-context conventions.
- For the GenAI semantic conventions your spans now speak: OpenTelemetry GenAI observability.
About the Author

More tutorials you might like

Getting Started with VictoriaMetrics on Kubernetes
Deploy VictoriaMetrics on Kubernetes using the VM Operator, configure metrics scraping with CRDs, and query cluster metrics.

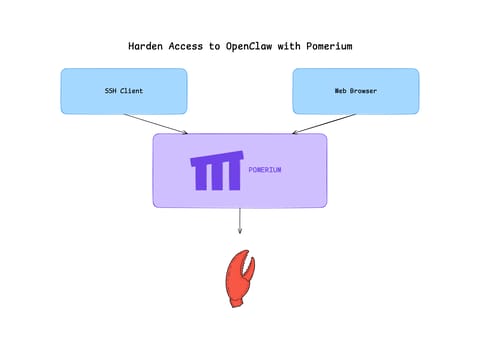
Harden Access to OpenClaw with Pomerium
Put OpenClaw, a self-hosted AI assistant with shell and file access, behind a web route and an SSH route, both gated by the same identity and Pomerium's context-aware policy. OpenClaw runs in trusted-proxy mode, trusting signed identity headers instead of its own login, while Pomerium's native SSH proxy signs short-lived certificates for shell access.

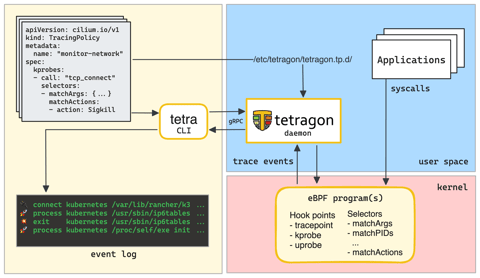
Exploring Tetragon - A Security Observability Tool for Kubernetes, Docker, and Linux
What is Tetragon, how it works, and how to use it to detect and react to security-significant events in your Kubernetes, Docker, or plain Linux environment.

eBPF and WASM - Better Together
Learn how Inspektor Gadget pairs eBPF with WASM to process kernel events—and walk through the same idea yourself by implementing a minimal example.

Learn by doing, not just by reading or watching
Sign up for a free account to start a VM playground right on this page, track your progress, and get notified about new learning materials.