Exploring Tetragon - A Security Observability Tool for Kubernetes, Docker, and Linux
Tetragon, a CNCF-backed project developed by Isovalent (the creators of Cilium), is an eBPF-powered tool for security observability [sic] and runtime enforcement.
What it actually means is that Tetragon can:
- Detect system activity events like process executions, file access, or network I/O.
- React on security-significant events by sending signals or overriding syscall return values.
There are other tools that can do similar things, but Tetragon has a few features that make it stand out:
- Supported environments - Tetragon can be used in Kubernetes, Docker, and even on plain Linux.
- Identity awareness - Tetragon can detect and react to events based on the identity of the process that triggered them.
- Ease of installation - Tetragon is really easy to install and start using since it doesn't depend on Cilium.
Below is a quick overview of Tetragon's capabilities and architecture.
Quick Example
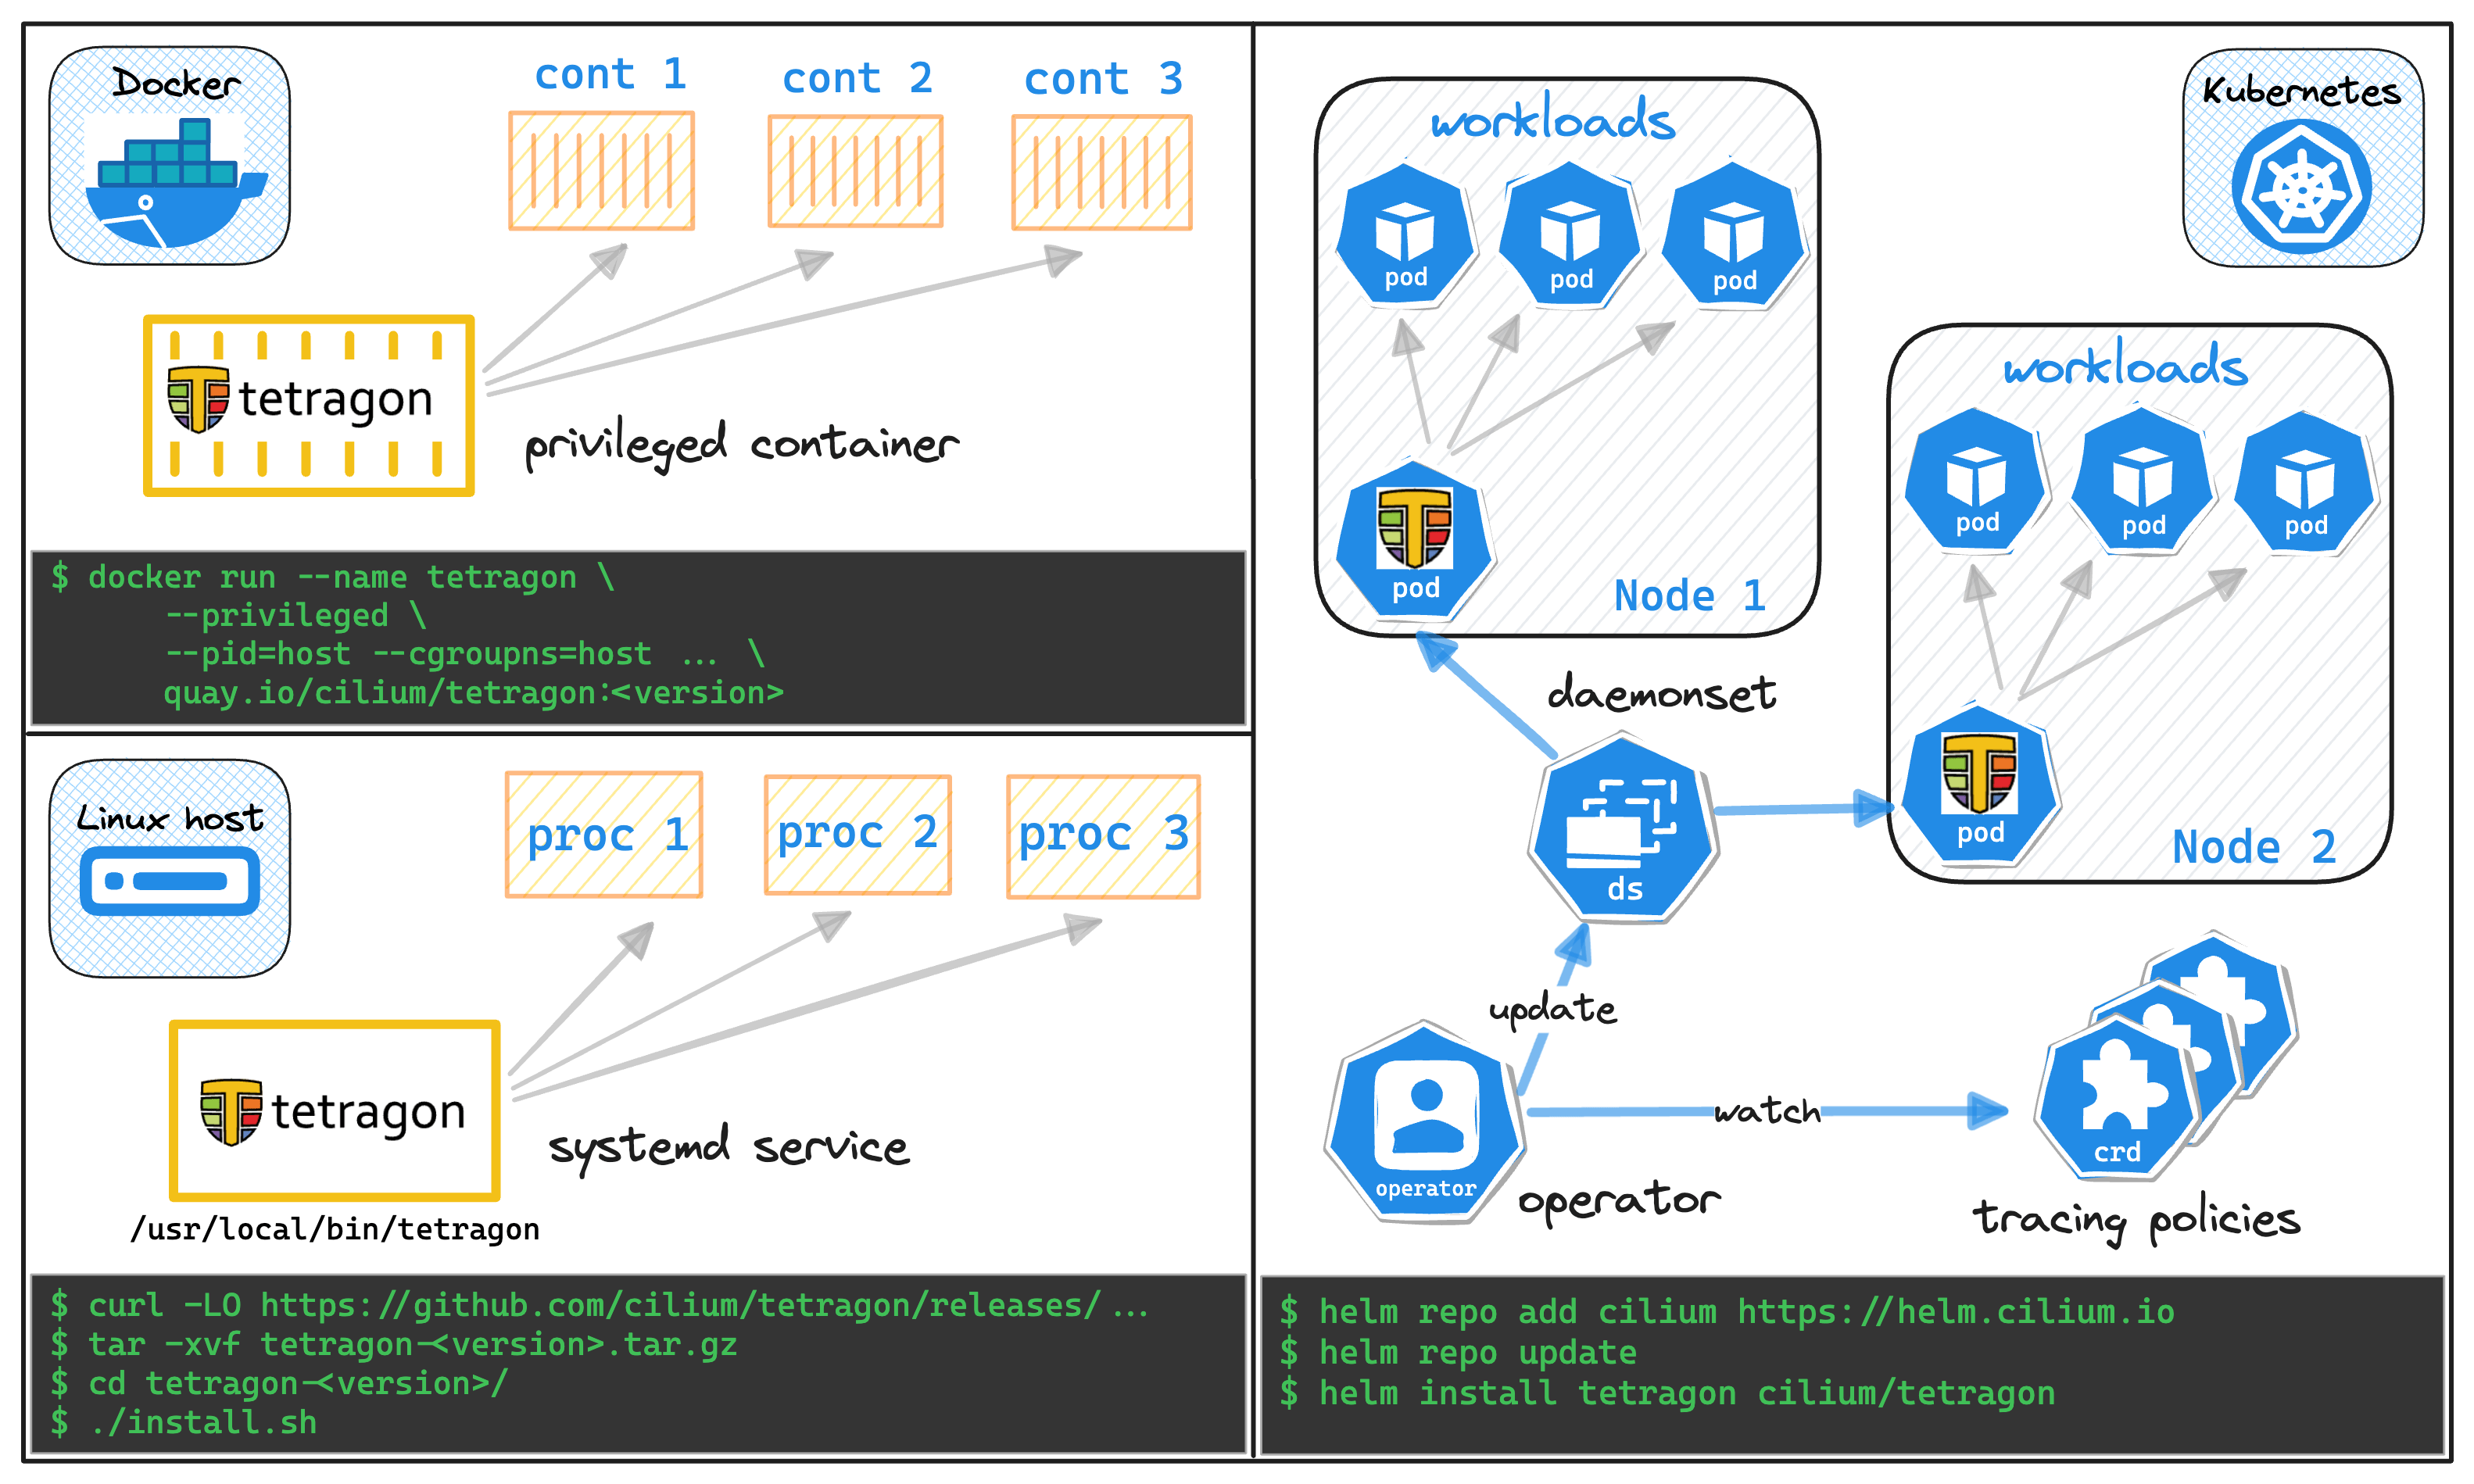
The playground in this tutorial is three-fold - it has a Kubernetes cluster, a Docker host, and a Linux server, all running Tetragon.
To see Tetragon in action, you can simply run the following command in the playground terminal:
On the Kubernetes host:
kubectl exec -ti -n kube-system ds/tetragon -c tetragon -- \
  tetra getevents -o compact
On the Docker host:
docker exec tetragon tetra getevents -o compact
On the Linux host:
sudo tetra getevents -o compact
With vanilla Linux, you may want to put the system at work by running commands in a separate terminal tab. For instance curl -L labs.iximiuz.com.
By default, Tetragon will show only the process execution events:
🚀 process default/nginx /usr/bin/awk  "END { for (name in ENVIRON) { print ( name ~ // ) ? name : "" } }"
💥 exit    default/nginx /usr/bin/awk  "END { for (name in ENVIRON) { print ( name ~ // ) ? name : "" } }" 0
💥 exit    default/nginx /docker-entrypoint.d/20-envsubst-on-templates.sh /docker-entrypoint.d/20-envsubst-on-templates.sh 0
🚀 process default/nginx /docker-entrypoint.d/30-tune-worker-processes.sh /docker-entrypoint.d/30-tune-worker-processes.sh
🚀 process default/nginx /usr/bin/basename /docker-entrypoint.d/30-tune-worker-processes.sh
💥 exit    default/nginx /usr/bin/basename /docker-entrypoint.d/30-tune-worker-processes.sh 0
💥 exit    default/nginx /docker-entrypoint.d/30-tune-worker-processes.sh /docker-entrypoint.d/30-tune-worker-processes.sh 0
🚀 process default/nginx /usr/sbin/nginx -g "daemon off;"
You can make Tetragon track other types of events by providing one or more tracing policies. For instance, to start monitoring the network activity, you can apply the following piece of YAML:
apiVersion: cilium.io/v1alpha1
kind: TracingPolicy
metadata:
  name: "monitor-network"
spec:
  kprobes:               # How to inject (kprobes, tracepoints, uprobes)
  - call: "tcp_connect"  # Where to inject (syscall, kernel function, tracepoint)
    syscall: false
    args:                # Extra data to include in the event
    - index: 0
      type: "sock"
    selectors:
    - matchArgs:         # How to filter events
      - index: 0
        operator: "NotDAddr"
        values:
        - 127.0.0.1
    # matchActions:      # How to react to events (in addition to logging)
    # - action: Sigkill
In Kubernetes, you can apply the above policy using kubectl, and the Tetragon operator will take care of configuring the Tetragon daemons running as Pods:
kubectl apply -f tracing-policy-01.yaml
In Linux, you can add the policy directly using the Tetragon CLI:
sudo tetra tracingpolicy add tracing-policy-01.yaml
In Docker, you'll need to copy the policy file to the Tetragon container first:
docker cp tracing-policy-01.yaml tetragon:/tmp
...but then you can add it using the same command as in Linux:
docker exec tetragon tetra tracingpolicy add /tmp/tracing-policy-01.yaml
After applying the above policy, running curl -L labs.iximiuz.com will produce something like this:
🚀 process  /usr/bin/curl iximiuz.com
🔌 connect  /usr/bin/curl tcp 172.16.0.4:57156 -> 172.67.153.58:80
💥 exit     /usr/bin/curl iximiuz.com 0
Complete Tetragon event structure 🔎
The -o compact option of the tetra getevents command makes Tetragon print the events in a compact and pretty format.
However, in real-world scenarios, you'll probably want to omit it and get the raw JSON output instead:
{
  "process_exec": {
    "process": {
      "exec_id": "OjUzOTU1NDY3NTc4MzU6MTgzMw==",
      "pid": 1833,
      "uid": 0,
      "cwd": "/root",
      "binary": "/usr/bin/mesg",
      "arguments": "n",
      "flags": "execve clone",
      "start_time": "2023-11-14T17:49:10.127803043Z",
      "auid": 0,
      "parent_exec_id": "OjUzOTU0NDg5ODI4MzI6MTgxMw==",
      "tid": 1833
    },
    "parent": {
      "exec_id": "OjUzOTU0NDg5ODI4MzI6MTgxMw==",
      "pid": 1813,
      "uid": 0,
      "cwd": "/root",
      "binary": "/bin/bash",
      "flags": "execve clone",
      "start_time": "2023-11-14T17:49:10.030031531Z",
      "auid": 0,
      "parent_exec_id": "OjUzOTUyODAzMDczMzc6MTgwOQ==",
      "tid": 1813
    }
  },
  "time": "2023-11-14T17:49:10.127802763Z"
}
Tetragon's Architecture
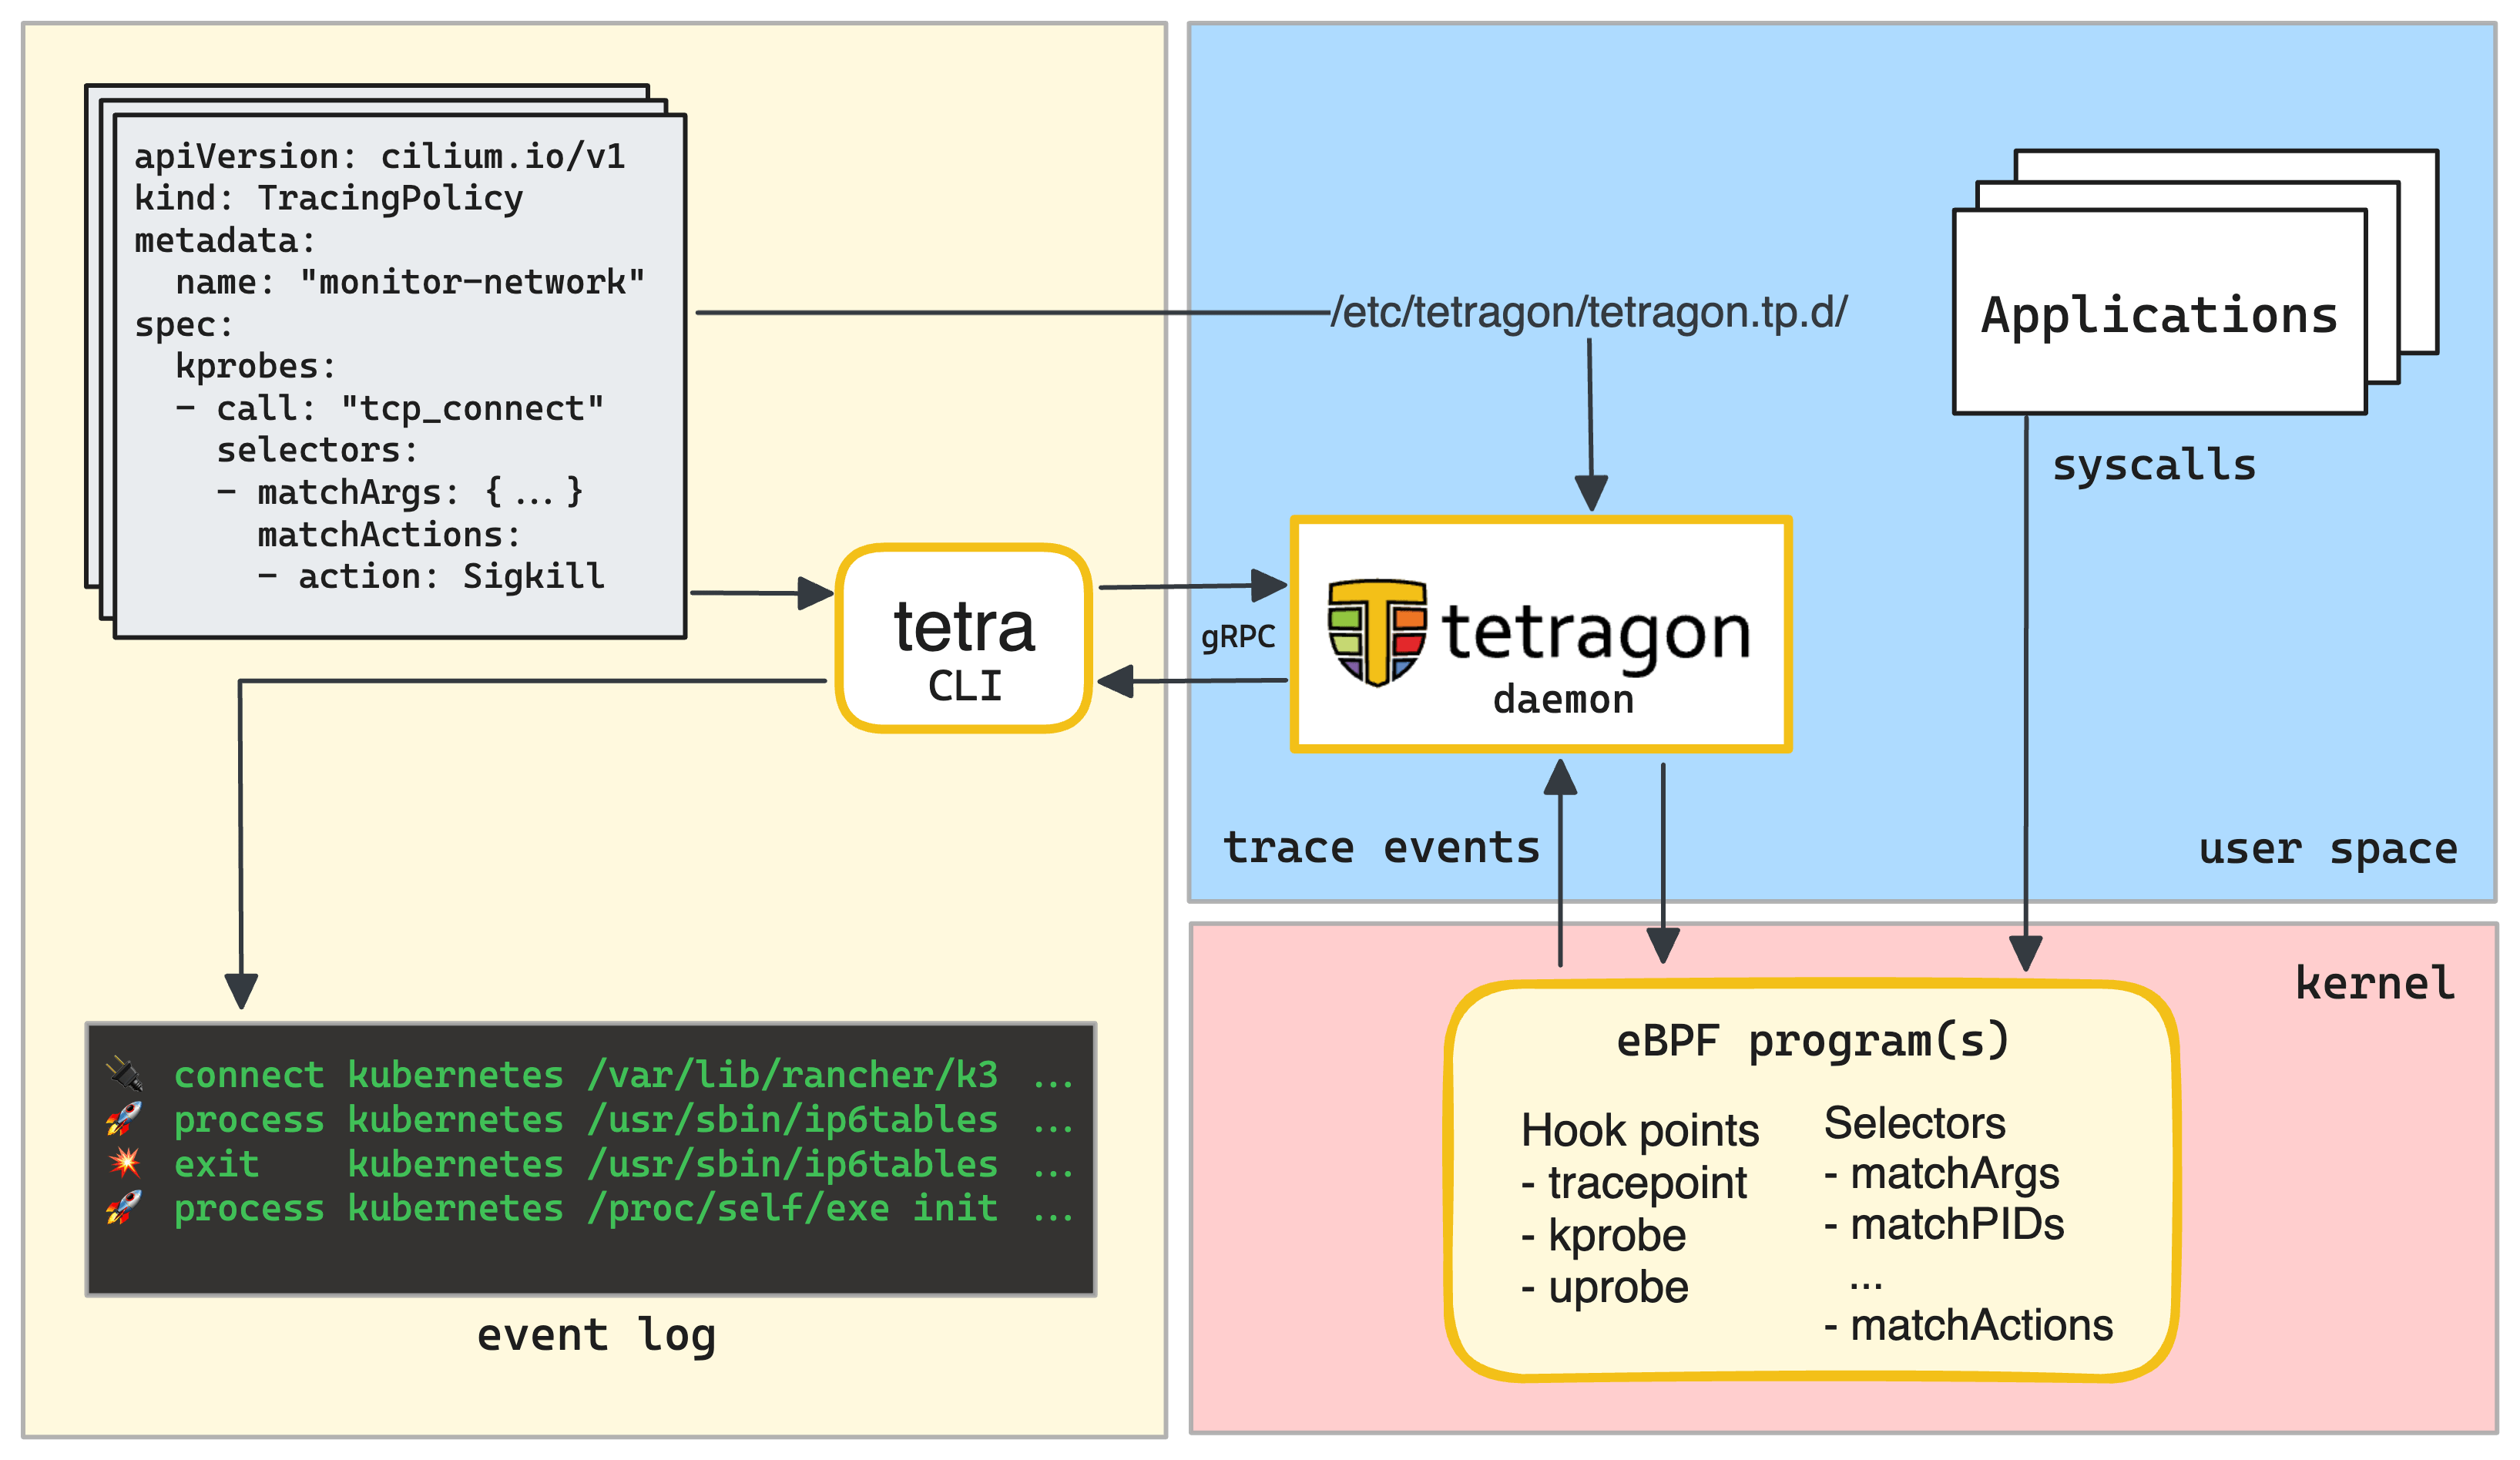
When running on a single server, the Tetragon's architecture is pretty simple:
- The in-kernel eBPF program(s) that track, filter, and react to events.
- The user space managing daemon that provides a gRPC API for interacting with Tetragon.
- The command-line client to configure tracing policies and view tracing events.
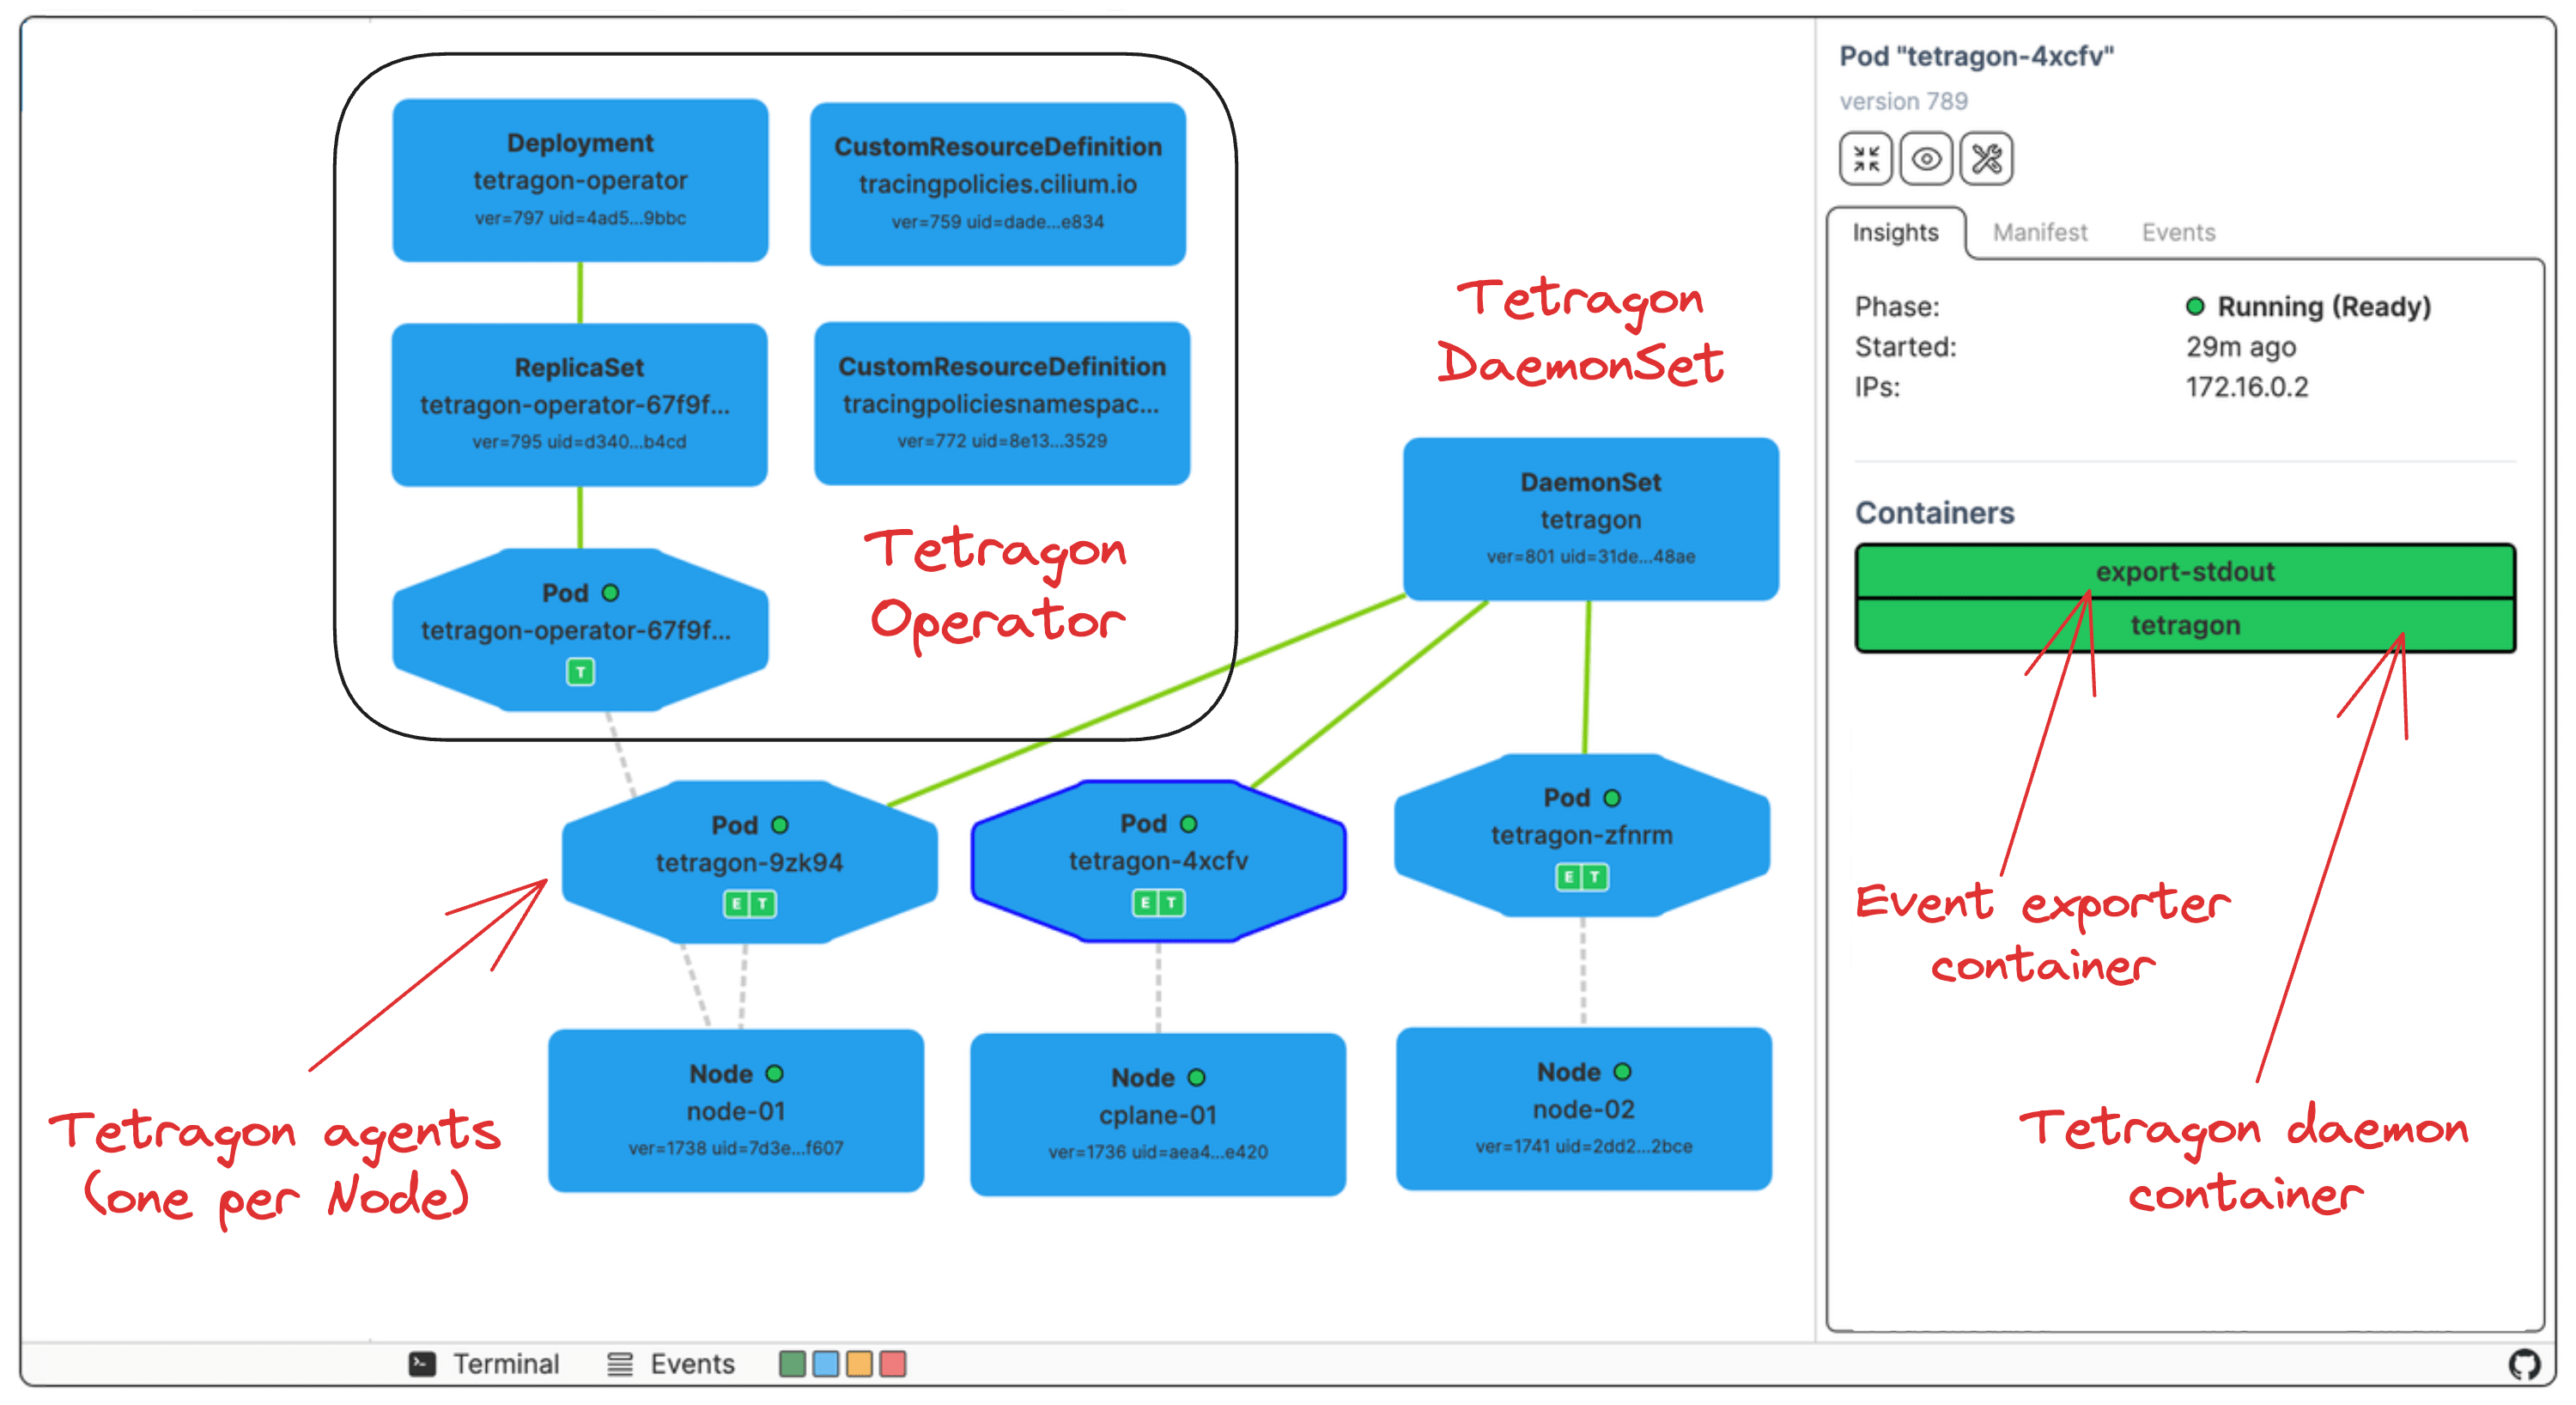
However, when deployed in Kubernetes, Tetragon gets a few additional components:
- The DaemonSet that launches the Tetragon agent Pods on each node.
- The Operator that watches for the
TracingPolicyresources and configures the DaemonSet accordingly. - Additionally, every Tetragon agent Pod runs a sidecar container that dumps the tracing events to its stdout so that off-the-shelf log collectors can pick them up.
Writing Tracing Policies
That's where the actual power and complexity of Tetragon lies. To be able to write tracing policies, you'll need to have a good understanding of the Linux kernel and your runtime (Docker or Kubernetes). But once you get the hang of it, you'll be able to do some pretty cool things because you can trace and react to pretty much anything.
Every Tetragon tracing policy consists of one or more hook points with one or more selectors and possibly a match action.
A hook point is a location Tetragon will trace the event from within the kernel. At the time of writing this post, Tetragon supports:
- kprobes (
cat /proc/kallsyms) - a kernel-version-specific (i.e., not so portable) way to dynamically hook a BPF program into any kernel function or syscall. - tracepoints (
ls /sys/kernel/debug/tracing/events) - similar to kprobes, but more portable and standardized. - uprobes - not much documentation on this one yet (but it's probably coming soon).
To narrow down the events and reduce the overhead, a hook point can use selectors. Selectors allow in-kernel BPF filtering and the ability to take actions on matching events.
The (on-)match actions range from logging the event overriding a return value of a system call to more complex examples, such as socket tracking.
For some inspiration, you can check out the official Observability Policy Library. Most of the examples should be runnable in the playground.
Conclusion
Tetragon is a powerful and easy-to-install tool that can help you detect and react to security-significant events in your infrastructure. However, it's also a pretty low-level tool that requires a good understanding of the Linux kernel and your runtime. Unlike Cilium, Tetragon (at least its OSS version) doesn't have L3-L7 protocol awareness, so its tracing policies cannot be as expressive as Kubernetes network policies. At the same time, Tetragon is a lot more flexible than Cilium, can be used in a wider range of environments, and might be a good choice for a programmable engine if you want to build your own security observability tool.
Further reading
- Getting Started with Tetragon - A really cool hands-on lab that shows how to detect and block a container escape attack with Tetragon.
- Tetragon – eBPF-based Security Observability & Runtime Enforcement - A blog post on the motivation behind Tetragon and its architecture.
- Can I Use Tetragon without Cilium? Yes! - A highly practical blog post on how to use Tetragon in Cilium-free Kubernetes clusters.
- Tetragon GitHub repository.
- Official documentation.
About the Author
Ivan Velichko
Ivan is the creator of iximiuz Labs and a long-time tech blogger and educator with a traditional focus on server-side tech and containers.
Writes about
Frequently covers