Profile and Optimize a Hot-Path Tokenizer in Go
This tutorial is about the process, not the optimization.
The change itself is small - you could read the final diff in a minute. What transfers to the next hot path is everything around it: take a baseline, let a profiler point at the time instead of guessing, change one thing, re-measure with enough samples to trust the difference, and be honest about what the number means.
None of it is invented for the exercise: the lab is a stripped-down copy of code that really runs, and the commit it comes from is linked at the bottom of the page.
Welcome! This tutorial works through a real optimization that was applied to VictoriaTraces, using the same tools you would reach for on your own code.
Let's start with what we are optimizing.
Every span (one timed operation inside a trace - a single HTTP request, database query or function call) that lands in VictoriaTraces gets taken apart before it is stored. Each attribute value - the URL, the pod name, the SQL statement, the user ID - is split into tokens, and those tokens go into bloom filters: small summaries that let a search skip every block of spans that can't contain the words it is looking for, instead of reading them all.
The scanner does not need to understand URLs, SQL, or stack traces. It asks the same yes-or-no question about every byte: is this a letter, digit, or underscore? A run of matching bytes becomes a token; everything else ends one token and starts the search for the next.
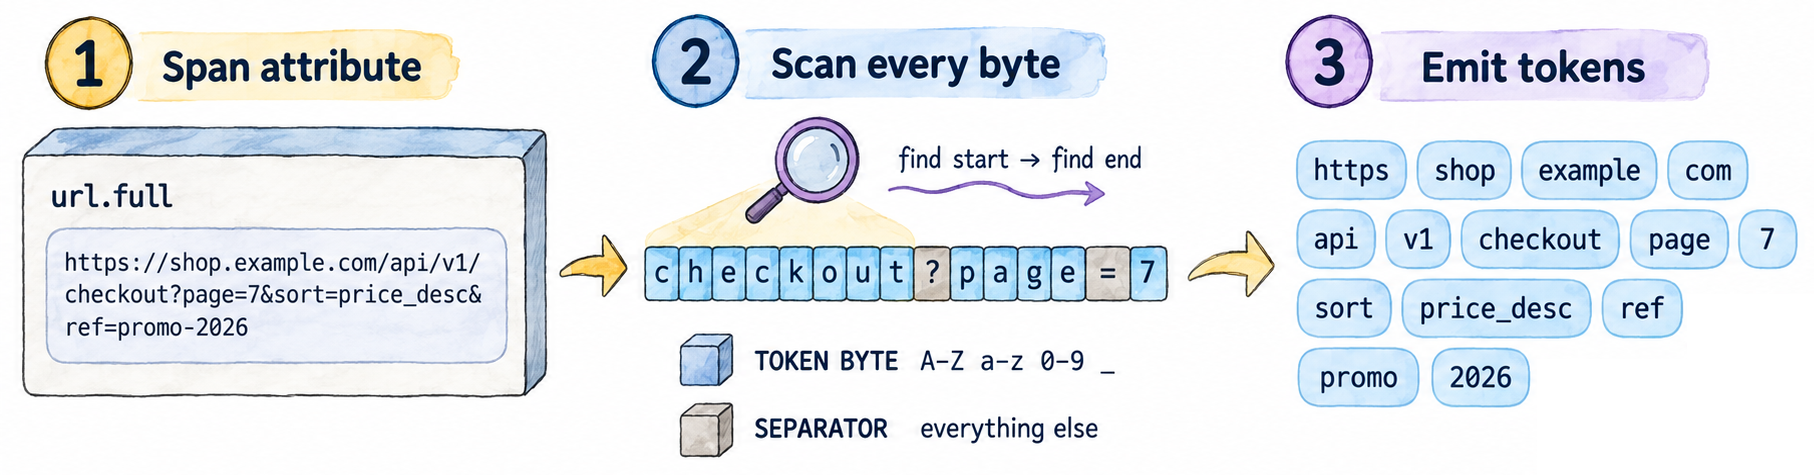
As the diagram shows, the letters in checkout and page stay together while ? and = end a token, and the same rule splits the whole URL into the tokens on the right.
That tiny decision is made for every byte of every indexed attribute.
At a million spans a second, with a dozen attributes each, it runs billions of times a minute, which makes it one of the hottest paths in ingestion.
In this tutorial you will measure that scanner, find out with pprof where its time actually goes, change one thing, and then check what the improvement is worth when the rest of indexing is put back around it.
⚠️ Read this before you start optimizing anything.
This is a micro-optimization, and that is the kind of change you should reach for last. It earns its place only when two things are already true: you have data pointing at this exact code as the bottleneck, and you have asked whether the problem can be solved a level up - by doing the work less often, on less data, or not at all.
Without the measurement you are guessing. Without the higher-level question you may be shaving nanoseconds off work that a different index, cache or data layout would have removed entirely.
First of all, a quick look at the optimization process itself.
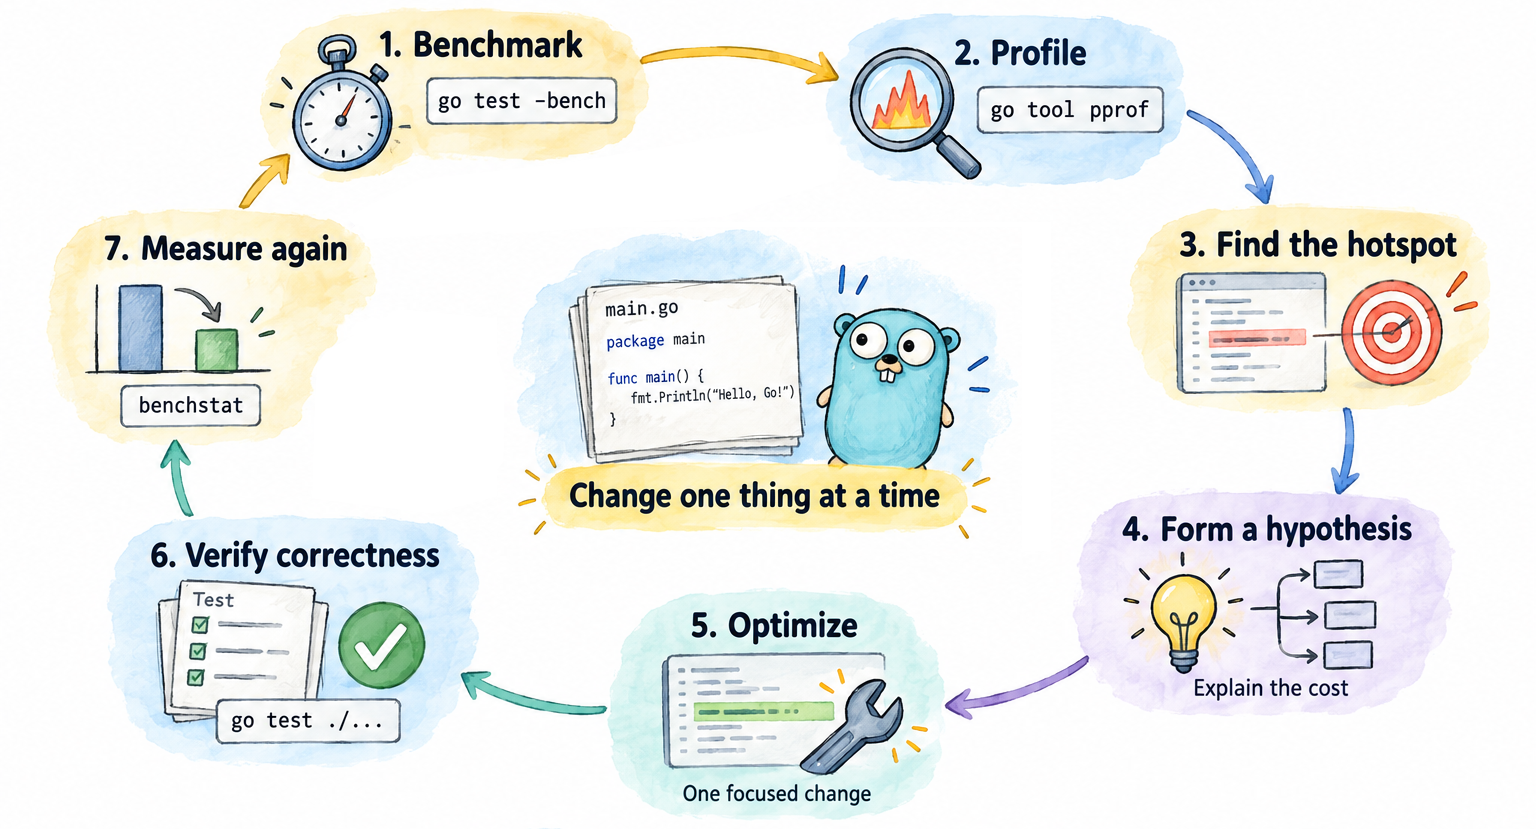
This tutorial walks that loop once. You will benchmark the scanner, profile it down to the individual instructions, make one focused change with the tests holding it honest, then measure again. If there is no real improvement, you start over again rather than re-running until a number looks good.
Now, let's take a look at the code.
The code
We will start with the heart of this tutorial, classify.go:
//go:build !optimized

package spanindex

// isTokenChar reports whether c may be part of a token.
//
// Tokens are what VictoriaTraces stores in its bloom filters: a span attribute
// value is split into tokens, and a search can skip every block of spans whose
// filter doesn't contain its words. Every other byte is a separator.
//
// This is the reference version, so leave it as it is: write your faster one
// in classify_optimized.go and build it with -tags optimized. Only one of the
// two is ever compiled into a given binary.
func isTokenChar(c byte) bool {
    return c >= 'a' && c <= 'z' || c >= 'A' && c <= 'Z' || c >= '0' && c <= '9' || c == '_'
}
As you can see, isTokenChar takes a single byte and answers one question: is this a letter, a digit or an underscore?
Now, what calls isTokenChar?
It is tokenizeString, in tokenizer.go. It walks the bytes, finds where each token starts and ends, and appends every token it has not seen before:
func (t *tokenizer) tokenizeString(dst []string, s string) []string {
    m := t.m
    i := 0
    for i < len(s) {
        // Search for the start of the next token.
        start := len(s)
        for i < len(s) {
            if !isTokenChar(s[i]) {
                i++
                continue
            }
            start = i
            i++
            break
        }
        // Search for the end of the token.
        end := len(s)
        for i < len(s) {
            if isTokenChar(s[i]) {
                i++
                continue
            }
            end = i
            i++
            break
        }
        if end <= start {
            break
        }

        token := s[start:end]
        if _, ok := m[token]; !ok {
            m[token] = struct{}{}
            dst = append(dst, token)
        }
    }
    return dst
}
Two loops do the scanning: the first skips separators until it finds the start of a token, the second runs forward until the token ends. The map at the bottom is the deduplication: every token is looked up first, so a span contributes each distinct token only once, however many attributes it appeared in.
And this is the function that drives it for each span, IndexSpans - the indexing step that ingestion runs:
func IndexSpans(spans []Span, dst []string) []string {
    t := newTokenizer()
    for i := range spans {
        t.reset()
        dst = dst[:0]
        for _, f := range spans[i].Fields {
            dst = t.tokenizeString(dst, f.Value)
        }
    }
    return dst
}
It creates one tokenizer and reuses it for every span.
For each span, it clears the tokenizer's map and empties dst, so deduplication starts fresh, and then feeds every attribute value through tokenizeString.
When the inner loop finishes, dst holds the distinct tokens of that span, ready to be indexed.
Now that we have a clear picture of what the code does, let's see how to measure how fast it does it.
Step 1: establish a baseline
Before changing anything, we need to know how fast the code is now - otherwise there is nothing to compare against.
We'll measure it with a benchmark in bench_test.go, and for it to measure the right thing it needs two pieces: realistic input data, and the scanning logic with nothing else around it.
Let's start with the data:
var corpus = NewCorpus(2000)
NewCorpus, from corpus.go, builds 2000 spans with the attributes of a typical checkout request: service and pod names, HTTP method, URL, user agent, SQL, an error message and a trace ID.
They are generated from a fixed seed, so every run measures the same bytes, and their realistic mix of letters, digits and punctuation keeps the scanner working as hard as it does in production.
Now, the scanning logic.
We could benchmark tokenizeString directly, but its map lookups cost far more than comparing a byte and would blur the cost we want to see.
So bench_test.go has scanTokens, the same two loops with the map replaced by a pair of counters:
func scanTokens(spans []Span) (nTokens, nBytes int) {
    for i := range spans {
        for _, f := range spans[i].Fields {
            s := f.Value
            j := 0
            for j < len(s) {
                // Search for the start of the next token.
                start := len(s)
                for j < len(s) {
                    if !isTokenChar(s[j]) {
                        j++
                        continue
                    }
                    start = j
                    j++
                    break
                }
                // Search for the end of the token.
                end := len(s)
                for j < len(s) {
                    if isTokenChar(s[j]) {
                        j++
                        continue
                    }
                    end = j
                    j++
                    break
                }
                if end <= start {
                    break
                }
                nTokens++
                nBytes += end - start
            }
        }
    }
    return nTokens, nBytes
}
We also want to be sure the code stays correct while we optimize it, so tokenizer_test.go has TestScanTokens, which checks the counts returned by scanTokens against the exact totals for the corpus. Once we change the classifier, it will catch any difference in the tokens found.
Finally, the benchmark itself:
var sinkTokens, sinkBytes int

func BenchmarkScanTokens(b *testing.B) {
    b.SetBytes(corpusBytes(corpus))
    for b.Loop() {
        sinkTokens, sinkBytes = scanTokens(corpus)
    }
}
b.SetBytes adds a throughput figure next to ns/op.
b.Loop() runs the body as many times as needed for the benchmark, timing only the loop.
Let's run it. Start the playground (if you haven't done it yet), and run these commands:
cd /home/laborant/lab
go test -run XXX -bench BenchmarkScanTokens -benchtime 500ms -count 10 | tee baseline.txt
The -benchtime 500ms parameter tells b.Loop() how long to keep going on each run. The default is one second, but a single scan takes only a little over a millisecond, so 500ms already gives us a few hundred iterations - more than enough.
The -count 10 parameter repeats the whole thing ten times. We are on a shared playground, so a single run could be skewed by whatever else the host is doing at that moment. With ten runs, we can see how much the numbers move from one run to the next, and later tell a real improvement apart from that noise.
Step 2: capture a CPU profile
Now we know how long the scanner takes. What we don't know yet is what it is doing for all that time. If we guess, we will often end up optimizing a function that was never the problem - so instead of guessing, let's ask the profiler.
The good news is that you don't need any extra tooling for it: go test accepts a -cpuprofile flag.
While the benchmark runs, it samples the stack about a hundred times a second, and when the run finishes, it writes all those samples into a pprof file.
The more samples, the clearer the picture, so give it enough wall-clock time - a benchmark that runs for a few seconds is plenty.
Write the profile into the lab directory as cpu.prof.
What -cpuprofile leaves behind, and why you want it
go test -cpuprofile also leaves the compiled test binary, spanindex.test, in the current directory.
-top and -list don't need it, but -disasm, which we'll use in the next steps to look at the actual instructions, reads them from the binary.
Hint: which parameters
Start from the command you used in Step 1 and change two things: -benchtime 3s, so each run lasts long enough to collect plenty of samples, and -cpuprofile cpu.prof, to write the profile.
Hint: the exact command
The Step 1 command, with -benchtime 3s and -cpuprofile cpu.prof:
cd /home/laborant/lab
go test -run XXX -bench BenchmarkScanTokens -benchtime 3s -count 10 -cpuprofile cpu.prof
The | tee baseline.txt is gone on purpose: keeping it would overwrite your baseline.
Step 3: read the profile
With the profile in hand, let's see what it has to say. Start with the overview:
go tool pprof -top -nodecount=10 cpu.prof
Before you read the output, there are two columns worth understanding, because they mean different things.
cum (short for cumulative) is the time spent in a function and everything it called. It tells you which subtree is expensive.
flat is the time spent in a function's own instructions. It tells you which code you would actually have to change.
That is why a function in the call tree can have a huge cum and a flat of nearly zero: it tells you where to look, but it is not the code you would change.
There is one more detail, specific to Go, that you should know before you look: the profiler is inlining-aware.
When the compiler inlines a small function into its caller, the samples are still attributed to that function and reported on their own line, marked (inline).
So a three-line predicate that got inlined does not disappear from the profile - which is precisely what you need here.
Now, have a look at the output and find where the work is actually done:
Hint: the profile looks like it only has one function in it
The scanning benchmark is one loop calling one predicate, so -top is short - two lines carry almost all the flat samples, and the rest are runtime noise or call-tree signposts with a flat of (nearly) zero.
That is fine. Look past scanTokens at what else carries flat samples, and remember that an inlined function is still listed.
What the profile is telling you
Let's go through it together. This is how it looks for me, and your results should be very similar:
      flat  flat%   sum%        cum   cum%
     1.88s 59.12% 59.12%      1.90s 59.75%  spanindex.isTokenChar (inline)
     1.28s 40.25% 99.37%      3.18s   100%  spanindex.scanTokens
Almost sixty percent of it is spent inside a function whose entire body is one line of comparisons. That is a surprising result, because comparing a byte is one of the cheapest things a CPU does.
So isTokenChar is where the time goes. But why would such a tiny function be so expensive?
Let's zoom in. go tool pprof -list '<function-name>' shows where inside the loop the time lands:
go tool pprof -list 'scanTokens' cpu.prof
     500ms      500ms     34:               for j < len(s) {
     250ms      1.72s     35:                   if isTokenChar(s[j]) {
More than half of the benchmark's cumulative time sits on a single line: the one that scans forward through a token.
That tells us where, but still not why.
Luckily, pprof lets us dig even deeper, all the way down to the assembly, with go tool pprof -disasm '<function-name>'.
You rarely need to go this far, but in this specific case it is exactly what explains the numbers:
go tool pprof -disasm 'scanTokens' spanindex.test cpu.prof
     220ms      220ms     5482af: MOVZX 0(R8)(R12*1), R13   ;spanindex.scanTokens bench_test.go:35
     600ms      600ms     5482b4: LEAL -0x61(R13), R15      ;spanindex.scanTokens classify.go:15
         .          .     5482b8: CMPL R15, $0x19           ;classify.go:15
     440ms      460ms     5482bc: JBE 0x5482a5              ;spanindex.scanTokens classify.go:15
         .          .     5482be: LEAL -0x41(R13), R15      ;classify.go:15
     140ms      140ms     5482c2: CMPL R15, $0x19           ;spanindex.scanTokens classify.go:15
     180ms      180ms     5482c6: JBE 0x5482a5
         .          .     5482c8: LEAL -0x30(R13), R15      ;classify.go:15
         .          .     5482cc: CMPL R15, $0x9
      90ms       90ms     5482d0: JBE 0x5482a5              ;spanindex.scanTokens classify.go:15
         .          .     5482d2: CMPL R13, $0x5f           ;classify.go:15
      30ms       30ms     5482d6: JE 0x5482a5               ;spanindex.scanTokens bench_test.go:35
Don't worry if this looks intimidating: you don't need to know assembly for this tutorial.
What matters is what it tells us about our Go code, so let's go back to isTokenChar:
return c >= 'a' && c <= 'z' || c >= 'A' && c <= 'Z' || c >= '0' && c <= '9' || c == '_'
In Go, && and || short-circuit: the right side is only evaluated if the left side hasn't already decided the result.
If c is a lowercase letter, there is no point in checking the other ranges, so the code stops right there.
To make that possible, the compiler turns each condition into a branch: an instruction that jumps to a different place in the code depending on a comparison.
Those are the JBE and JE lines in the listing - four of them, one per range, for every byte we scan.
Why do branches hurt? A modern CPU works on many instructions at once, in a pipeline, so when it reaches a branch it doesn't wait to see which way it goes - it guesses and keeps working. That is the job of the branch predictor. A right guess makes the branch almost free. A wrong one throws away all the work done on the wrong path, and the pipeline starts over.
And these branches are very hard to guess: the input is a URL, then a user agent, then SQL - letters, digits, slashes, equals signs, quotes, spaces, in no pattern the predictor can learn. Every wrong guess costs a dozen-plus cycles, and with several chances to guess wrong on every byte of half a megabyte of input, it adds up to the almost 60% you are looking at.
Step 4: make it faster
Now we know the function, the instruction pattern, and why that pattern is expensive. Time to do something about it.
First, install benchstat, which we'll use to compare the results. It takes the ten runs from each file and tells us whether the difference between them is bigger than the run-to-run noise. It is not preinstalled:
go install golang.org/x/perf/cmd/benchstat@latest
It lands in ~/go/bin, which is already on your PATH.
Next, where to write your version.
classify.go is our reference - it's what the baseline was measured against - so we won't touch it. Instead, the lab has a file just for you, classify_optimized.go:
//go:build optimized

// This file holds your optimized version of isTokenChar, compiled in instead
// of classify.go when you build with -tags optimized. It starts as a copy of
// the reference; change anything in this file you need to make it faster.
//
// It must give exactly the same answer as the reference in classify.go for
// all 256 byte values - TestIsTokenChar checks every one of them.

package spanindex

// isTokenChar reports whether c may be part of a token.
func isTokenChar(c byte) bool {
    return c >= 'a' && c <= 'z' || c >= 'A' && c <= 'Z' || c >= '0' && c <= '9' || c == '_'
}
It starts as an exact copy of the original, behind the optimized build tag, and it's all yours: change anything in it you need.
When you build with -tags optimized, this file is compiled in and classify.go is left out (that's what the !optimized in its build line does), so you can switch between the reference and your version with a single flag.
Your version has two rules to follow:
- The answers must not change.
TestIsTokenCharchecks all 256 byte values against the reference definition, andTestScanTokenspins the exact token and byte counts we saw in Step 1. A faster classifier that gets a single byte wrong would produce different tokens, and searches would start missing spans they should find. - It has to be measurably faster, by more than the playground's noise floor. The check asks for at least 8%.
Before changing anything, let's do one full iteration with the file as it is, so you get familiar with the loop.
First, run the tests with the tag, to make sure your version is correct:
go test -tags optimized ./...
Then measure it exactly the way you measured the baseline - same benchmark, same -benchtime and -count, just with the tag - and save it as optimized.txt:
go test -tags optimized -run XXX -bench BenchmarkScanTokens -benchtime 500ms -count 10 | tee optimized.txt
And finally, put the two side by side:
benchstat baseline.txt optimized.txt
benchstat reports the change together with a p-value (the probability of seeing a difference this big from noise alone - the lower, the more you can trust it). If it shows ~, read it as "no difference was demonstrated", however encouraging the raw numbers look.
Since classify_optimized.go is still identical to the original, expect ~ here, or at most a difference of a percent or two from the playground's noise.
Now, go ahead and make your changes to classify_optimized.go, and repeat these steps: test, measure, compare.
If the improvement isn't there, or it's smaller than you hoped, that's normal - try another idea and run the loop again.
tee overwrites optimized.txt every time, so the comparison always reflects your latest attempt.
If you get stuck, the hints below get closer to the answer one step at a time.
Hint 1
The problem is not the arithmetic - the compiler already reduced each range test to one subtract and one compare. The problem is that there are branches at all, and that nothing can predict them.
So ask a different question: how do you answer a yes/no question about a byte without branching on it?
Hint 2
A byte has 256 possible values. All of them are known before the program starts.
Anything a function computes from a small, fixed domain can be computed once, ahead of time, and looked up afterwards. Go will run a package-level initializer for you at startup.
Hint 3
When a byte indexes an array of exactly 256 entries, the compiler can prove the index is in range and emits no bounds check at all. Both parts of that sentence matter: the length is not an arbitrary choice, and neither is the type of the index.
Solution
Branches are the cost, so remove the branches.
A byte only has 256 possible values, so we can compute the answer for all of them once, when the package loads, and turn every call into a single lookup:
//go:build optimized

package spanindex

var tokenCharTable = func() *[256]byte {
    var a [256]byte
    for c := range uint(256) {
        if c >= 'a' && c <= 'z' || c >= 'A' && c <= 'Z' || c >= '0' && c <= '9' || c == '_' {
            a[c] = 1
        }
    }
    return &a
}()

// isTokenChar reports whether c may be part of a token.
func isTokenChar(c byte) bool {
    return tokenCharTable[c] != 0
}
The same comparison chain is still there, but it now runs 256 times at startup instead of once per scanned byte.
At runtime, isTokenChar is one load and one test, with no data-dependent branch left inside it.
The array is exactly 256 entries and the index is a byte, so the compiler can prove the index is always in range and emits no bounds check. A [257]byte, or an int index, would bring back a compare and a branch - the very thing we came to remove.
[256]bool works just as well, if you find it clearer.
Step 5: what is it worth?
The scanner is faster. But remember that scanTokens is only a harness: we took the deduplication out on purpose, so we could look at the scan on its own.
What ingestion really runs is IndexSpans, map and all. So the question that actually matters is: how much of the improvement survives once we put the rest of the work back?
That is what BenchmarkIndexSpans, the other benchmark in bench_test.go, measures:
func BenchmarkIndexSpans(b *testing.B) {
    dst := make([]string, 0, 256)
    b.SetBytes(corpusBytes(corpus))
    b.ReportAllocs()
    for b.Loop() {
        dst = IndexSpans(corpus, dst)
    }
}
It follows the same pattern as BenchmarkScanTokens, over the same corpus.
The one addition is b.ReportAllocs(): unlike scanTokens, this code works with a map and a slice, so the output also reports how much memory each iteration allocates.
Let's start with the profile. Capture it just like in Step 2, pointing at the other benchmark and writing to a new file, so your first profile stays intact:
go test -run XXX -bench BenchmarkIndexSpans -benchtime 3s -cpuprofile idx.prof
go tool pprof -top -nodecount=10 idx.prof
Look at what the top of the profile is made of this time: string hashing (memHashAES) and the map machinery (matchH2, mapaccess2_faststr, mapassign_faststr), with tokenizeString's own work in between.
Now find isTokenChar in the list, and compare its share with the one it had in Step 3.
Next, let's measure. It's the same before/after as in Step 4: one run without tags for the reference, and one with -tags optimized for your version.
Save them to new files, so you don't overwrite the scanner results from Steps 1 and 4:
go test -run XXX -bench BenchmarkIndexSpans -benchtime 500ms -count 10 | tee idx_base.txt
go test -tags optimized -run XXX -bench BenchmarkIndexSpans -benchtime 500ms -count 10 | tee idx_opt.txt
And compare them:
benchstat idx_base.txt idx_opt.txt
This time benchstat prints four tables instead of two, because of b.ReportAllocs(): time per operation (sec/op) and throughput (B/s) like before, plus memory (B/op) and allocations (allocs/op) per operation.
The last two should show ~ with "all samples are equal": the lookup table doesn't change what the code allocates, only how fast it decides what a token is.
The number to look at is the sec/op change. Put it next to the one you got for BenchmarkScanTokens in Step 4:
Hint: how to compare the two
Compare the sec/op change from benchstat idx_base.txt idx_opt.txt with the one from benchstat baseline.txt optimized.txt in Step 4.
You do not need the exact percentage to answer; you need to know which direction it moves, and the profile of IndexSpans will tell you that before you run anything.
Conclusions
So, what did we get?
Two numbers: a big improvement on the isolated scanner, and a noticeably smaller one on the full indexing step.
On this playground, that's about 34% on BenchmarkScanTokens and about 10% on BenchmarkIndexSpans.
The exact percentages depend on the machine you run on, but the scanner gain is always the bigger of the two. Both numbers are true, but the second one is the one to quote: in production, the scanner never runs on its own, so the indexing number is closer to what users will actually notice.
And that is the real takeaway: before keeping an optimization, understand its real impact and its real cost - usually readability - and make sure you are applying it at the right level. And always back that decision with data, not intuition.
This is a real optimization, not a constructed one.
It landed in VictoriaLogs - which VictoriaTraces builds on - as commit ee940e81, "improve performance for isTokenChar() by using 256-byte lookup table", reporting up to 30% on the predicate. The idea came in from a community contributor.
You can read the version that runs in production in lib/logstorage/tokenizer.go, where the same table also backs isTokenRune for the ASCII fast path.
About the Author

Jesús Espino
Jesús Espino is an Open-Source and software development enthusiast. He loves writing code and contributing to Open-Source projects. Jesús also had the privilege of being one of the starters or contributors in some interesting Open-Source projects like Taiga, Penpot, Mattermost, Focalboard, or testcontainers-go. He is a big fan of learning new things, especially programming languages. He loves Rust, Go, Python, Clojure, Git, Postgres, and Vim, and he loves to dive deep into technical details. Currently, he is working mainly in Go and Typescript as a Principal Engineer at Ona, and he contributes to Open-Source projects whenever he can.
More tutorials you might like
How Servers Work: A Hands-On Introduction to TCP Sockets
Learn how servers actually work by building a tiny TCP server and client from scratch. A hands-on introduction to sockets, TCP, and the network programming model every backend, DevOps, and platform engineer should go through at least once.

Getting Started with VictoriaMetrics on Kubernetes
Deploy VictoriaMetrics on Kubernetes using the VM Operator, configure metrics scraping with CRDs, and query cluster metrics.

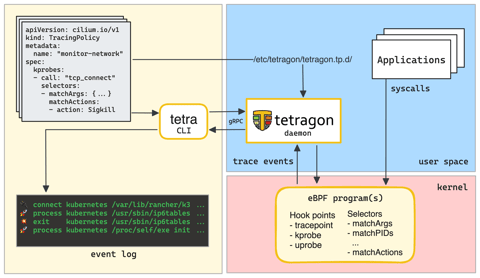
Exploring Tetragon - A Security Observability Tool for Kubernetes, Docker, and Linux
What is Tetragon, how it works, and how to use it to detect and react to security-significant events in your Kubernetes, Docker, or plain Linux environment.
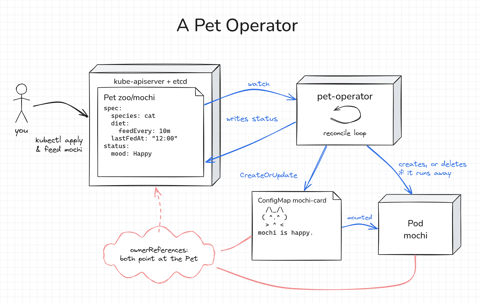
How Kubernetes Operators Work: Building a Controller From Scratch
Build a Kubernetes operator for a small Pet API, first as a 15-line bash loop and then as a Go controller with controller-runtime. Every Pet gets a Pod to live in, gets hungry as time passes, and runs away if nobody feeds it. Along the way, you'll see how the reconcile loop works.

Learn by doing, not just by reading or watching
Sign up for a free account to start a VM playground right on this page, track your progress, and get notified about new learning materials.