Quick Start - PostgreSQL 17 Performance Analysis with pgBadger

👋 Welcome!
This is a quick and simple tutorial to get started with PostgreSQL 17 performance monitoring using pgBadger.
What You'll Do:
- ⚡ Install PostgreSQL 17
- ⚙️ Configure logging
- 🔨 Generate database load with pgbench (SELECT, UPDATE, INSERT, DELETE)
- 📊 Analyze performance with pgBadger
Time: 15-20 minutes
Let's go! 🚀
📦 Step 1: Install PostgreSQL 17
First, let's install PostgreSQL 17 on Ubuntu:
# Become root
sudo su -

# Add PostgreSQL repository
apt update
apt install -y wget gnupg2
wget --quiet -O - https://www.postgresql.org/media/keys/ACCC4CF8.asc | apt-key add -
echo "deb http://apt.postgresql.org/pub/repos/apt $(lsb_release -cs)-pgdg main" > /etc/apt/sources.list.d/pgdg.list

# Install PostgreSQL 17
apt update
apt install -y postgresql-17

# Verify installation
psql --version
Expected: psql (PostgreSQL) 17.x
✅ Step 2: Verify Cluster is Running
PostgreSQL automatically creates a cluster during installation. Let's verify:
# Switch to the postgres user
su - postgres

# Start the Cluster
pg_ctlcluster start 17 main

# Check cluster status
pg_lsclusters

# Test connection
psql -c "SELECT version();"

# Check what port it's using
psql -c "SHOW port;"
Expected output:
Ver Cluster Port Status Owner
17  main    5432 online postgres
⚙️ Step 3: Configure Logging for pgBadger
Now let's enable detailed logging so pgBadger can analyze the database activity:
# Navigate to the configuration directory
cd /etc/postgresql/17/main
ls -l

# Backup original config
cp postgresql.conf postgresql.conf.backup

# Open the configuration file using vi editor
vi /etc/postgresql/17/main/postgresql.conf
Scroll to the bottom of the file and add these lines:
If using vi: Press Shift+G to go to the end, then press o to insert:
# === pgBadger Logging Configuration ===
log_destination = 'csvlog'
logging_collector = on
log_directory = 'log'
log_filename = 'postgresql-%a'
log_rotation_age = 1d
log_line_prefix = '%t:%r:%u@%d:[%p]:'
log_checkpoints = on
log_connections = on
log_disconnections = on
log_duration = on
log_lock_waits = on
log_statement = 'all'
log_temp_files = 0
log_min_duration_statement = 1000
Save and exit:
- vi: Press
Esc, then type:wqand pressEnter
# As postgres user
exit
whoami

# Restart PostgreSQL to apply changes
pg_ctlcluster restart 17 main

# Verify if logging is now enabled
su - postgres
psql -c "SHOW log_destination;"
psql -c "SHOW log_statement;"

# Check log directory exists
ls -la /var/lib/postgresql/17/main/log/
Expected: log_destination shows csvlog and log_statement shows all
What we just configured:
- ✅ CSV log format (easy for pgBadger to parse)
- ✅ Log ALL SQL statements
- ✅ Log connections and disconnections
- ✅ Log query duration
- ✅ Daily log rotation
Log location: /var/lib/postgresql/17/main/log/
🔨 Step 4: Generate Database Load with pgbench
Now let's create a test database and generate different types of database activity!
Initialize pgbench Database
# Switch to postgres user
sudo su - postgres

# Create and initialize pgbench database
createdb pgbench

# Initialize with scale factor 10 (~1 million rows)
pgbench -i -s 10 pgbench

# Verify tables were created
psql -d pgbench -c "\dt"

# Check table sizes
psql -d pgbench -c "SELECT schemaname, tablename, pg_size_pretty(pg_total_relation_size(schemaname||'.'||tablename)) AS size FROM pg_tables WHERE schemaname = 'public' ORDER BY pg_total_relation_size(schemaname||'.'||tablename) DESC;"
Expected: You'll see tables like pgbench_accounts, pgbench_branches, pgbench_tellers, pgbench_history
What is pgbench?
pgbench is PostgreSQL's built-in benchmarking tool. It creates sample tables and runs transactions to simulate real database load.
Tables created:
pgbench_accounts- ~1,000,000 rows (main table)pgbench_branches- 10 rowspgbench_tellers- 100 rowspgbench_history- transaction history
🚀 Step 5: Generate Mixed Workload (SELECT, UPDATE, INSERT, DELETE)
Let's run different types of queries to generate realistic database activity.
Workload 1: Default TPC-B (UPDATE, SELECT, INSERT)
# Run 30 seconds of default pgbench transactions
# This includes: UPDATE, SELECT, and INSERT (as Postgres user)
pgbench -c 10 -j 2 -T 30 pgbench
-c 10: 10 concurrent clients-j 2: 2 worker threads-T 30: Run for 30 seconds
You'll see output like:
transaction type: <builtin: TPC-B (sort of)>
scaling factor: 10
number of clients: 10
number of threads: 2
duration: 30 s
number of transactions actually processed: 12345
tps = 411.234567 (including connections establishing)
Workload 2: SELECT-only Queries
# Run SELECT-only workload
pgbench -c 10 -j 2 -T 20 -S pgbench
The -S flag makes pgbench run SELECT-only queries.
Workload 3: Custom Script with DELETE Operations
Let's create a custom script that includes DELETE operations:
# Create custom pgbench script with DELETE
vi /tmp/pgbench_delete.sql

# Add below content in the file
\set aid random(1, 100000 * :scale)
BEGIN;
DELETE FROM pgbench_history WHERE aid = :aid;
INSERT INTO pgbench_history (tid, bid, aid, delta, mtime) VALUES (:aid % 100 + 1, :aid % 10 + 1, :aid, 100, CURRENT_TIMESTAMP);
SELECT abalance FROM pgbench_accounts WHERE aid = :aid;
UPDATE pgbench_accounts SET abalance = abalance + 100 WHERE aid = :aid;
END;

# Save the file :wq

# Run custom script with DELETE operations
pgbench -c 5 -j 2 -T 20 -f /tmp/pgbench_delete.sql pgbench
Workload 4: Heavy UPDATE Load
# Create script with multiple UPDATEs
vi /tmp/pgbench_updates.sql
\set aid random(1, 100000 * :scale)
\set bid random(1, 10 * :scale)
\set tid random(1, 100 * :scale)
BEGIN;
UPDATE pgbench_accounts SET abalance = abalance + 100 WHERE aid = :aid;
UPDATE pgbench_tellers SET tbalance = tbalance + 100 WHERE tid = :tid;
UPDATE pgbench_branches SET bbalance = bbalance + 100 WHERE bid = :bid;
SELECT abalance FROM pgbench_accounts WHERE aid = :aid;
END;

# Save the file (:wq)

# Run update-heavy workload
pgbench -c 10 -j 2 -T 20 -f /tmp/pgbench_updates.sql pgbench
✅ What You Just Generated:
The pgbench runs created logs with:
- 📊 SELECT queries (reading data)
- ✏️ UPDATE queries (modifying data)
- ➕ INSERT queries (adding new data)
- ❌ DELETE queries (removing data)
- 🔄 Transactions (multiple queries together)
- 🔗 Connections (client connections)
All of this activity is now logged in CSV format and ready for analysis!
📥 Step 6: Install pgBadger
Now let's install pgBadger to analyze the logs:
# Switch to root
exit
OR
sudo su -

# Install dependencies
apt install -y wget unzip perl

# Download pgBadger
cd /tmp
wget https://github.com/darold/pgbadger/archive/refs/heads/master.zip

# Extract
unzip master.zip

# Install system-wide
cp pgbadger-master/pgbadger /usr/local/bin/
chmod +x /usr/local/bin/pgbadger

# Verify installation
pgbadger --version
Expected: pgBadger version 12.x
📊 Step 7: Generate Performance Report
Time to analyze! Let's use pgBadger to create a beautiful HTML report from our logs.
Find and Analyze the Logs
# Find today's log file
TODAY=$(date +%a)
LOG_FILE="/var/lib/postgresql/17/main/log/postgresql-${TODAY}.csv"

echo "Analyzing log file: $LOG_FILE"

# Check log file size
ls -lh "$LOG_FILE"

# Generate pgBadger report
pgbadger \
  -p '%t:%r:%u@%d:[%p]:' \
  "$LOG_FILE" \
  -o /tmp/pgbadger_report.html

# Check report was created
ls -lh /tmp/pgbadger_report.html
You'll see output like:
[========================>] Parsed 123456 bytes of 123456 (100.00%)
queries: 12345, events: 123
LOG: Ok, generating HTML report...
View the Report
# Show report location
echo "Report location: /tmp/pgbadger_report.html"

# Show report size
du -h /tmp/pgbadger_report.html

# Quick preview of report stats
echo -e "\n=== Report Generated ==="
echo "You can download and open this file in your browser!"
echo "File: /tmp/pgbadger_report.html"
🎉 Success! Your report is ready!
The HTML report contains:
- 📈 Overview: Total queries, connections, duration
- ⚡ Performance graphs: Queries over time
- 🐌 Slowest queries: Which queries took the longest
- 🔄 Most frequent queries: Which queries ran most often
- 📊 Query types: Breakdown of SELECT, UPDATE, INSERT, DELETE
- ⚠️ Errors and warnings: Any issues detected
- 🔗 Connection statistics: Client connections
To view:
- Download
/tmp/pgbadger_report.htmlto your computer - Open it in any web browser
- Explore the interactive charts and statistics!
📖 Understanding Your Report
When you open the HTML report, here's what to look for:
Key Sections
1. Overall Stats (Top of Page)
Queries: 12,345
Connections: 150
Duration: 2.5 hours
Queries/sec: 1.37
2. Queries by Type
- See breakdown of SELECT vs UPDATE vs INSERT vs DELETE
- Identifies which operations are most common
3. Top 10 Slowest Queries
- Shows queries that took the longest time
- Good candidates for optimization
4. Top 10 Most Frequent Queries
- Shows which queries ran most often
- Important for overall performance
5. Performance Graphs
- Queries per second over time
- Connection activity
- Query duration distribution
What to Look For
Good Performance:
- ✅ Most queries < 10ms
- ✅ No queries > 1 second
- ✅ Steady query rate
Needs Attention:
- ⚠️ Queries taking > 100ms
- ⚠️ Sudden spikes in query time
- ⚠️ High number of temp files
🎯 Quick Reference
PostgreSQL Commands
# Check cluster status
pg_lsclusters

# Connect to database
sudo -u postgres psql

# Connect to specific database
sudo -u postgres psql -d pgbench

# List databases
sudo -u postgres psql -l

# Show tables
sudo -u postgres psql -d pgbench -c "\dt"
pgbench Commands
# Initialize database
sudo -u postgres pgbench -i -s 10 pgbench

# Default benchmark (30 seconds)
sudo -u postgres pgbench -c 10 -j 2 -T 30 pgbench

# SELECT-only benchmark
sudo -u postgres pgbench -c 10 -j 2 -T 30 -S pgbench

# Custom script
sudo -u postgres pgbench -c 10 -T 30 -f script.sql pgbench
pgBadger Commands
# Generate report from log file
pgbadger -p '%t:%r:%u@%d:[%p]:' logfile.csv -o report.html

# Generate report from all logs
pgbadger -p '%t:%r:%u@%d:[%p]:' /var/lib/postgresql/17/main/log/*.csv -o report.html

# Generate incremental report (for daily monitoring)
pgbadger -I -p '%t:%r:%u@%d:[%p]:' logfile.csv -o reports/index.html
Log Locations
# PostgreSQL logs
/var/lib/postgresql/17/main/log/

# Today's log
/var/lib/postgresql/17/main/log/postgresql-$(date +%a).csv

# Configuration
/etc/postgresql/17/main/postgresql.conf
🎉 Congratulations!
You've completed the quick start tutorial!
What You Accomplished:
✅ Installed PostgreSQL 17 on Ubuntu
✅ Configured comprehensive logging
✅ Generated realistic database load with pgbench
✅ Created SELECT, UPDATE, INSERT, and DELETE queries
✅ Installed and used pgBadger
✅ Generated a performance analysis report
What You Learned:
- How to set up PostgreSQL for monitoring
- How to generate different types of database load
- How to analyze query performance
- How to identify slow queries
- How to read performance reports
Next Steps:
For More Practice:
- Run longer pgbench tests (5-10 minutes)
- Try different scale factors (
-s 50,-s 100) - Create custom query scripts
- Generate reports for different time periods
For Production Use:
- Set up automated daily reports
- Configure email alerts for slow queries
- Monitor trends over time
- Optimize queries identified in reports
Advanced Topics:
- Query optimization with EXPLAIN ANALYZE
- Index creation and maintenance
- Connection pooling with PgBouncer
- Real-time monitoring with pg_stat_statements
💡 Pro Tips:
- Regular Monitoring: Generate reports daily to spot trends
- Baseline Performance: Save reports to compare performance over time
- Focus on Slow Queries: Optimize the slowest queries first (biggest impact)
- Watch for Patterns: Look for queries that run frequently but slowly
- Test Changes: Run pgbench before/after optimization to measure improvement
Remember: Performance monitoring is an ongoing process. Keep analyzing, optimizing, and improving! 🚀
📞 Need Help?
Resources
Troubleshooting
PostgreSQL won't start?
sudo systemctl status postgresql@17-main
sudo journalctl -xe -u postgresql@17-main
No logs being created?
sudo -u postgres psql -c "SHOW logging_collector;"
sudo -u postgres psql -c "SHOW log_directory;"
ls -la /var/lib/postgresql/17/main/log/
pgBadger errors?
pgbadger --help
# Check log format matches: -p '%t:%r:%u@%d:[%p]:'
Quick Start Tutorial - PostgreSQL 17 + pgBadger
Version 1.0 | October 2025
Happy Performance Monitoring! 📊
About the Author

More tutorials you might like
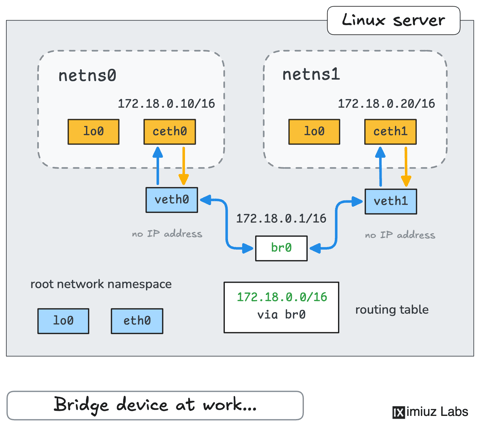
How Container Networking Works: Building a Bridge Network From Scratch
Begin with the basics to understand Docker and Kubernetes networking: learn how to create and interconnect Linux network namespaces using only command-line tools.

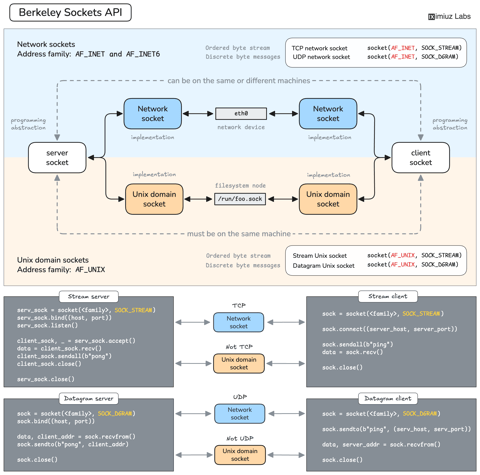
How Servers Work: A Hands-On Introduction to TCP Sockets
Learn how servers actually work by building a tiny TCP server and client from scratch. A hands-on introduction to sockets, TCP, and the network programming model every backend, DevOps, and platform engineer should go through at least once.
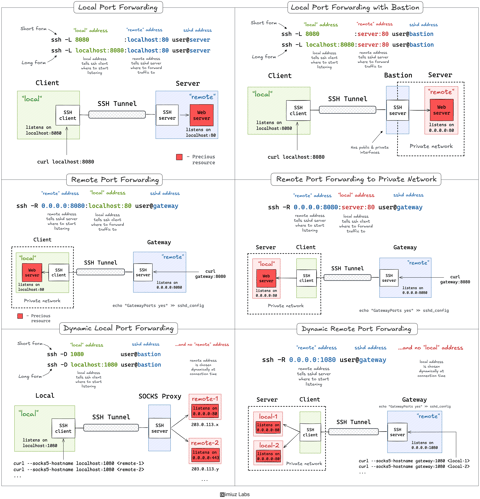
A Practical Guide to SSH Tunnels: Local and Remote Port Forwarding
SSH port forwarding explained in a clean and visual way. How to use local and remote port forwarding. What sshd settings may need to be adjusted. How to memorize the right flags.
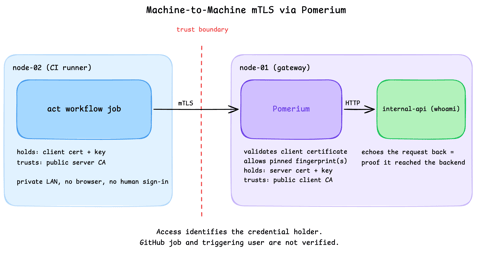
Secure Machine-to-Machine Access with mTLS and Pomerium
Run a GitHub Actions-compatible continuous integration (CI) job on a private runner and protect its internal API call with mutual TLS (mTLS) and Pomerium. Build separate server and client trust chains, authorize one machine certificate by fingerprint, then revoke, restore, and rotate its credentials through live policy changes.

Learn by doing, not just by reading or watching
Sign up for a free account to start a VM playground right on this page, track your progress, and get notified about new learning materials.