Nobody hides from the kernel
Seeing Inside Your App Without Changing Code
Ever wondered what's really going on inside your applications? You may have a large collection of systems with many different applications... how to find/observe/track/understand a dynamic landscape when one application is in Java, one in Go and one in Python?
Or, you may wish to implement the Zero Trust approach, which demands all traffic be encrypted. Now, that is well and good: only how do you monitor encrypted traffic? You surely don't want your attackers to benefit from hiding inside the encrypted traffic...
No bees were harmed making this tutorial
Traditional methods often require adding logging statements, which means changing code and redeploying. Another option is using debuggers, which typically requires compiling differently and/or accepting heavy performance overheads.
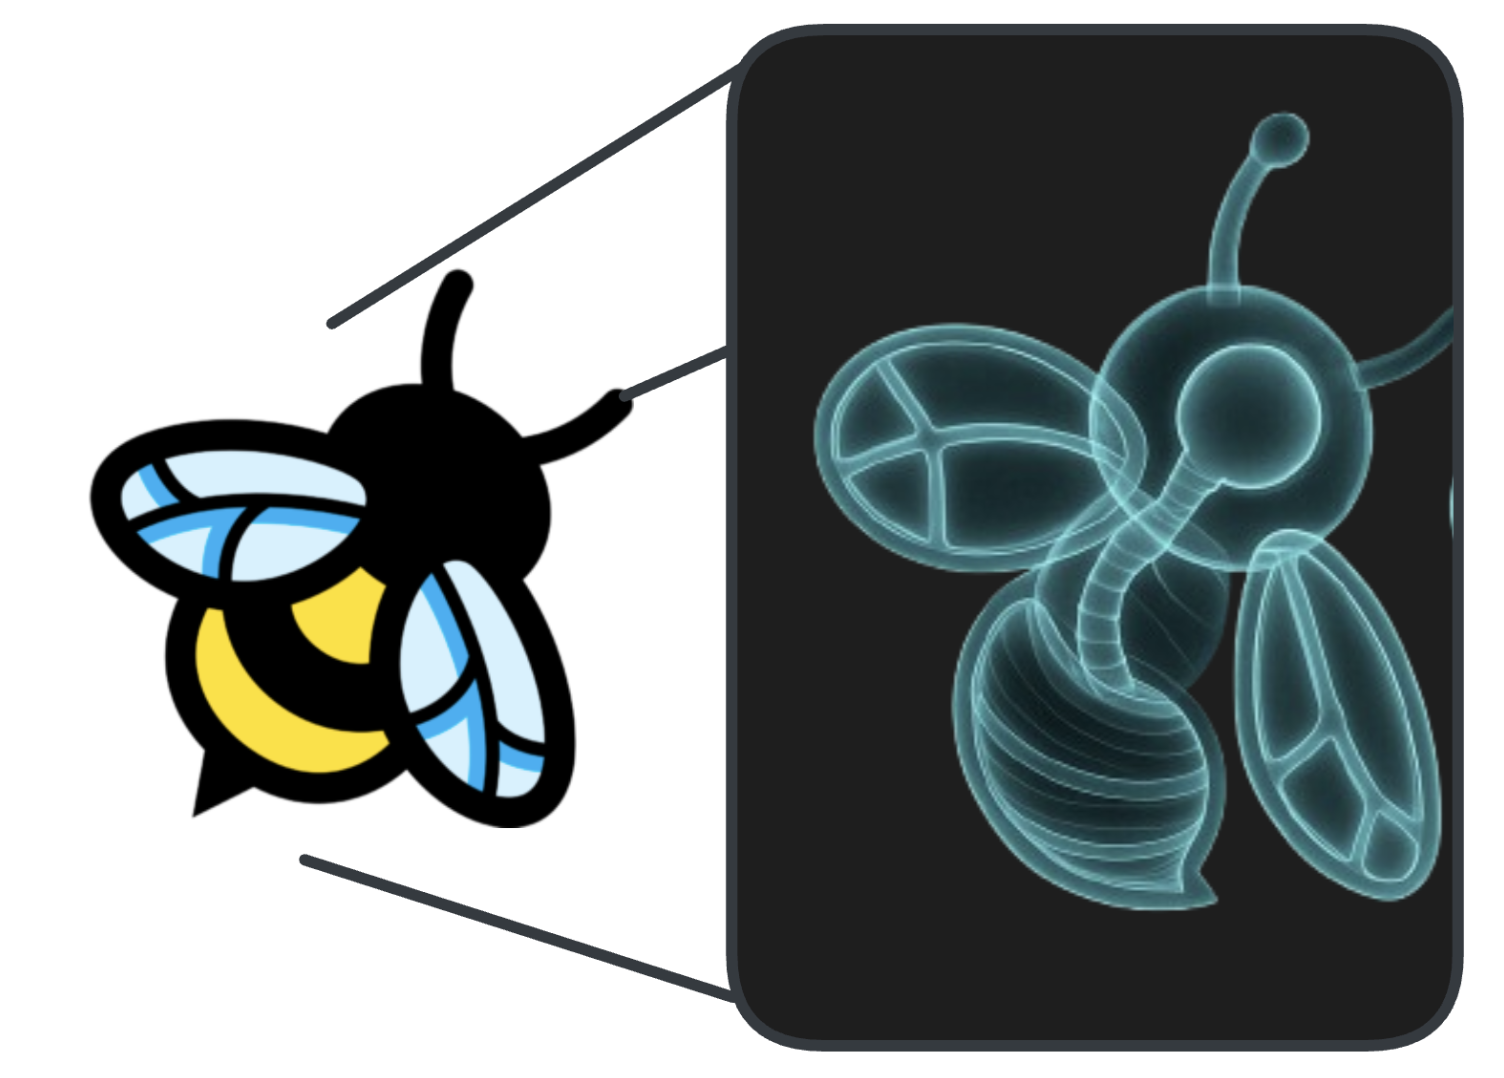
So, what if we could X-ray the applications without cutting them open? Hiding from X-rays is very hard (heavy more like, as you need to carry around dense objects like sheets of lead).
What do I see and how is the contrast when X-raying applications with eBPF? Can I see everything? -- No, I can only see as well as I understand what exactly I am looking for
Now, in your distributed application landscape: Imagine being able to attach trip-wires, collectors and traces underneath the application, underneath the so-called user-space, in a place that all the applications need to share: the Linux kernel. These programs can observe e.g. system calls, network events, and file-system access, all without modifying the kernel nor the application source code. These programs can also modify and even block certain behaviors.
I personally see eBPF as an X-ray machine where we can scan our systems like X-rays go through matter, and depending on the type of matter that is being X-ray-ed (conversely the symbols in the code that are being hooked into).
Key Benefits of eBPF
- No Application Code Changes: Observe applications without modifying their source code.
- Low Overhead: eBPF programs run efficiently in the kernel, minimizing performance impact.
- Real Time: eBPF programs can change the Kernel behavior
instantly - Programmability: You can write custom eBPF programs to collect the data you need
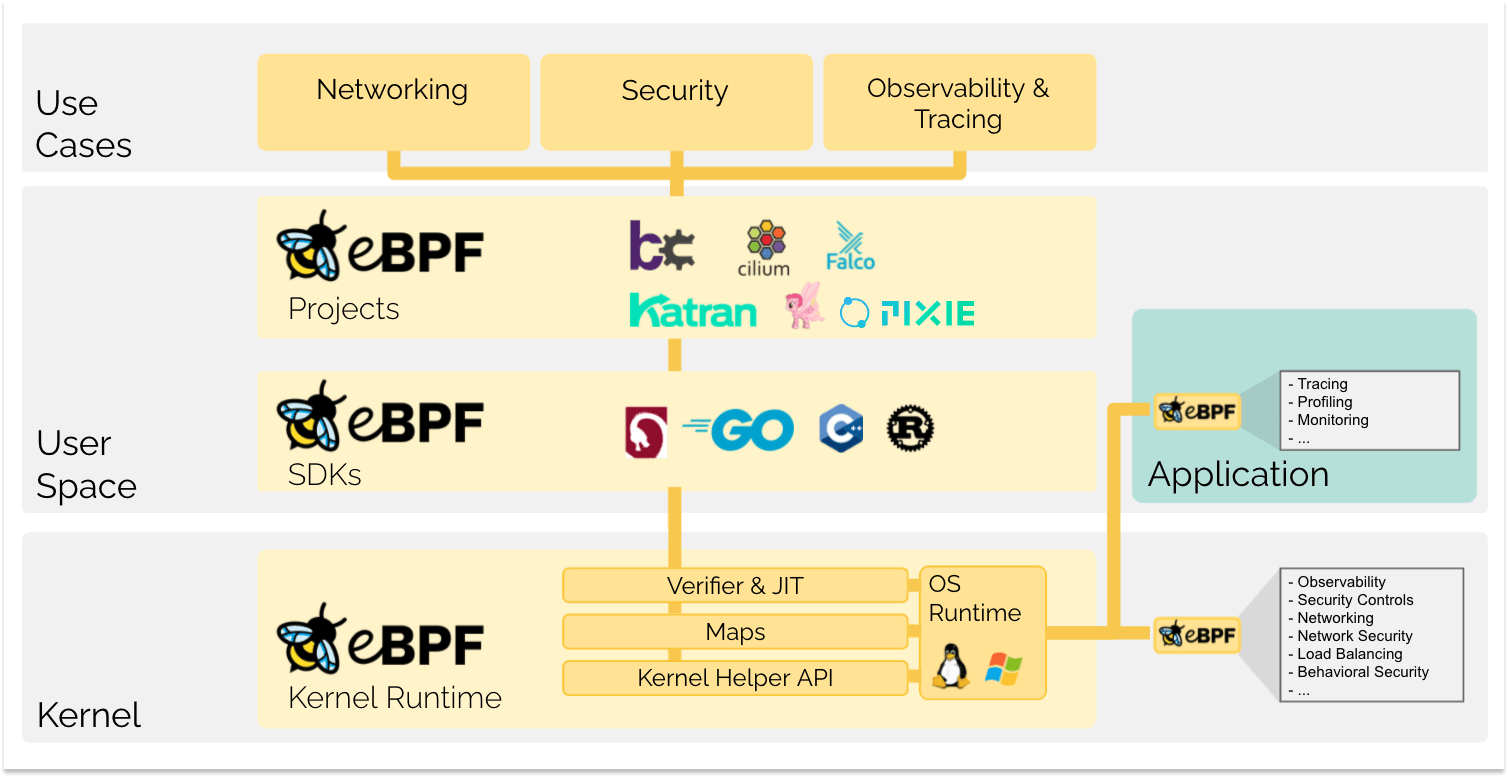
For further reading, see ebpf.io
There are some caveats though, first off:
- Know your own skill level: someone like me should never write production eBPF code. Teaching yourself how it works by writing little program-snippets is one thing, putting it into prod, a very different game. Just like you can buy an X-ray machine, maybe use it, but you should never build one.
- X-rays don't detect everything, neither does eBPF, X-ray images only show structures that absorb in certain energy bands. For example water is transparent to (soft) X-rays and eBPF can not hook into code that is stripped of symbols.
Watching from underneath or how to trace apps in the Kernel credit
eBPF is not just transparent to the apps, but (can be) also to the attacker : Another important aspect in defensive security is that your attackers don't instantly see (and God forbid alter) your security controls. Here the implementation matters, but if well designed, it will require an attacker to be root to even see that the eBPF instrumentation is running. And ideally, by that time, we ve detected them 🏴☠️ .
Meet our ♥️ OpenSource Friends
We will be exclusively using open-source tooling and Constanze expressly thanks the maintainers, creators and contributors of those projects1.

Pixie (left), Kubescape (middle) and Tetragon (right)
Pixie as The Tracker : understands protocols
- real time debugger
- introspects protocols (SQL, DNS, HTTP, KAFKA, REDIS...) in real time
- 100% souvereign -> collects data into analysis cockpit without data ever being stored outside your datacenter
- manages real time distributed deployment of on-demand eBPF traces
🤝 You ll meet it when:- in Chapter 1: we
we vizualise network traffic - in Chapter 2 (next week): we
we introspect Database behavior
- in Chapter 1: we
Kubescape as The Scout : scans everything
- finds vulnerabilities and misconfigurations
- can learn baselines of applications (via Inspector Gadget)
- alerts on anomaly
🤝 You ll meet it when: wego anomaly hunting
Tetragon as The Sniper: specific targeting of identified objectives (in the kernel)
- abstracts eBPF into yaml
- useful if you know what you are looking for
- apart from detecting (tracing), it can also block
🤝 You ll meet it when: wefind and block a vulnerable library
Who this course is (not) for
The way I've learnt almost everything, is by diving in and discovering how something works by solving a problem I'm interested in solving. These labs will be released on a weekly schedule, and they are not Computer Science lectures, rather the opposite, I will assume that you know as much about 🐝 eBPF as I did about computers in 2005 🤓 and we will phenomenologically uncover how eBPF works, by using it in many different ways - sometimes even by using it wrong:
When in 2005, I got my first computer and the guy2 next door in the student dorm suggested I install the best operating system, which he claimed was
a Gentoo Linux3 , I nodded.
So my first make menuconfig was very exciting, I picked words that sounded vaguely familiar, and ended up booting into a blinking cursor on a black screen...
We all wish there was a fast-track to learning, but nothing beats deleting your partition table for your brain to remember, what exactly that table is and why you will avoid repeating this particular exercise.
Linux is wonderful in that it let's you edit everything and these labs don't mind being destructed, you are invited to build your own mental model by poking at it from all sides, and if you break the lab, there's a reset button in the top right corner.
Fortunately, unlike X-rays, eBPF has no health hazards ☢️
If you are looking for technical material, please see anything Liz Rice has so wonderfully published4
Footnotes
Footnotes
- These projects can do a lot more than I'm mentioning here, they will be installed/running in the labs so you are more than welcome to explore
their functionality further.
↩ - Thanks Fabian 🙏 🤣 ↩
- Gentoo is a distribution of Linux in which everything was compiled from source, incl the kernel ↩
- I cannot recommend Liz's books enough, she writes succinctly and yet never loses the reader. ↩
Protocol Tracing with Pixie - DNS and HTTP
The real world problem :
I have a lot of apps on a few distributed servers and there is lots of traffic. Some of these apps, I don't even exactly know what they do. I may have installed them for one specific reason, however it pulled in lots of dependencies and now I have even more apps.
Let's begin at the beginning and tackle the question: How do I see all of the traffic?
The solution :
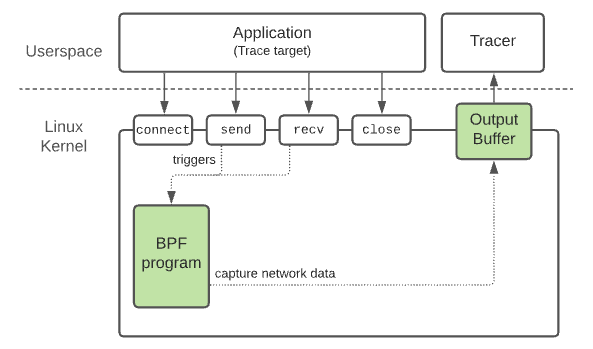
Install tracers on each server
- that hook into common kernel functions to capture raw network data
- and use protocol inference to understand the traffic content
- at the source (in the kernel)
- without the apps being disturbed (no downtime)
- without the apps being changed
- without the system needing large amount of extra resources
- without the system needing to change (ok, we can argue this point)
The minimum requirements:
- A reasonably recent kernel (the use-cases in this lab require different minimum version...>4.4, sometimes >5.8)
- A set of kernel flags enabled
- An eBPF tool that knows how different networking options work, so as to extract the protocols meaningfully 1
Our eBPF user-space agent: Pixie!
Please install Pixie with the commands in this box 💡
Please accept the defaults and the EULA in the dialogue, the installation will take about 5 minutes to equilibrate.
We will be using the pixie's cosmic.ai hosting of
the UI and to link your local cluster (here on this lab) with the remote UI, you will be asked by auth0 to input a valid email to receive a token.
sudo bash -c "$(curl -fsSL https://getcosmic.ai/install.sh)"
export PX_CLOUD_ADDR=getcosmic.ai
px auth login
px deploy -p=1Gi
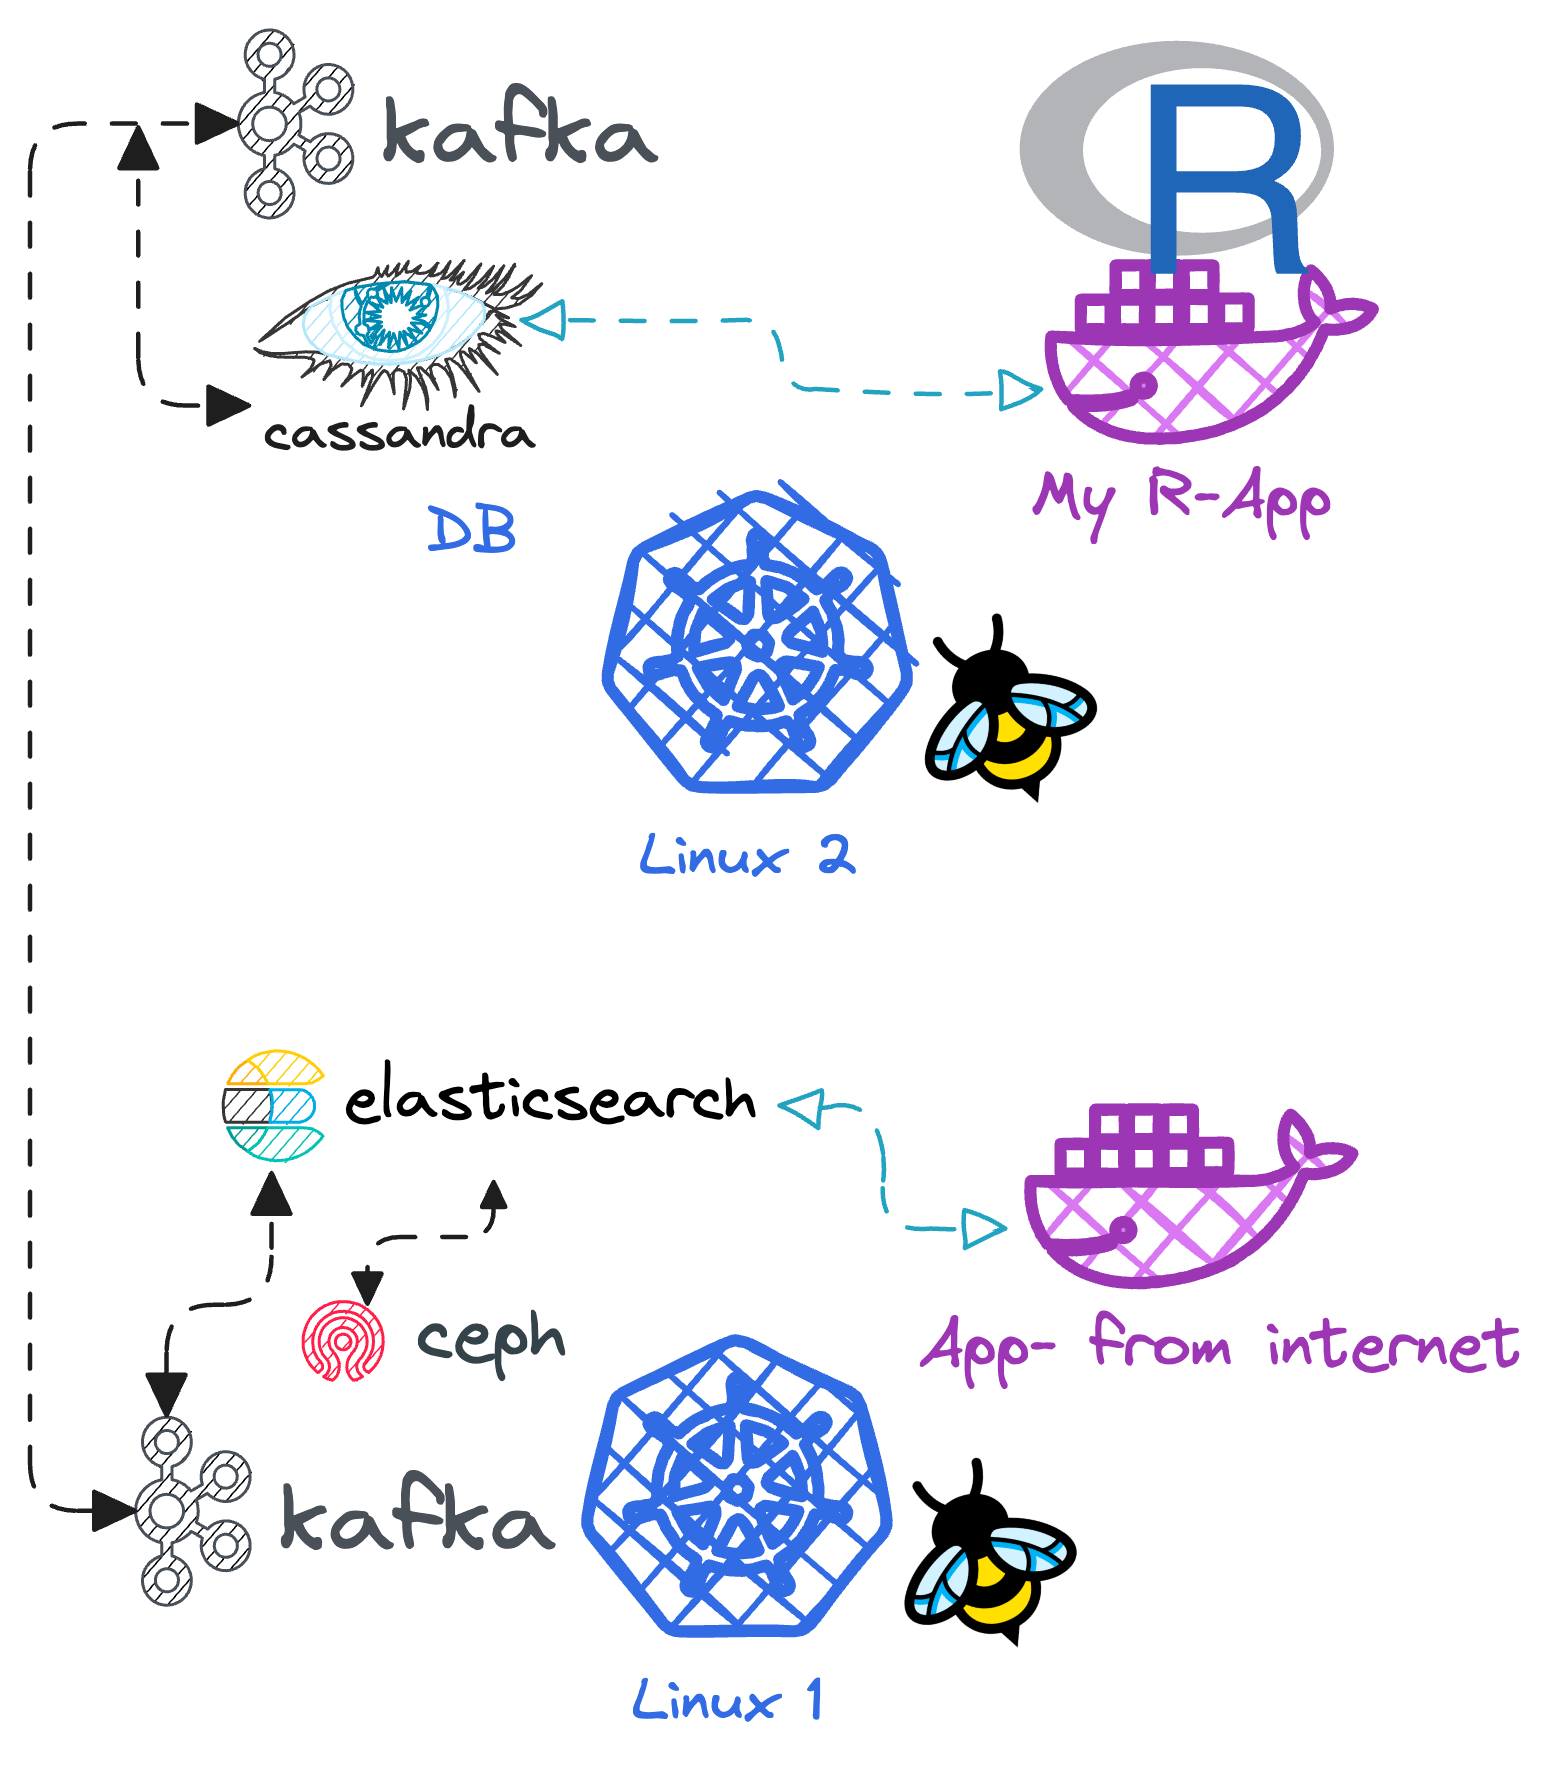
We leverage a CNCF2 project, Pixie, which
places so-called edge-modules on each Linux node to perform tracing via eBPF: Thus, a user gains access - from either the UI or via PxL script-
to all edge-nodes via queries. The UI, which can be understood as an analysis cockpit, manifests queries on demand from the in-memory tables
on each node.
It should be noted, that no data is stored outside your datacenter3.
Fancy! And very souvereign 👑
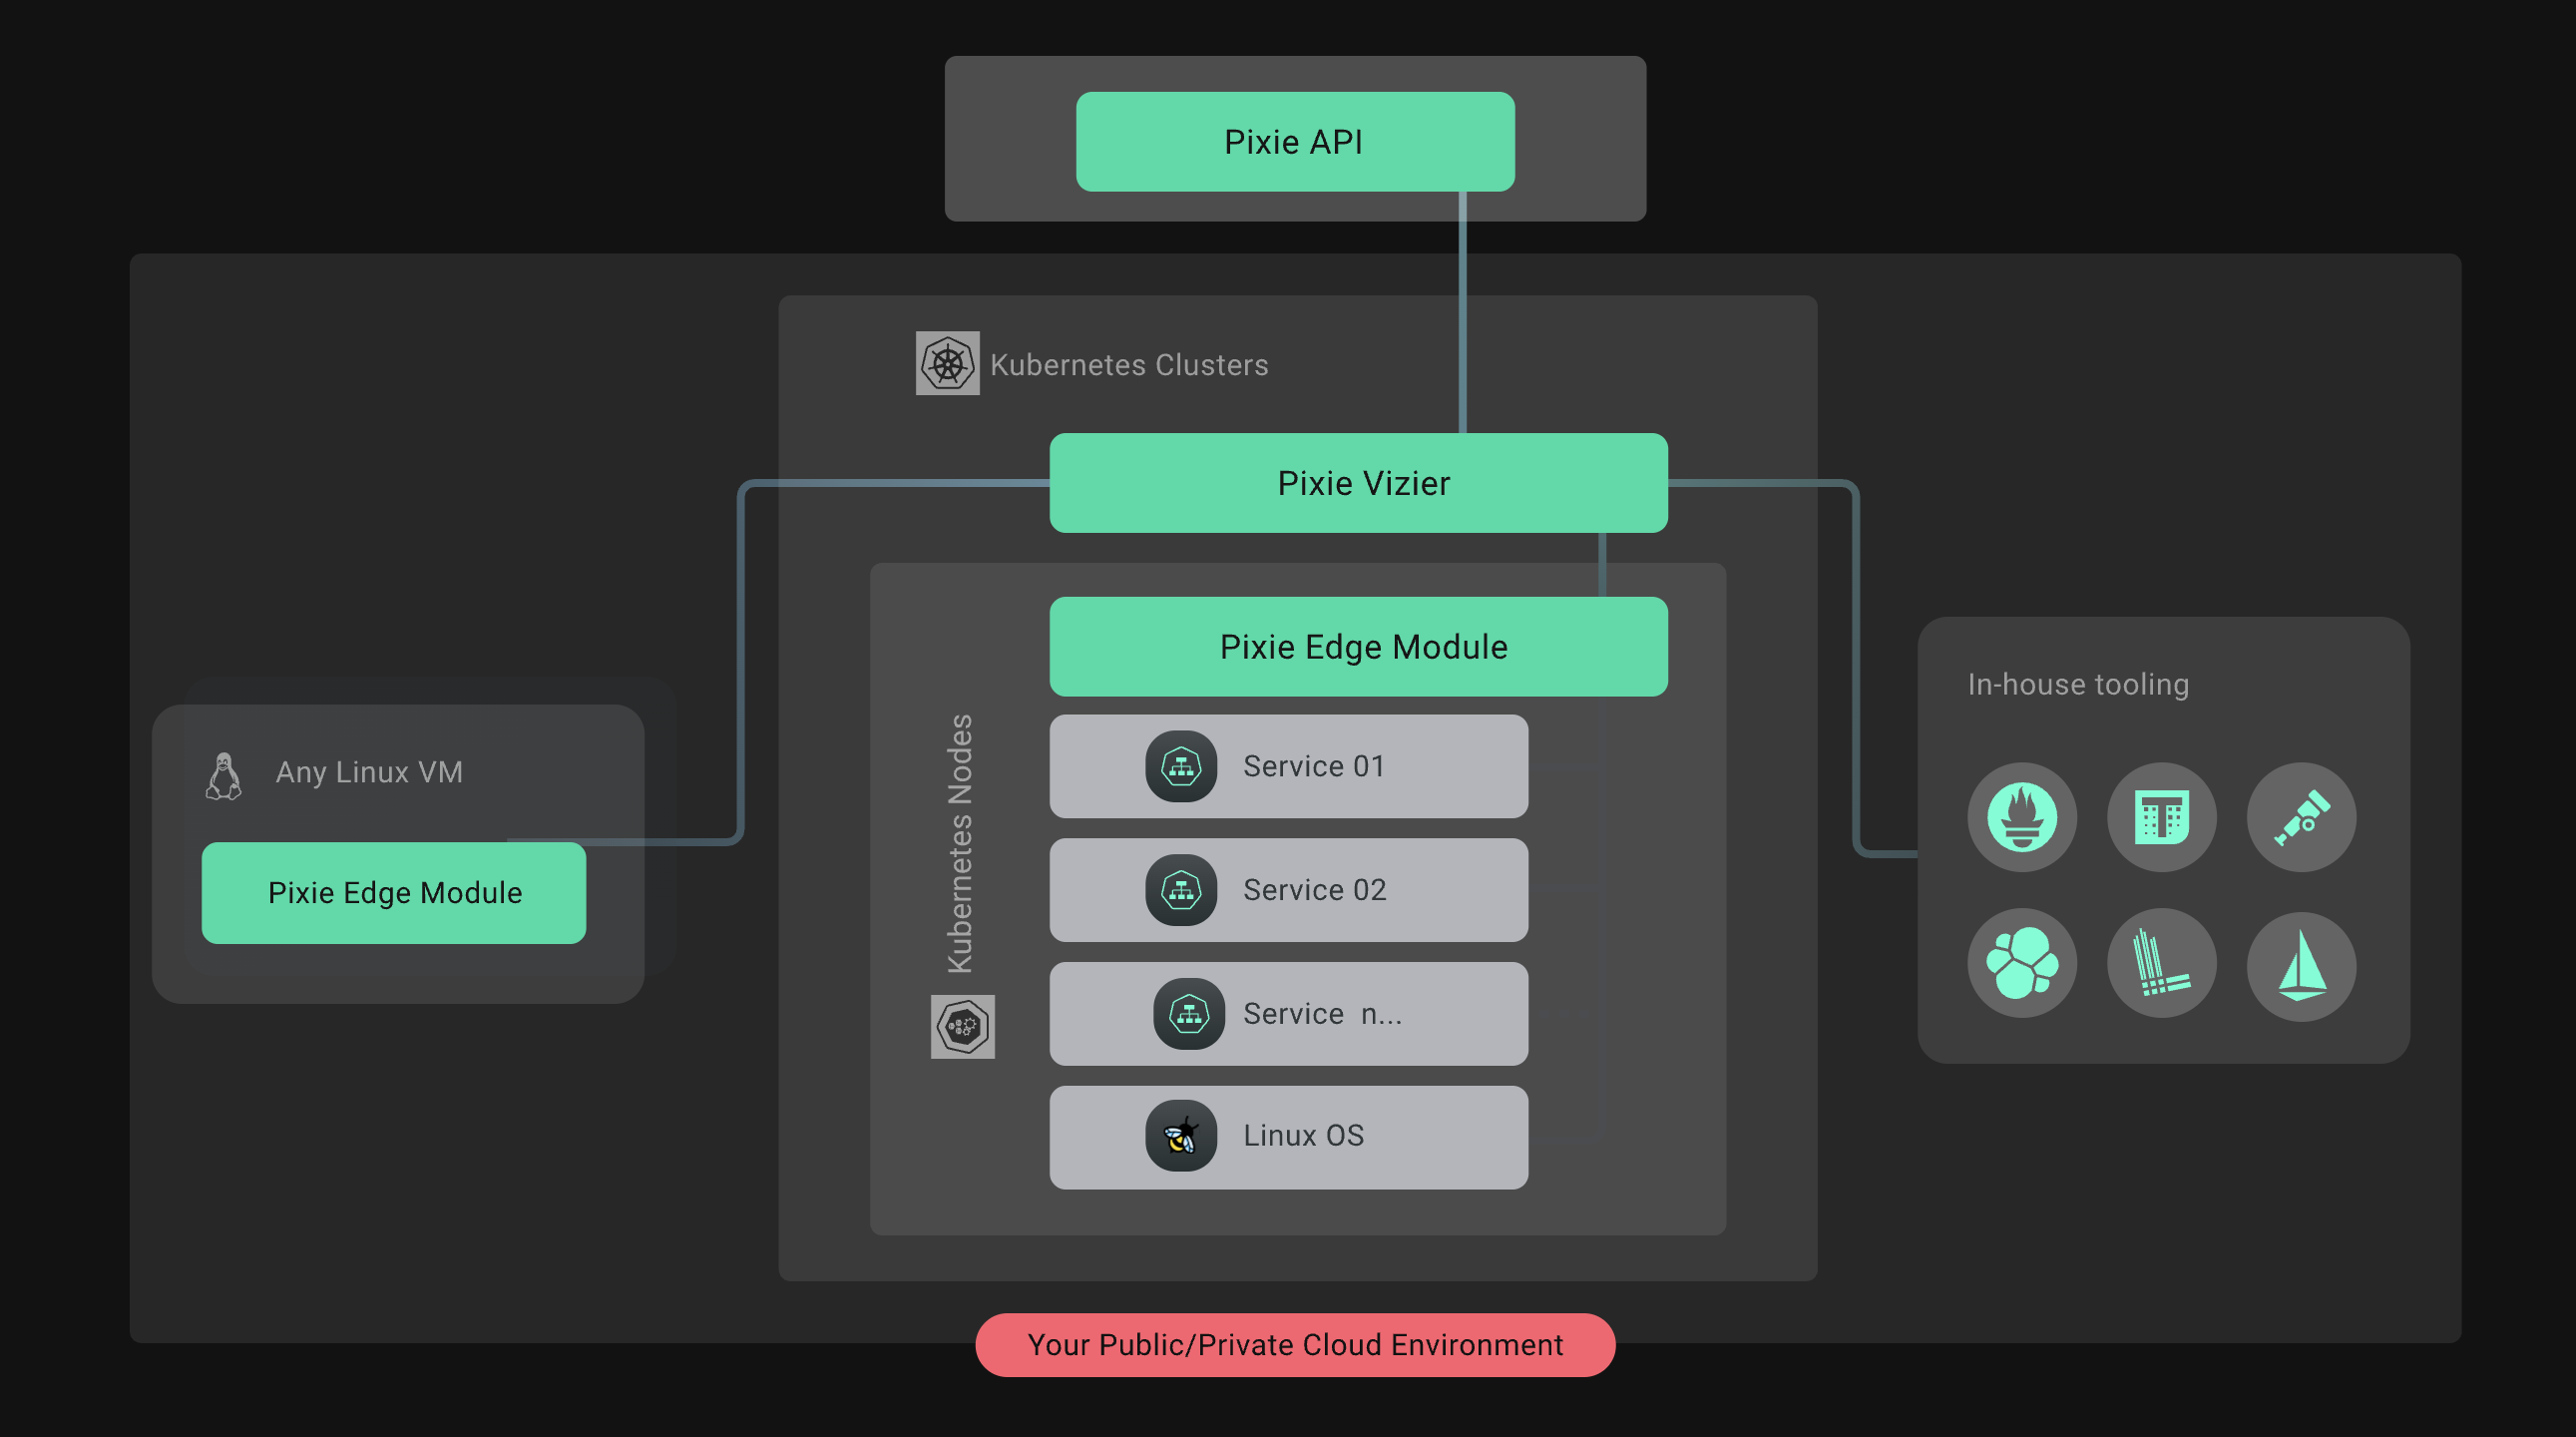
Pixie's Architecture is inherently distributed and almost entirely on the edge. This allows the compute and data to be colocated - a pattern often referred to as query-pushdown - which is not only resource efficient but also imperative for privacy guarantees
Pixie backstory
While we wait for the installer, here is some backstory on the Pixie project:
Pixie's origin story 💡
The company was co-founded by Zain Asgar (CEO), a former Google engineer working on Google AI and adjunct professor at Stanford, and Ishan Mukherjee (CPO), who led Apple’s Siri Knowledge Graph product team and also previously worked on Amazon’s Robotics efforts.
Pixie core was open-sourced by New Relic to the CNCF in 2021.
And here I'm quoting the blog
"With ... Pixie ... you can get programmatic, unified access to application performance data. Pixie automatically harvests telemetry data, leveraging technology like the extended Berkeley Packet Filter (eBPF) at the kernel layer to capture application data. Pixie’s edge-machine intelligence system, designed for secure and scalable auto-telemetry, connects this data with Kubernetes metadata to provide visibility while maintaining data locality.
Pixie’s developer experience is driven by three fundamental technical breakthroughs:
No-instrumentation data collection: Pixie uses technologies such as eBPF to collect metrics, events, logs, and traces automatically from the application, infrastructure (Kubernetes), operating system, and network layers. For custom data, you can collect logs dynamically using eBPF or ingest existing telemetry.
Script-based analysis: Pixie scripts provide a code-based approach to enable efficient analysis, collaboration, and automation. You can use scripts from Pixie’s native debugging interfaces (web, mobile, and terminal); scripts are community-contributed, team-specific, or custom built. Additionally, you can analyze data from integrations with existing Infrastructure monitoring and observability platforms.
Kubernetes native edge compute: Pixie runs entirely inside Kubernetes as a distributed machine data system, meaning you don’t need to transfer any data outside the cluster. Pixie’s architecture gives you a secure, cost-effective, and scalable way to access unlimited data, deploy AI/ML models at source, and set up streaming telemetry pipelines."
Once, the installer is happy, copy paste the following in a terminal
px run px/schemas
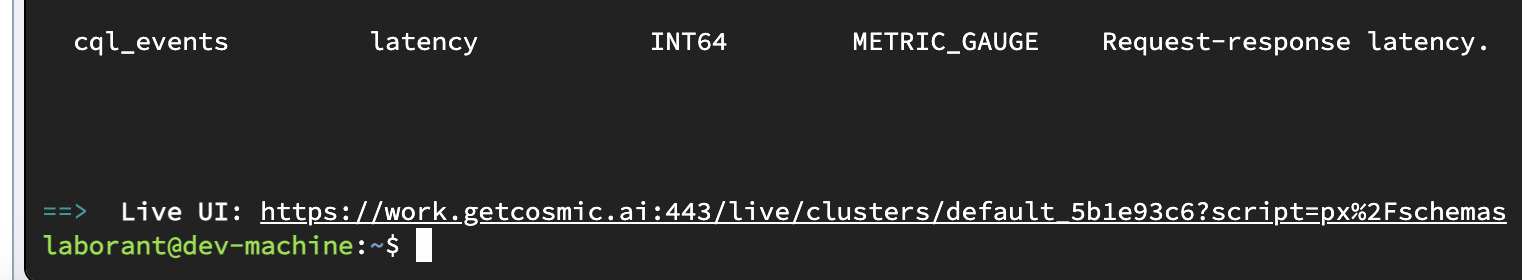
These are all in-memory tables that Pixie constantly populates via eBPF hooks.
Now, click on the link in the bottom, and in the UI, select in the dropdown px/cluster
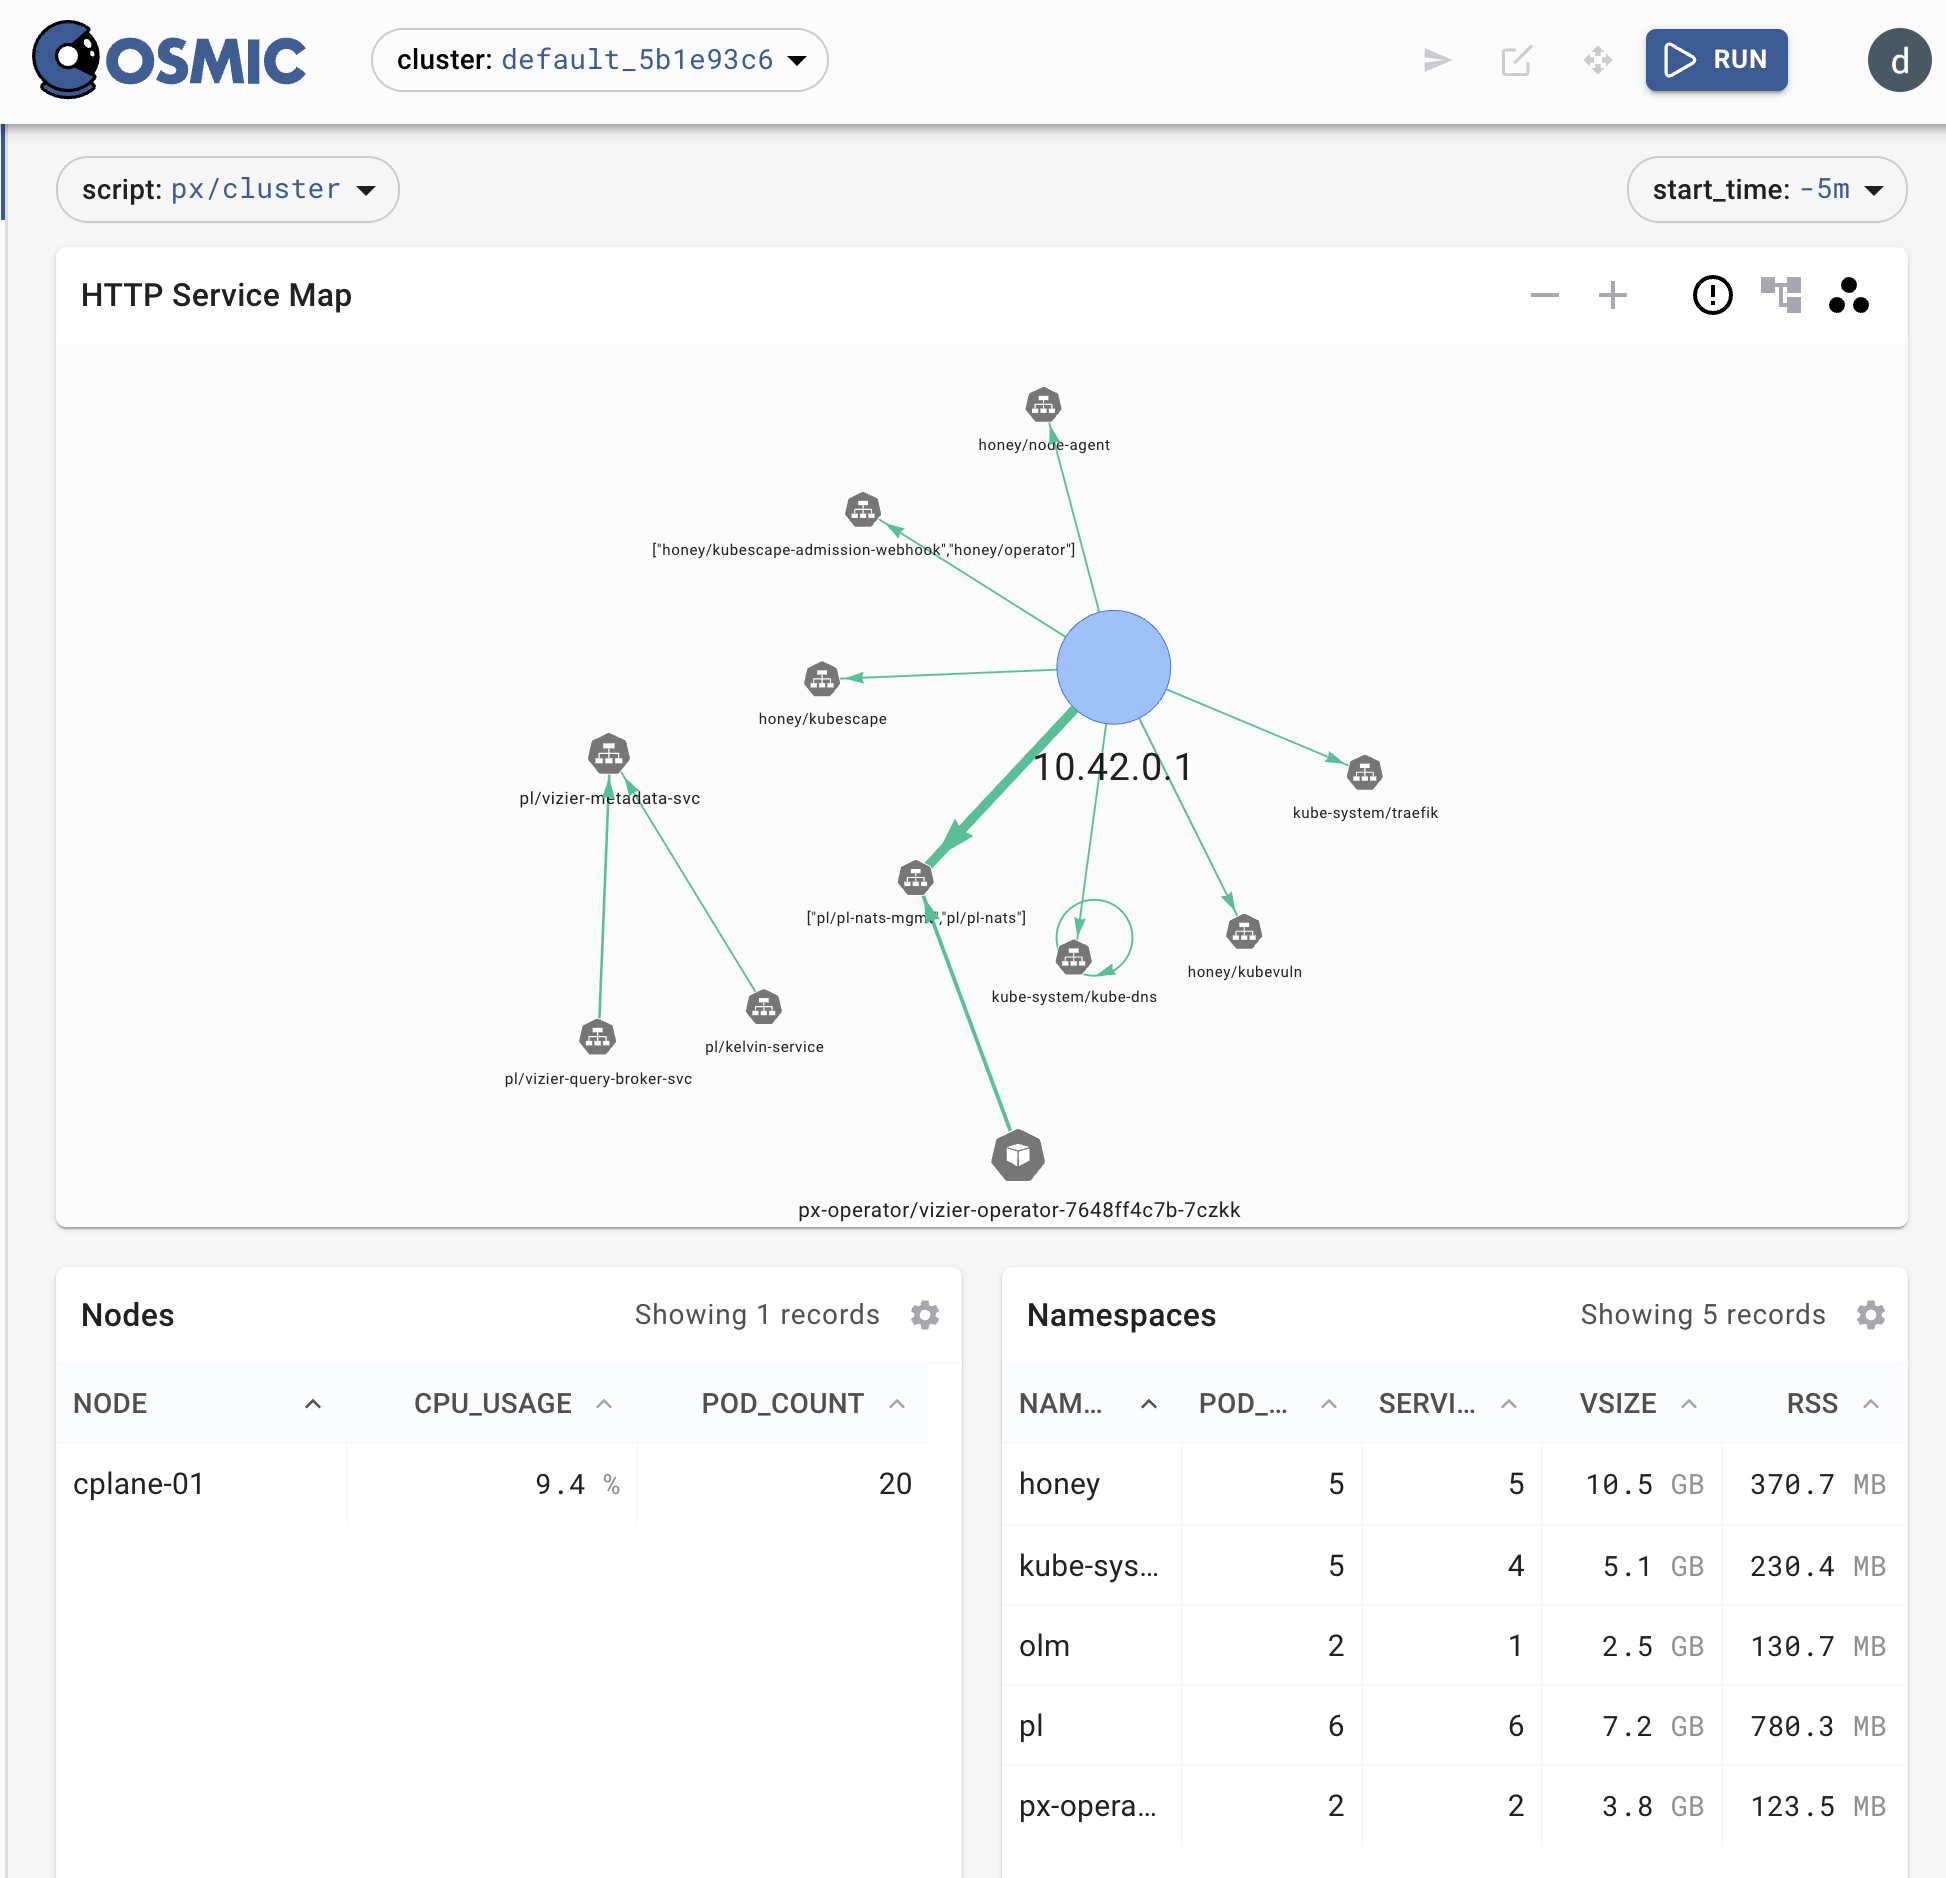
The so-called UI in Pixie is visual query that displays the data - extracted with eBPF and fetched by the script via Apache Arrow. The script language is pronounced "Pixel" and spelled PxL
You wanted traffic, here is the traffic!
Tracing DNS calls
DNS may be the most bang-for-your-buck protocol to trace for security observability.
So, either, in the UI find the dns_flow_graph or execute here in the shell, some so-called PxL script (pronounced 'Pixel'):
px run px/dns_data
Lets generate some DNS traffic
To generate some traffic, we can use this HereDoc:
cat <<EOF | kubectl apply -f -
apiVersion: v1
kind: Pod
metadata:
  name: dnswizard
spec:
  containers:
  - name: dnswizard
    image: freelyit/nslookup
    command: ["/bin/bash", "-c"]
    args:
    - |
      while true; do
        nslookup dnswizardry.oracle.com
        dig the.domain.network.segment.is.confused.com
        dig @8.8.8.8 who.is.the.best.wizard.of.all.of.space.net
        nslookup why.did.the.programmer.quit.his.job.because.he.didnt.get.arrays.com
        dig i.used.to.think.the.brain.was.the.most.important.organ.then.i.thought.what.was.telling.me.that.it.was.com
        dig @8.8.8.8 what.do.you.call.a.fish.with.no.eyes.fsh.com
      done
EOF
Copy/paste the above into the terminal and press enter, then go to the UI or rerun the PxL script again:
px run px/dns_data
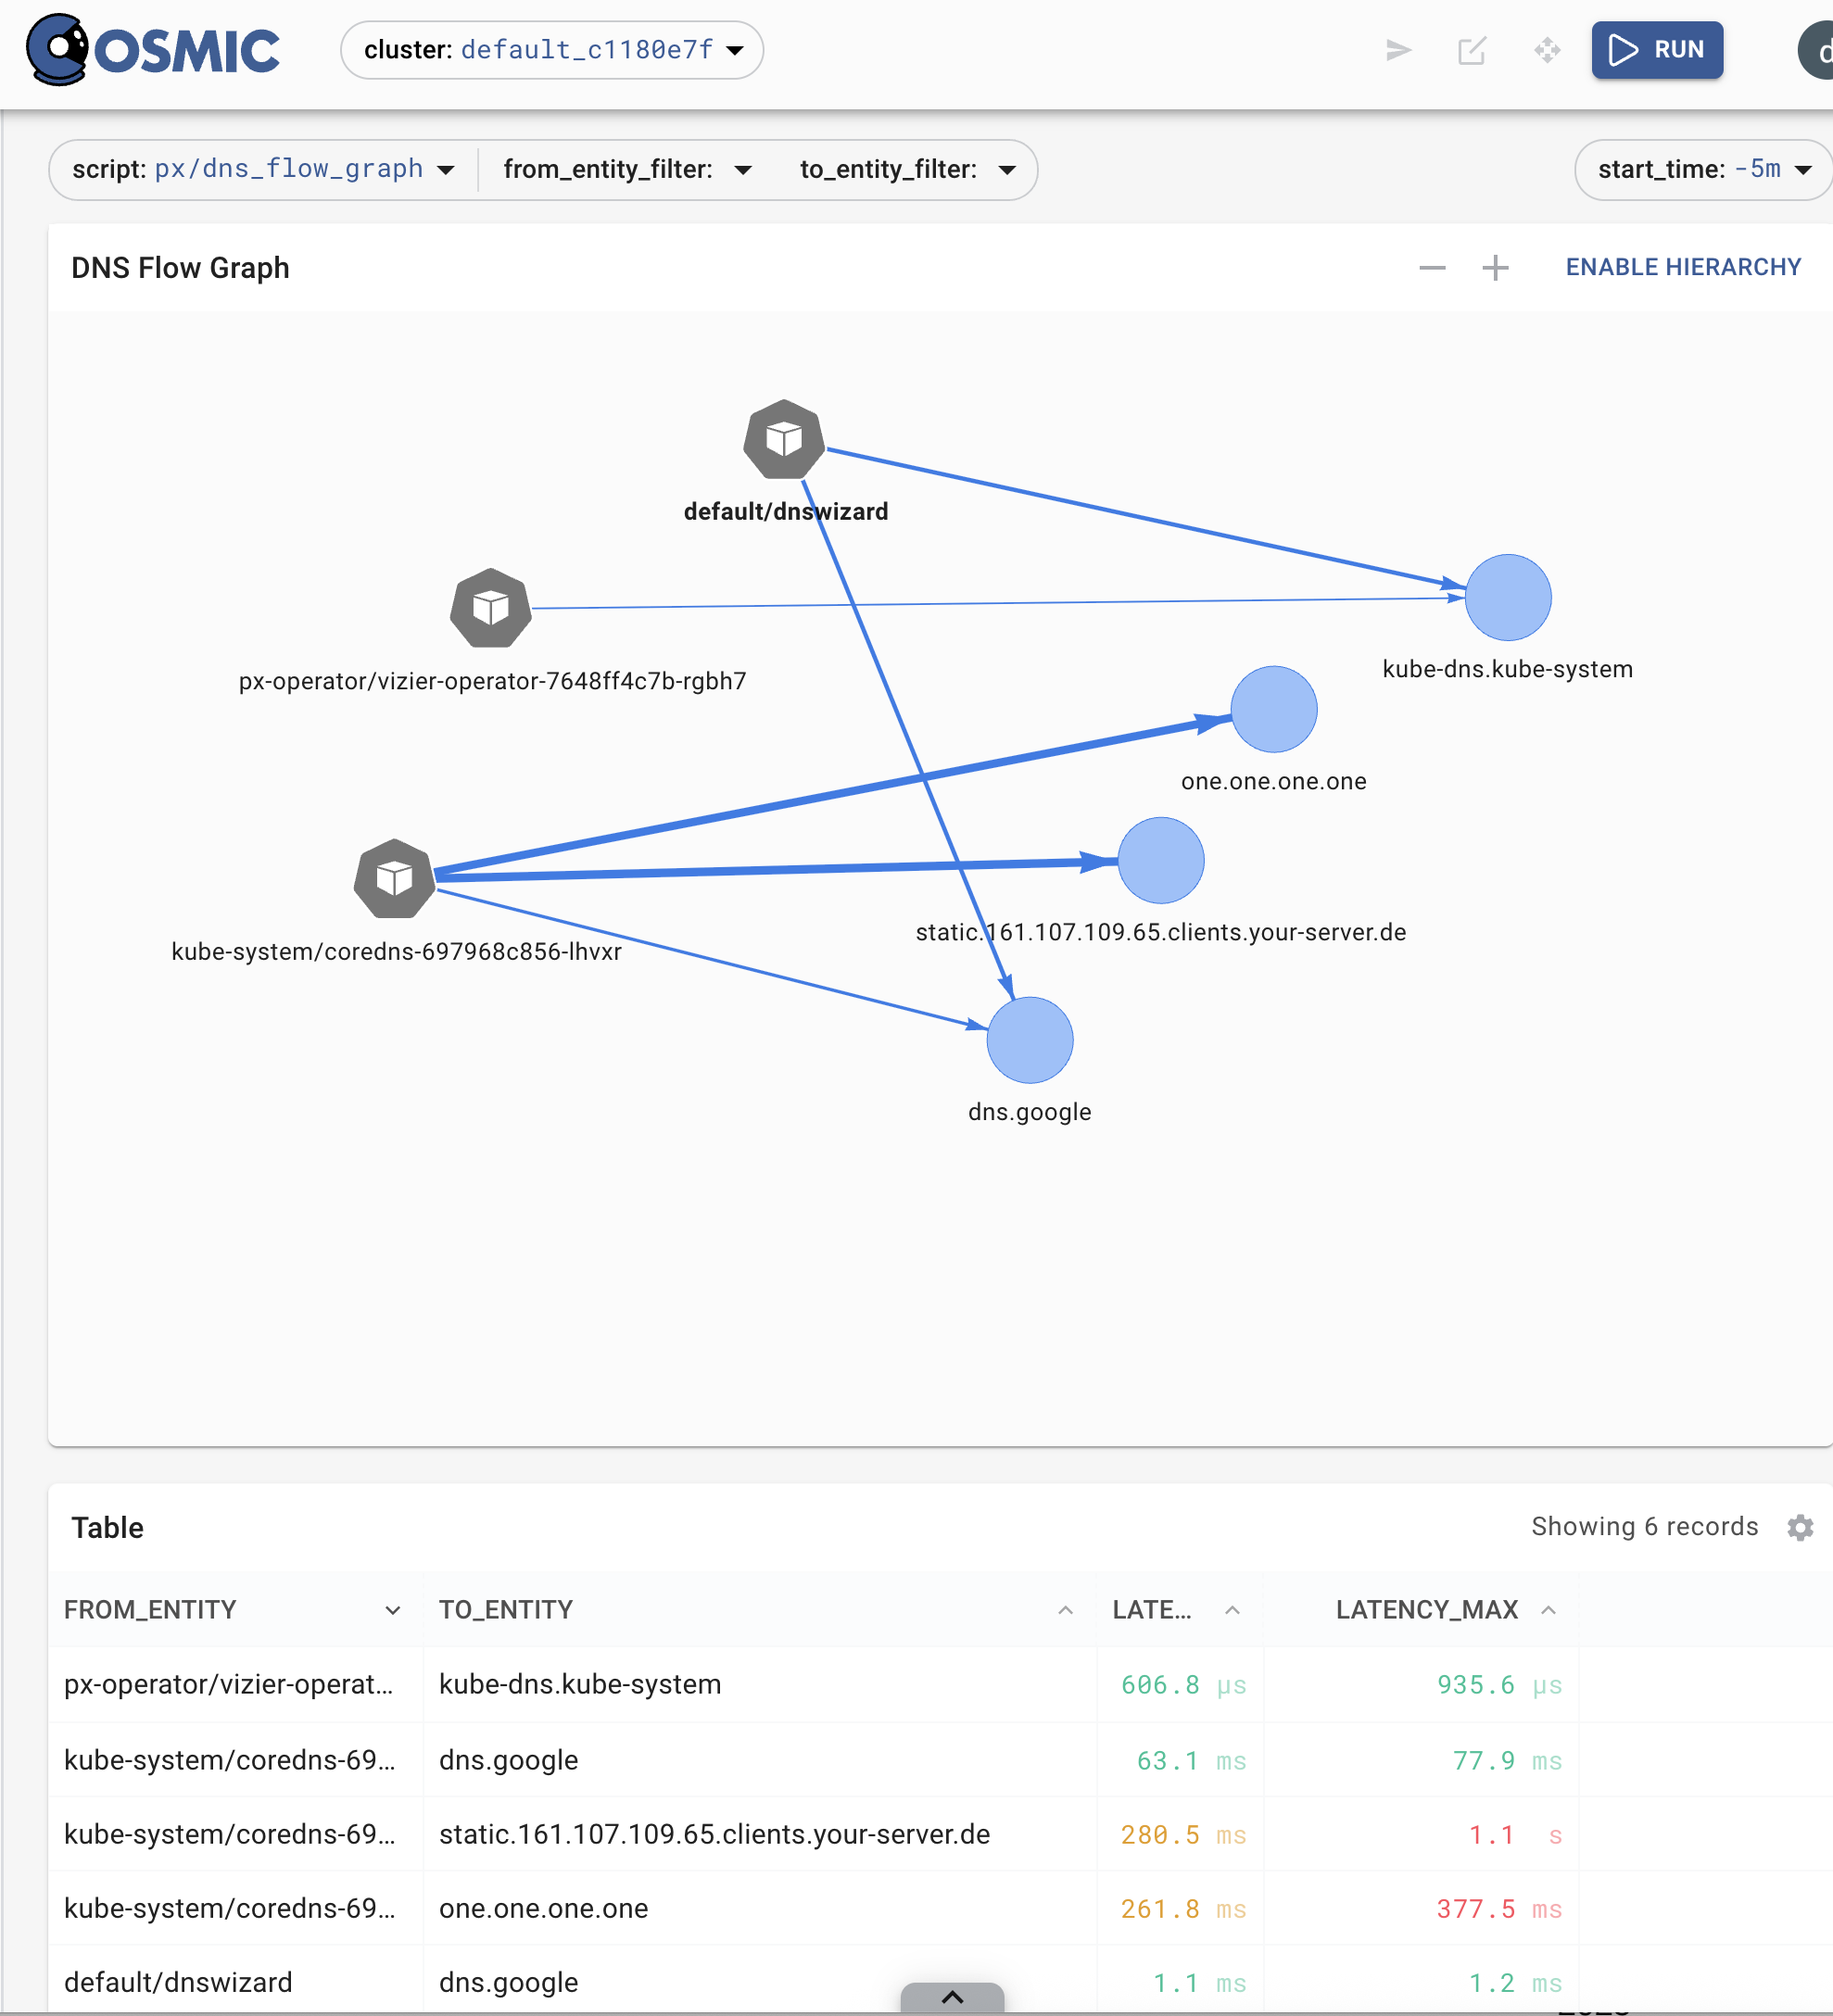
Pixie DNS Flow Graph is an example of a graphical query. If you press RUN the data are manifested and displayed.
You can manipulate the query both graphically, .e.g the dropdowns or modify the script tab
Exercise: Find the DNS requests both query and reply in pixie
Pixie vs tcpdump comparison aka Packet Capture 💡
Some of you may say "Hey, thats a bit like wireshark" and to some extent it is. Pixie is doing it without a pcap though and across N nodes (N=1 in this lab). But, it is fun to compare a few things:
In another other tab
sudo tcpdump -i any port 53 -w outputudp.pcap
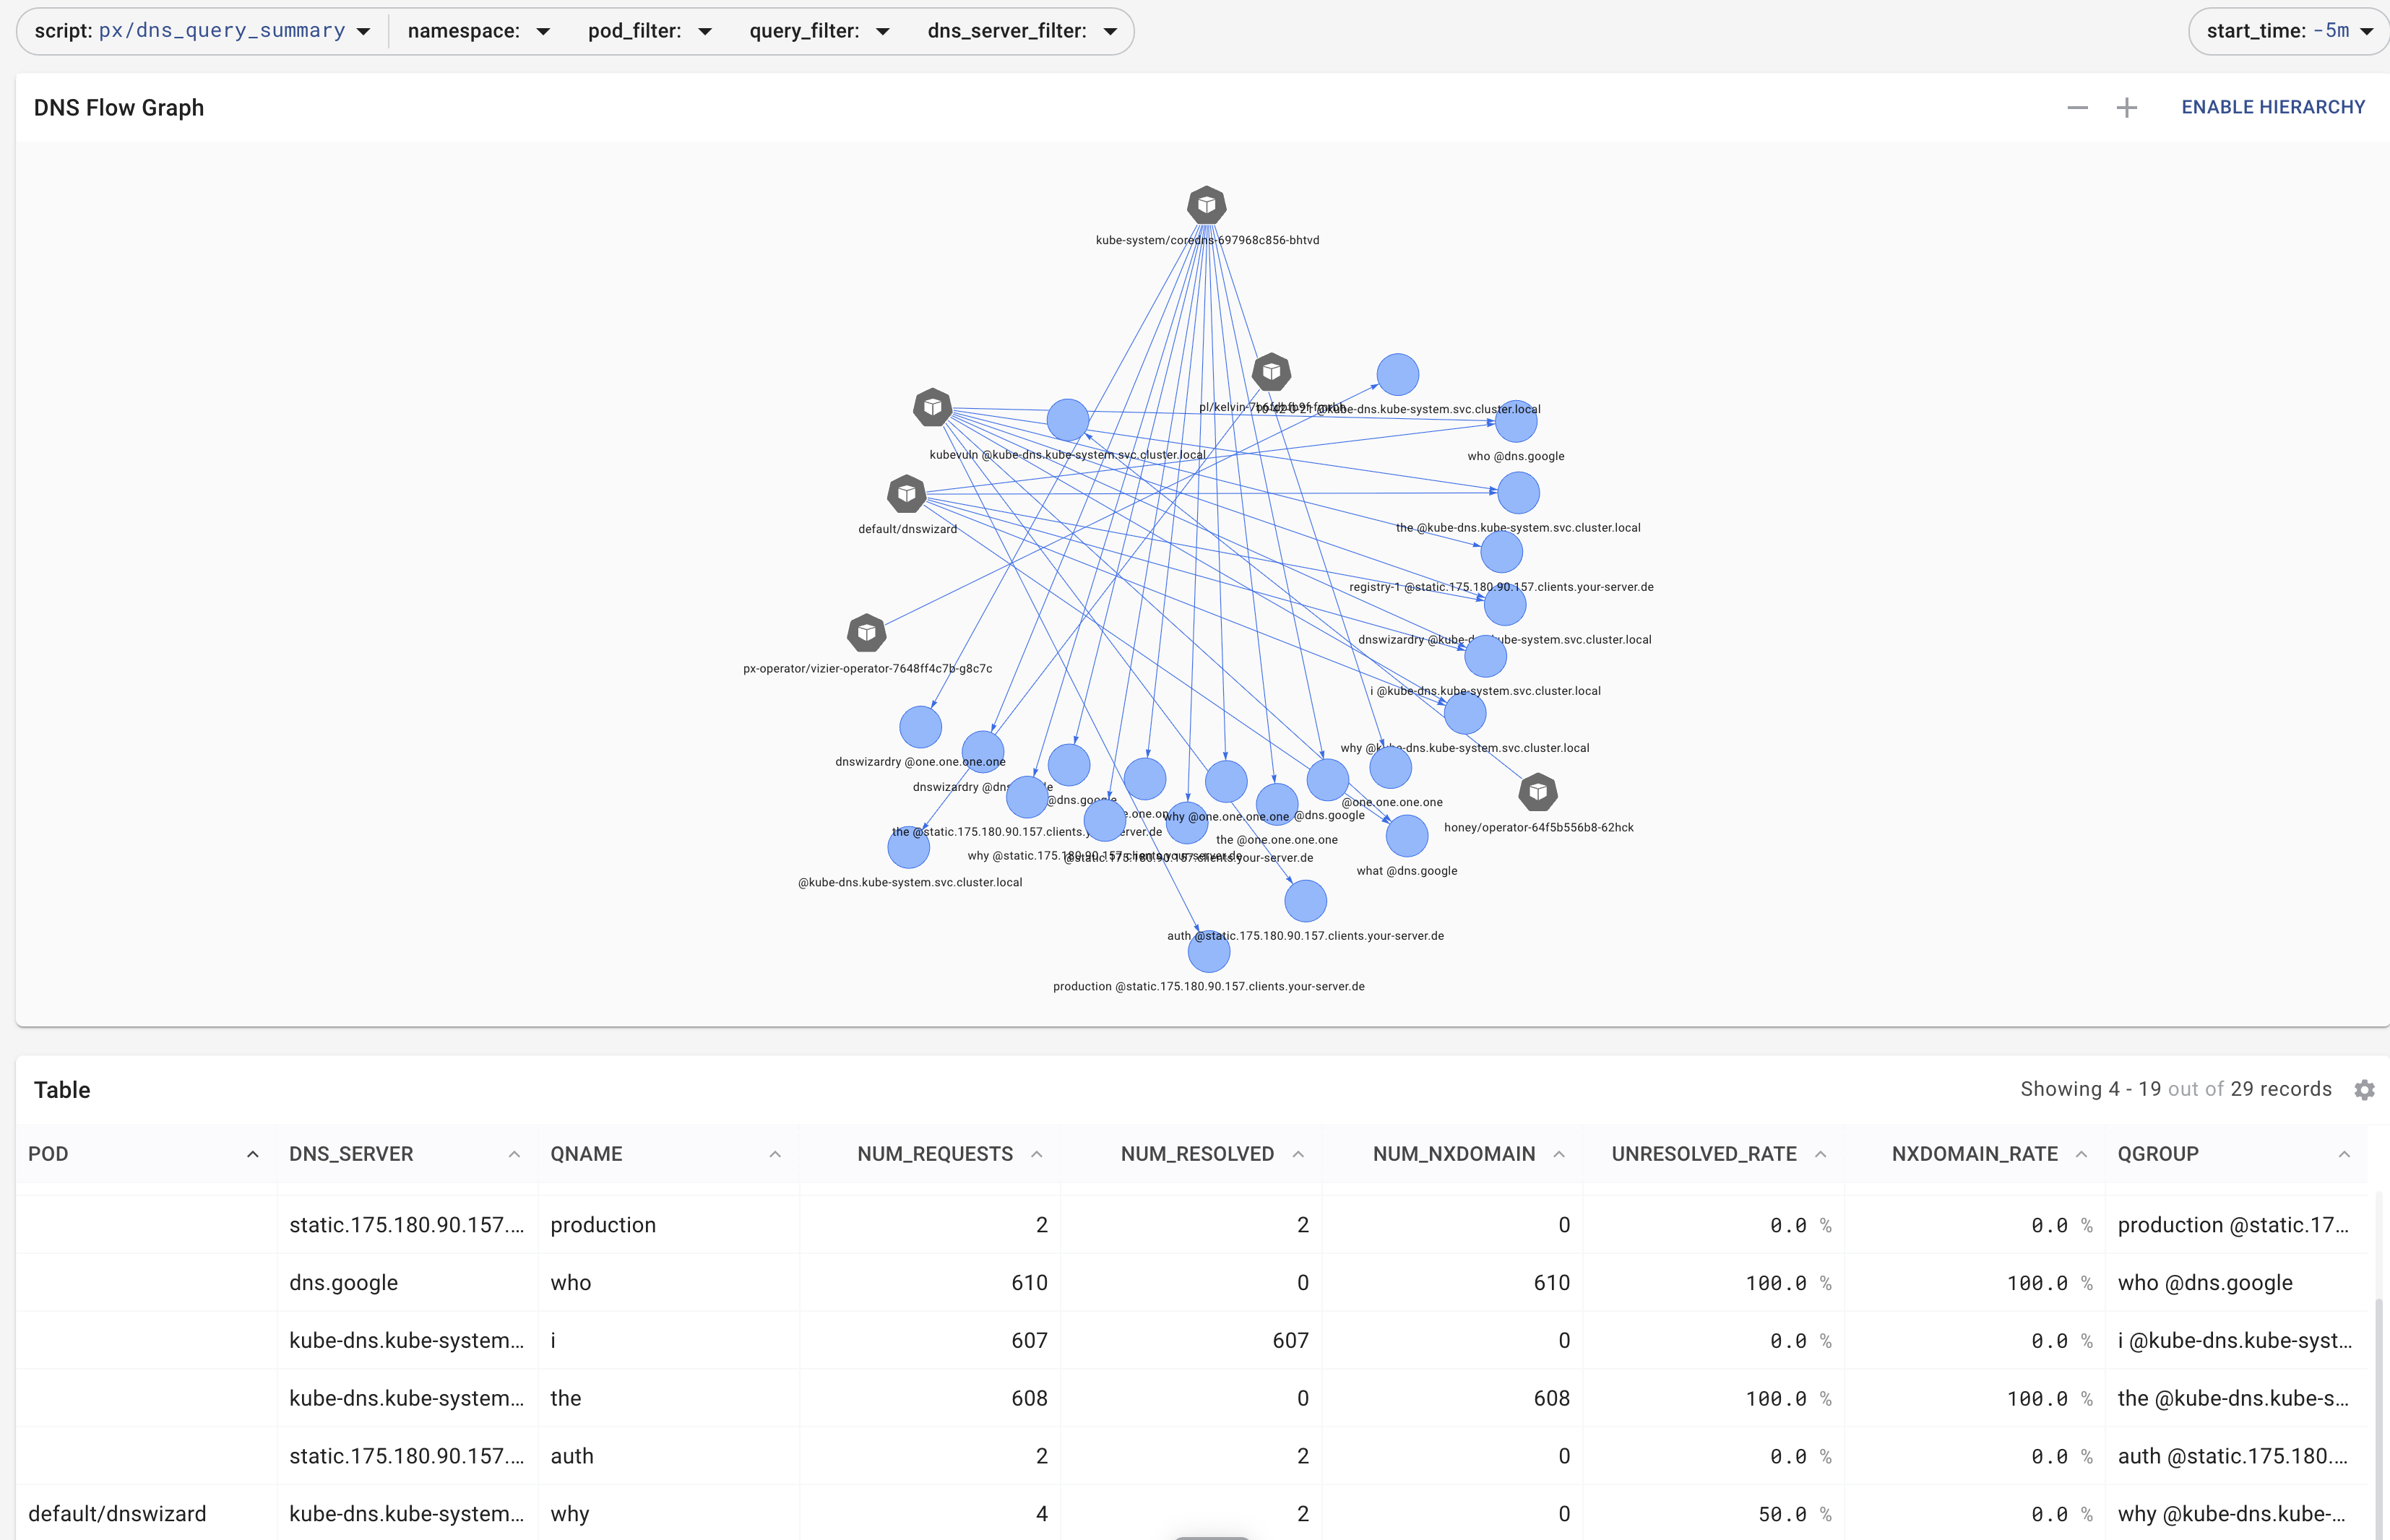
Graphical summary of the DNS noise generated by our nonsense DNS queries
Now, you can use tcpdump -r outputudp.pcap -X to read the queries, after stopping (CTRL-C) the packet capture (pcap). Depending on how long (~3min) you captured
the traffic, you should have several MB
ll -h
-rw-r--r--  1 tcpdump  tcpdump   12M Jul  4 09:28 outputudp.pcap
We can contrast this against Pixie by running a PxL query, if you re-run this after some time (~10min), you will see that there is an increasing number of compacted data because the maximum table size is capped.
import px
df=px._DebugTableInfo()
px.display(df)
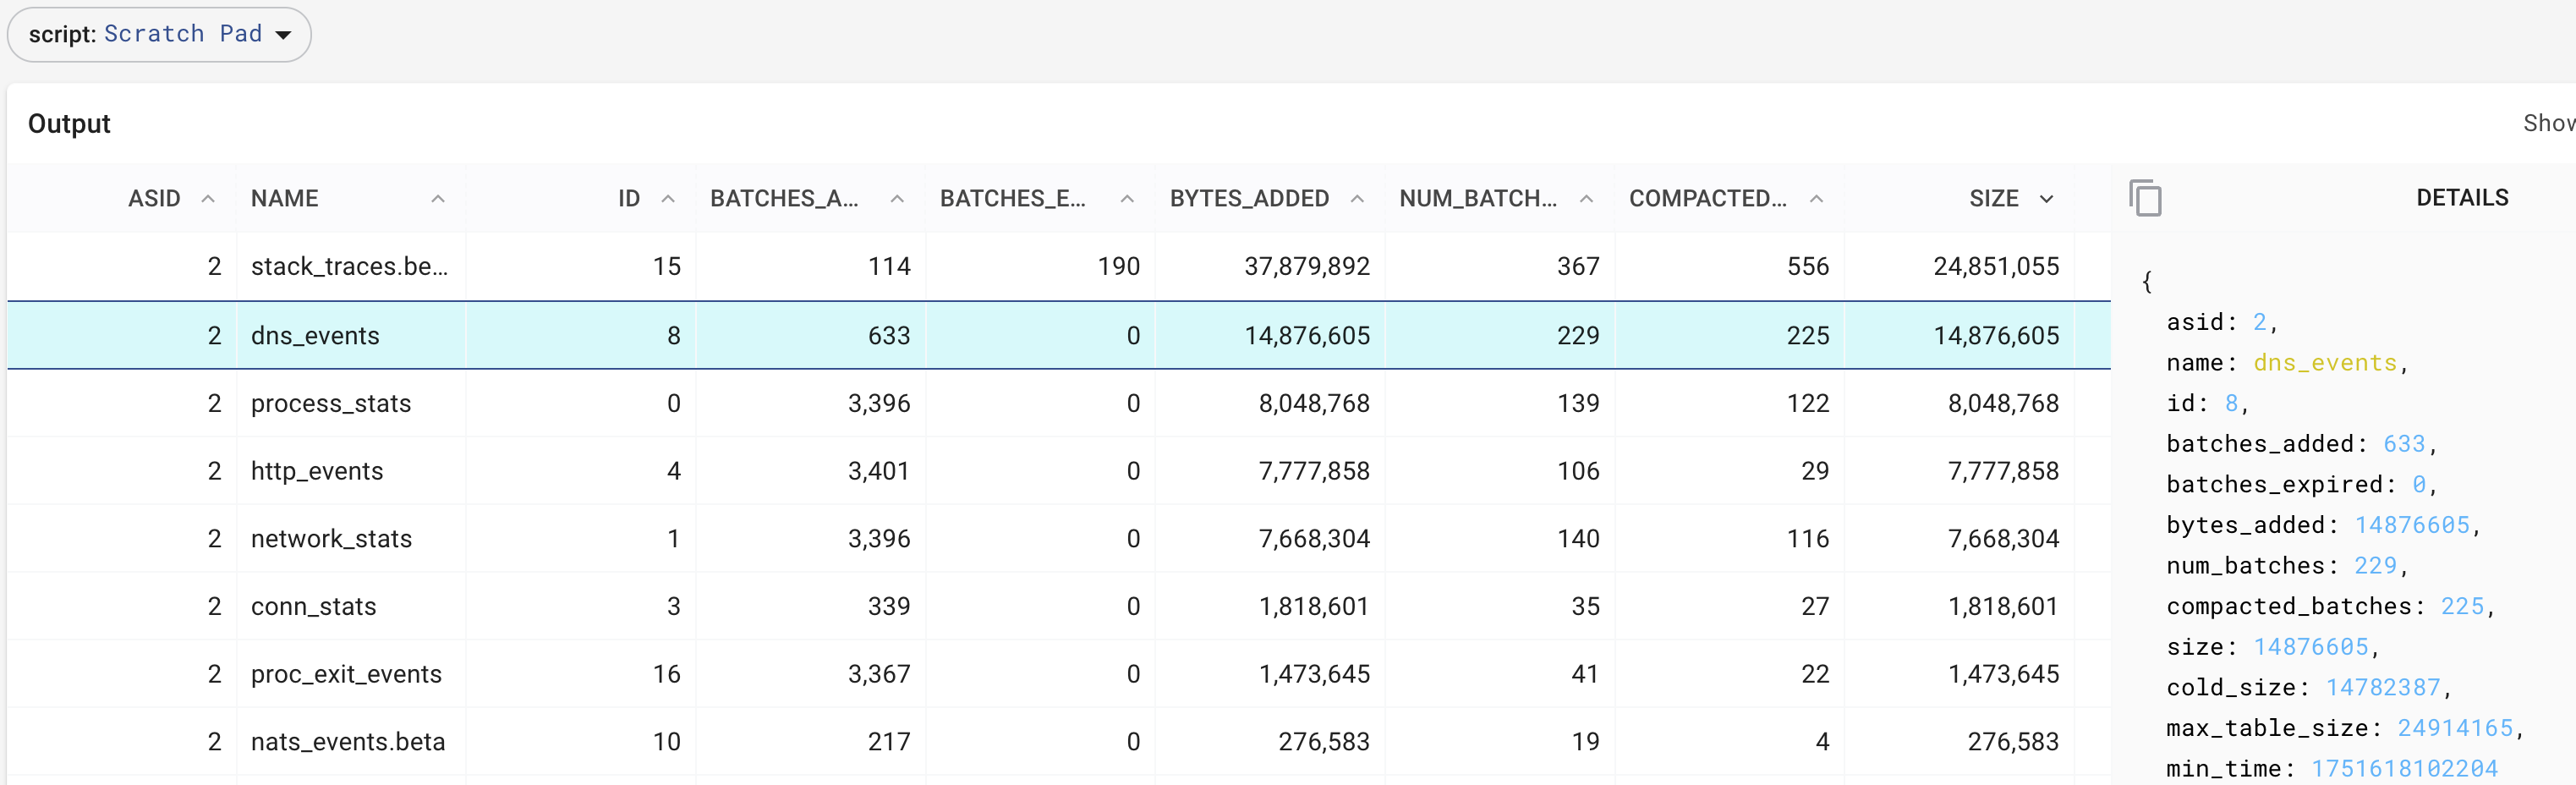
Retrieving the sizes of the in-memory tables in Pixie, which hold the data extracted by eBPF
At this point, you may have a WOW 🤯 moment or at least, see why people call it auto-instrumentation.
What happened just now is the X-ray effect: Suddenly, there are traffic stats and the content of the packets, enriched with meta-data. And it looks like the applications themselves were emitting the information.
What happened - how did this work?
Lets now X-ray the X-ray

Pixie Rocketship and Artwork - modified by ChatGPT - original copyright by the Pixie Authors
We compare the two Linux machines in this lab and infer what the Pixie Edge Modules might be up to.
Install bpftool on all machines 💡
Please use the below commands to install bpftool on cplane-01 (crucial) and dev-machine (for comparison)
cd ~
sudo apt update -y && sudo apt install -y xz-utils libssl-dev binutils build-essential libelf-dev clang llvm binutils-dev libpcap-dev tcpdump && sudo modprobe kheaders &&\
sudo mkdir -p /usr/src/linux &&\
cd /usr/src/linux &&\
sudo tar -xvf /sys/kernel/kheaders.tar.xz > /dev/null &&\
sudo ln -sf /usr/src/kernels/ /lib/modules/6.1.141/build

cd ~
git clone --recurse-submodules https://github.com/libbpf/bpftool.git
cd bpftool/src
 make
sudo make install
Open shells on both machines, please:
sudo bpftool prog list
sudo bpftool map list
sudo bpftool perf
The output of the above commands on the cplane-01 node, where pixie is running, is significantly longer than on the dev-machine.
The reason is that the dev-machine has no eBPF running on it.
laborant@cplane-01:src$ sudo bpftool perf
pid 8205  fd 53: prog_id 278  kprobe  func __x64_sys_connect  offset 0
pid 8205  fd 55: prog_id 279  kretprobe  func __x64_sys_connect  offset 0
pid 8205  fd 57: prog_id 280  kprobe  func __x64_sys_accept  offset 0
pid 8205  fd 59: prog_id 281  kretprobe  func __x64_sys_accept  offset 0
pid 6664  fd 188: prog_id 198  raw_tracepoint  sys_enter
pid 8205  fd 61: prog_id 282  kprobe  func __x64_sys_accept4  offset 0
pid 8205  fd 63: prog_id 283  kretprobe  func __x64_sys_accept4  offset 0
pid 8205  fd 163: prog_id 318  uprobe  filename /app/src/vizier/services/agent/pem/pem.runfiles/px/pem  offset 40582560
pid 8205  fd 183: prog_id 320  tracepoint  sched_process_exit
pid 8205  fd 485: prog_id 362  uprobe  filename /proc/542805/root/usr/lib/x86_64-linux-gnu/libssl.so.3  offset 222784
pid 8205  fd 486: prog_id 384  uretprobe  filename /proc/542805/root/usr/lib/x86_64-linux-gnu/libssl.so.3  offset 222784
...
So, there are apparently programs prog_id injected into the kernel (which we can see as file-descriptors fd), they have processes in user-space (pid)
that are listening on the data streamed by the eBPF programs.
We can also see, there are different types kprobe, tracepoint, uprobe . And: those seem to naturally occur in a normal way and ret way like kretprobe and uretprobe .
Then there are tracepoint, they are either raw or well done . ;)
And then there seems to be something with all those offsets.
We need more information
How about we start looking at things with familiar names, like send
sudo bpftool prog lis |grep send -A 3
489: kprobe  name syscall__probe_entry_send  tag 94ffe35598032b0f  gpl
        loaded_at 2025-06-30T09:50:04+0000  uid 0
        xlated 1216B  jited 784B  memlock 4096B  map_ids 276,275,283,278
        btf_id 309
490: kprobe  name syscall__probe_ret_send  tag 5c4947ace1e176d5  gpl
        loaded_at 2025-06-30T09:50:04+0000  uid 0
        xlated 44432B  jited 27877B  memlock 45056B  map_ids 278,270,283,282,284,272,288,271,286
        btf_id 309
491: kprobe  name syscall__probe_entry_sendto  tag 3de2f77cb59ef762  gpl
        loaded_at 2025-06-30T09:50:04+0000  uid 0
        xlated 1392B  jited 895B  memlock 4096B  map_ids 276,275,283,280,278
        btf_id 309
492: kprobe  name syscall__probe_ret_sendto  tag 02bb6cd5d560bf46  gpl
        loaded_at 2025-06-30T09:50:04+0000  uid 0
        xlated 47376B  jited 29630B  memlock 49152B  map_ids 280,270,283,287,278,282,284,272,288,271,286
        btf_id 309
Still rather cryptic, well, but we can use some pure logic here: if we have a program, especially if written in C, that is getting
data out of the kernel somehow by attaching these entry/ret probes, well the C compiler probably insisted on a data-structure to be defined to pull
the data out.
So, we have so far found that there are hook-points of different type and we conjecture there must be data structs to funnel the data out.
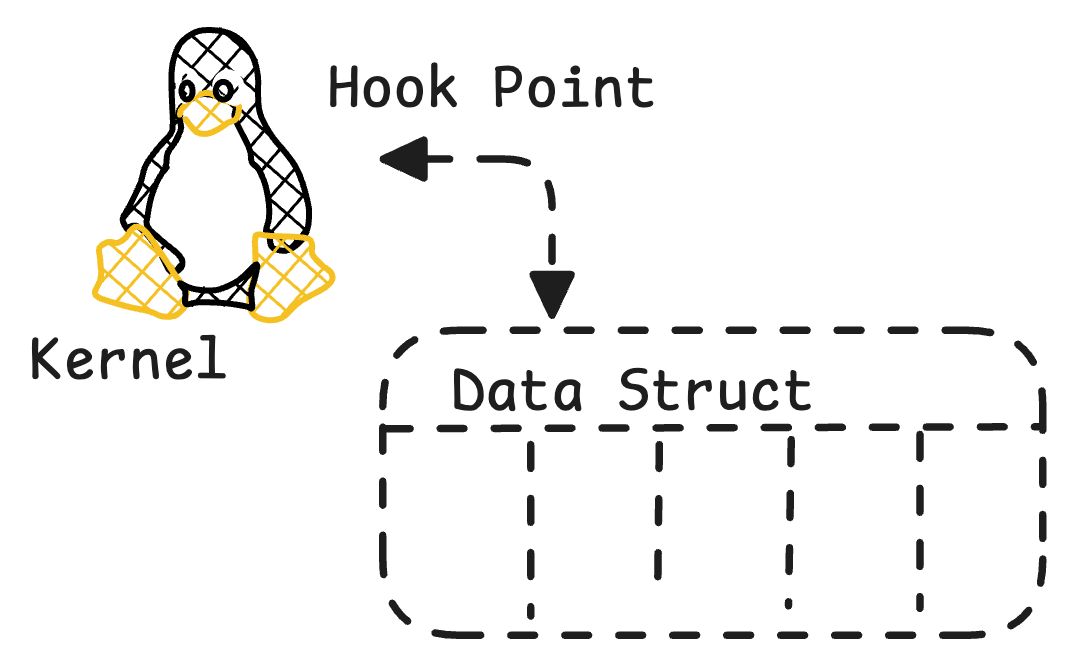
Important: The eBPF programms define:
- hook points to be attached to, to listen for events
- data-structures to be extracted
Once the data is extracted, in userland an application like Pixie UI can consume the data and produce all those beautiful graphs and tables.
Can I see this data that is being collected?
We can use the map_ids from bpftool prog list and display what is in those "maps". So, pick some integers:
sudo bpftool map dump id 283
Example TCP 💡
The integer 283 will likely have different content, please consult the output of sudo bpftool prog list
{
        "key": 1046949818007559,
        "value": {
            "conn_id": {
                "upid": {
                    "": {
                        "pid": 243762,
                        "tgid": 243762
                    },
                    "start_time_ticks": 1760046
                },
                "fd": 7,
                "tsid": 17600461614827
            },
            "laddr": {
                "sa": {
                    "sa_family": 255,
                    "": {
                        "sa_data_min": "",
                        "": {
                            "__empty_sa_data": {},
                            "sa_data": []
                        }
                    }
                },
                "in4": {
                    "sin_family": 255,
                    "sin_port": 0,
                    "sin_addr": {
                        "s_addr": 0
                    },
                    "__pad": [0,0,0,0,0,0,0,0
                    ]
                },
                "in6": {
                    "sin6_family": 255,
                    "sin6_port": 0,
                    "sin6_flowinfo": 0,
                    "sin6_addr": {
                        "in6_u": {
                            "u6_addr8": [0,0,0,0,0,0,0,0,0,0,0,0,0,0,0,0
                            ],
                            "u6_addr16": [0,0,0,0,0,0,0,0
                            ],
                            "u6_addr32": [0,0,0,0
                            ]
                        }
                    },
                    "sin6_scope_id": 0
                }
            },
            "raddr": {
                "sa": {
                    "sa_family": 255,
                    "": {
                        "sa_data_min": "",
                        "": {
                            "__empty_sa_data": {},
                            "sa_data": []
                        }
                    }
                },
                "in4": {
                    "sin_family": 255,
                    "sin_port": 0,
                    "sin_addr": {
                        "s_addr": 0
                    },
                    "__pad": [0,0,0,0,0,0,0,0
                    ]
                },
                "in6": {
                    "sin6_family": 255,
                    "sin6_port": 0,
                    "sin6_flowinfo": 0,
                    "sin6_addr": {
                        "in6_u": {
                            "u6_addr8": [0,0,0,0,0,0,0,0,0,0,0,0,0,0,0,0
                            ],
                            "u6_addr16": [0,0,0,0,0,0,0,0
                            ],
                            "u6_addr32": [0,0,0,0
                            ]
                        }
                    },
                    "sin6_scope_id": 0
                }
            },
            "protocol": "kProtocolUnknown",
            "role": "kRoleUnknown",
            "ssl": false,
            "ssl_source": "kSSLNone",
            "wr_bytes": 8,
            "rd_bytes": 0,
            "last_reported_bytes": 0,
            "app_wr_bytes": 0,
            "app_rd_bytes": 0,
            "protocol_match_count": 0,
            "protocol_total_count": 2,
            "prev_count": 4,
            "prev_buf": "",
            "prepend_length_header": false
        }
    }
Some of these maps will be empty, but you will surely find quite a range of data content in these maps.
Does it work for HTTP, too?
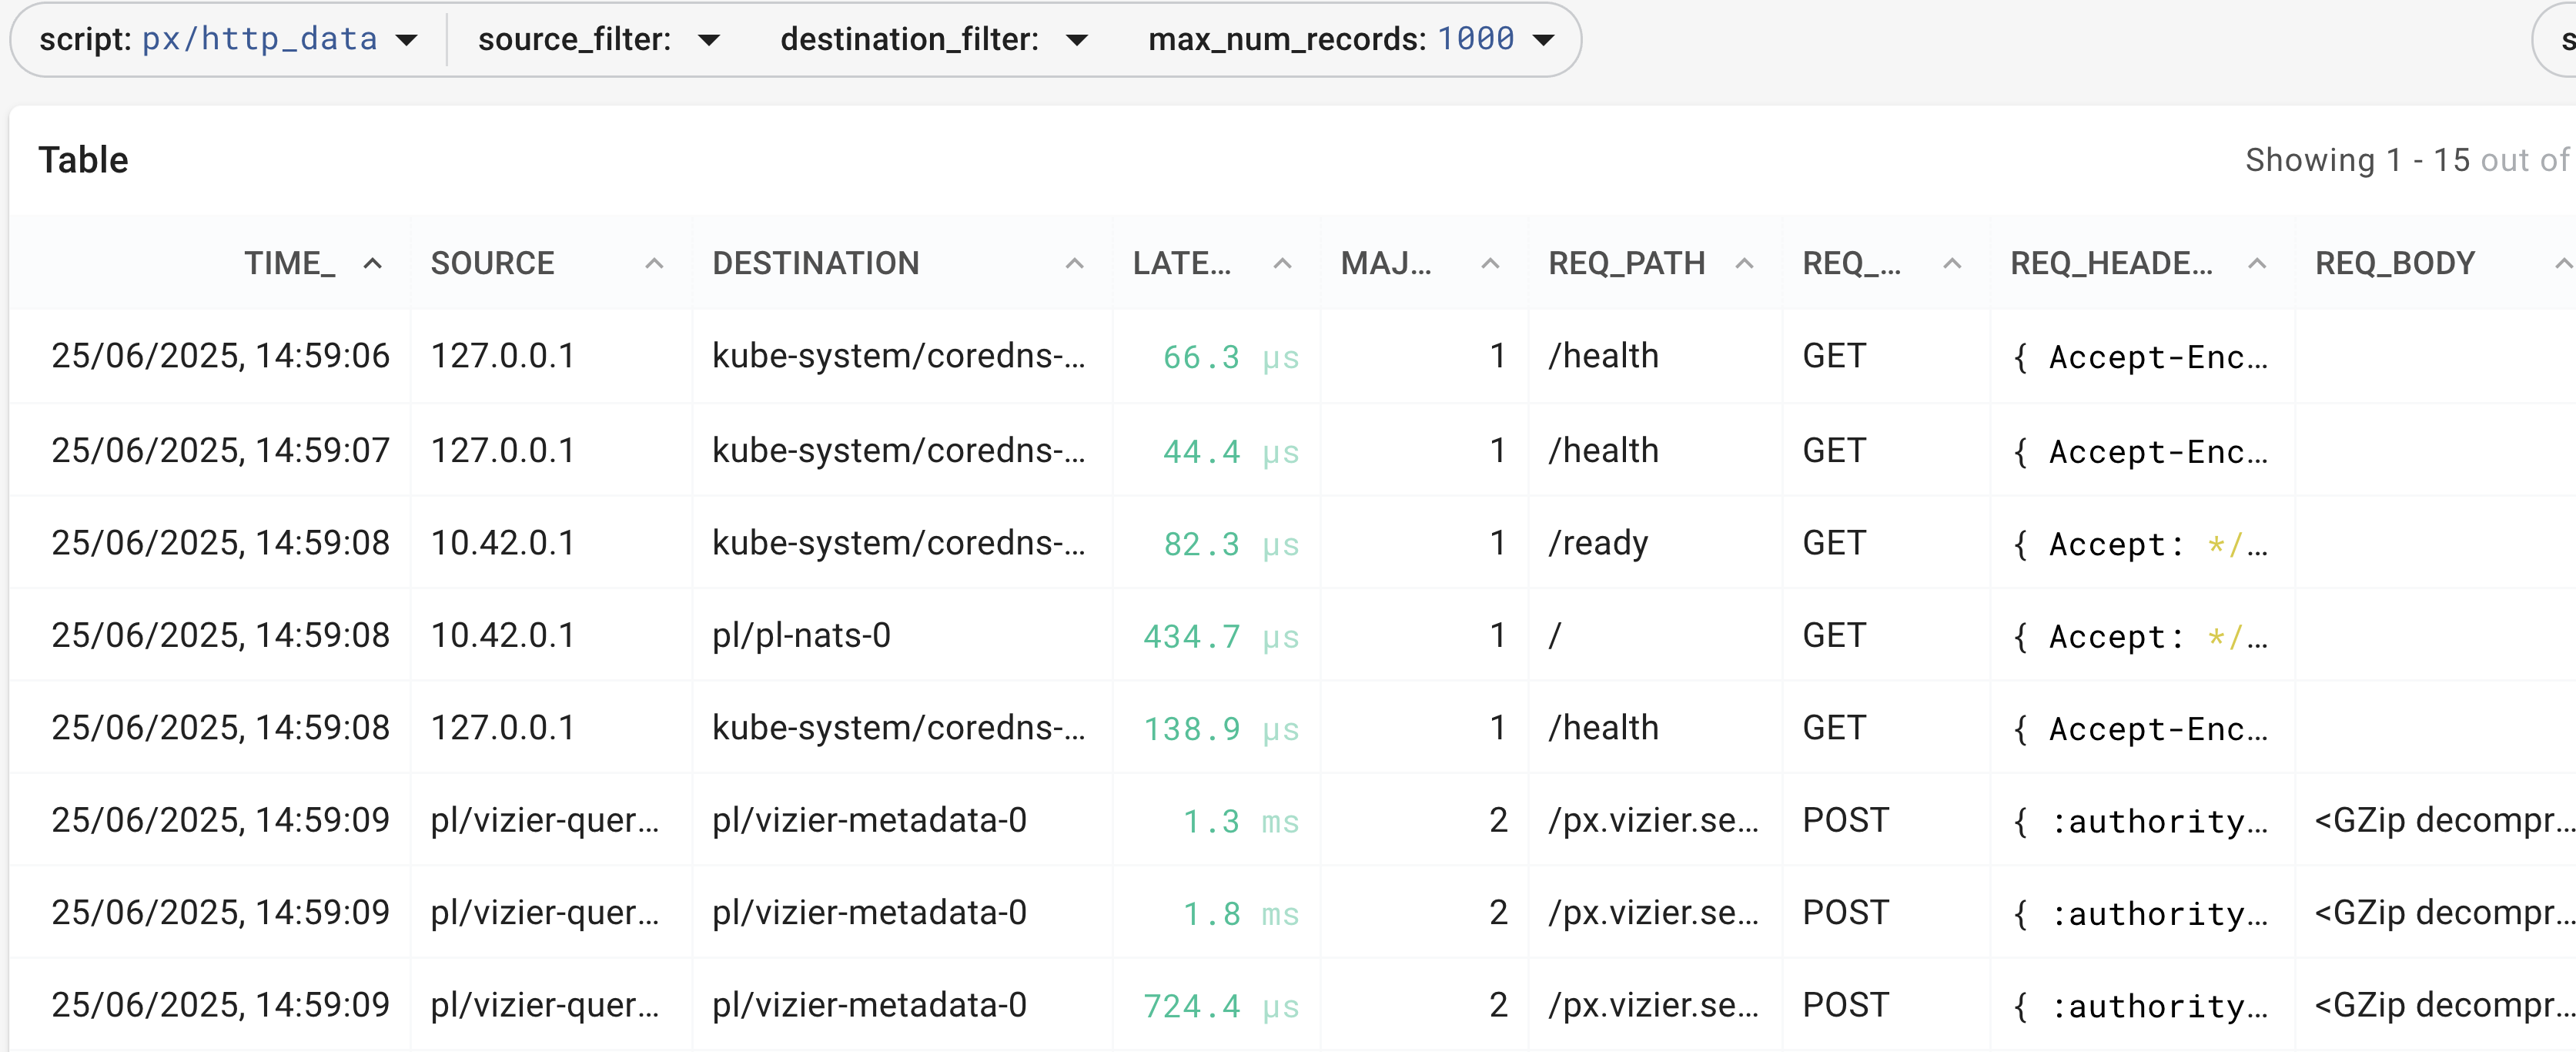
Navigate via the dropdown to the px/http_data script, or any other that has http in the name. You'll see the content, header, user-agent
and other typical HTTP properties:
We will come back to HTTP, when we cover HTTPS/TLS. Feel free to explore Pixie at your leisure...
PxL script and visual Queries in Pixie 💡
Navigate to px/http_post_requests and click the Edit feature on the top right of the UI allows you to change the display/query.
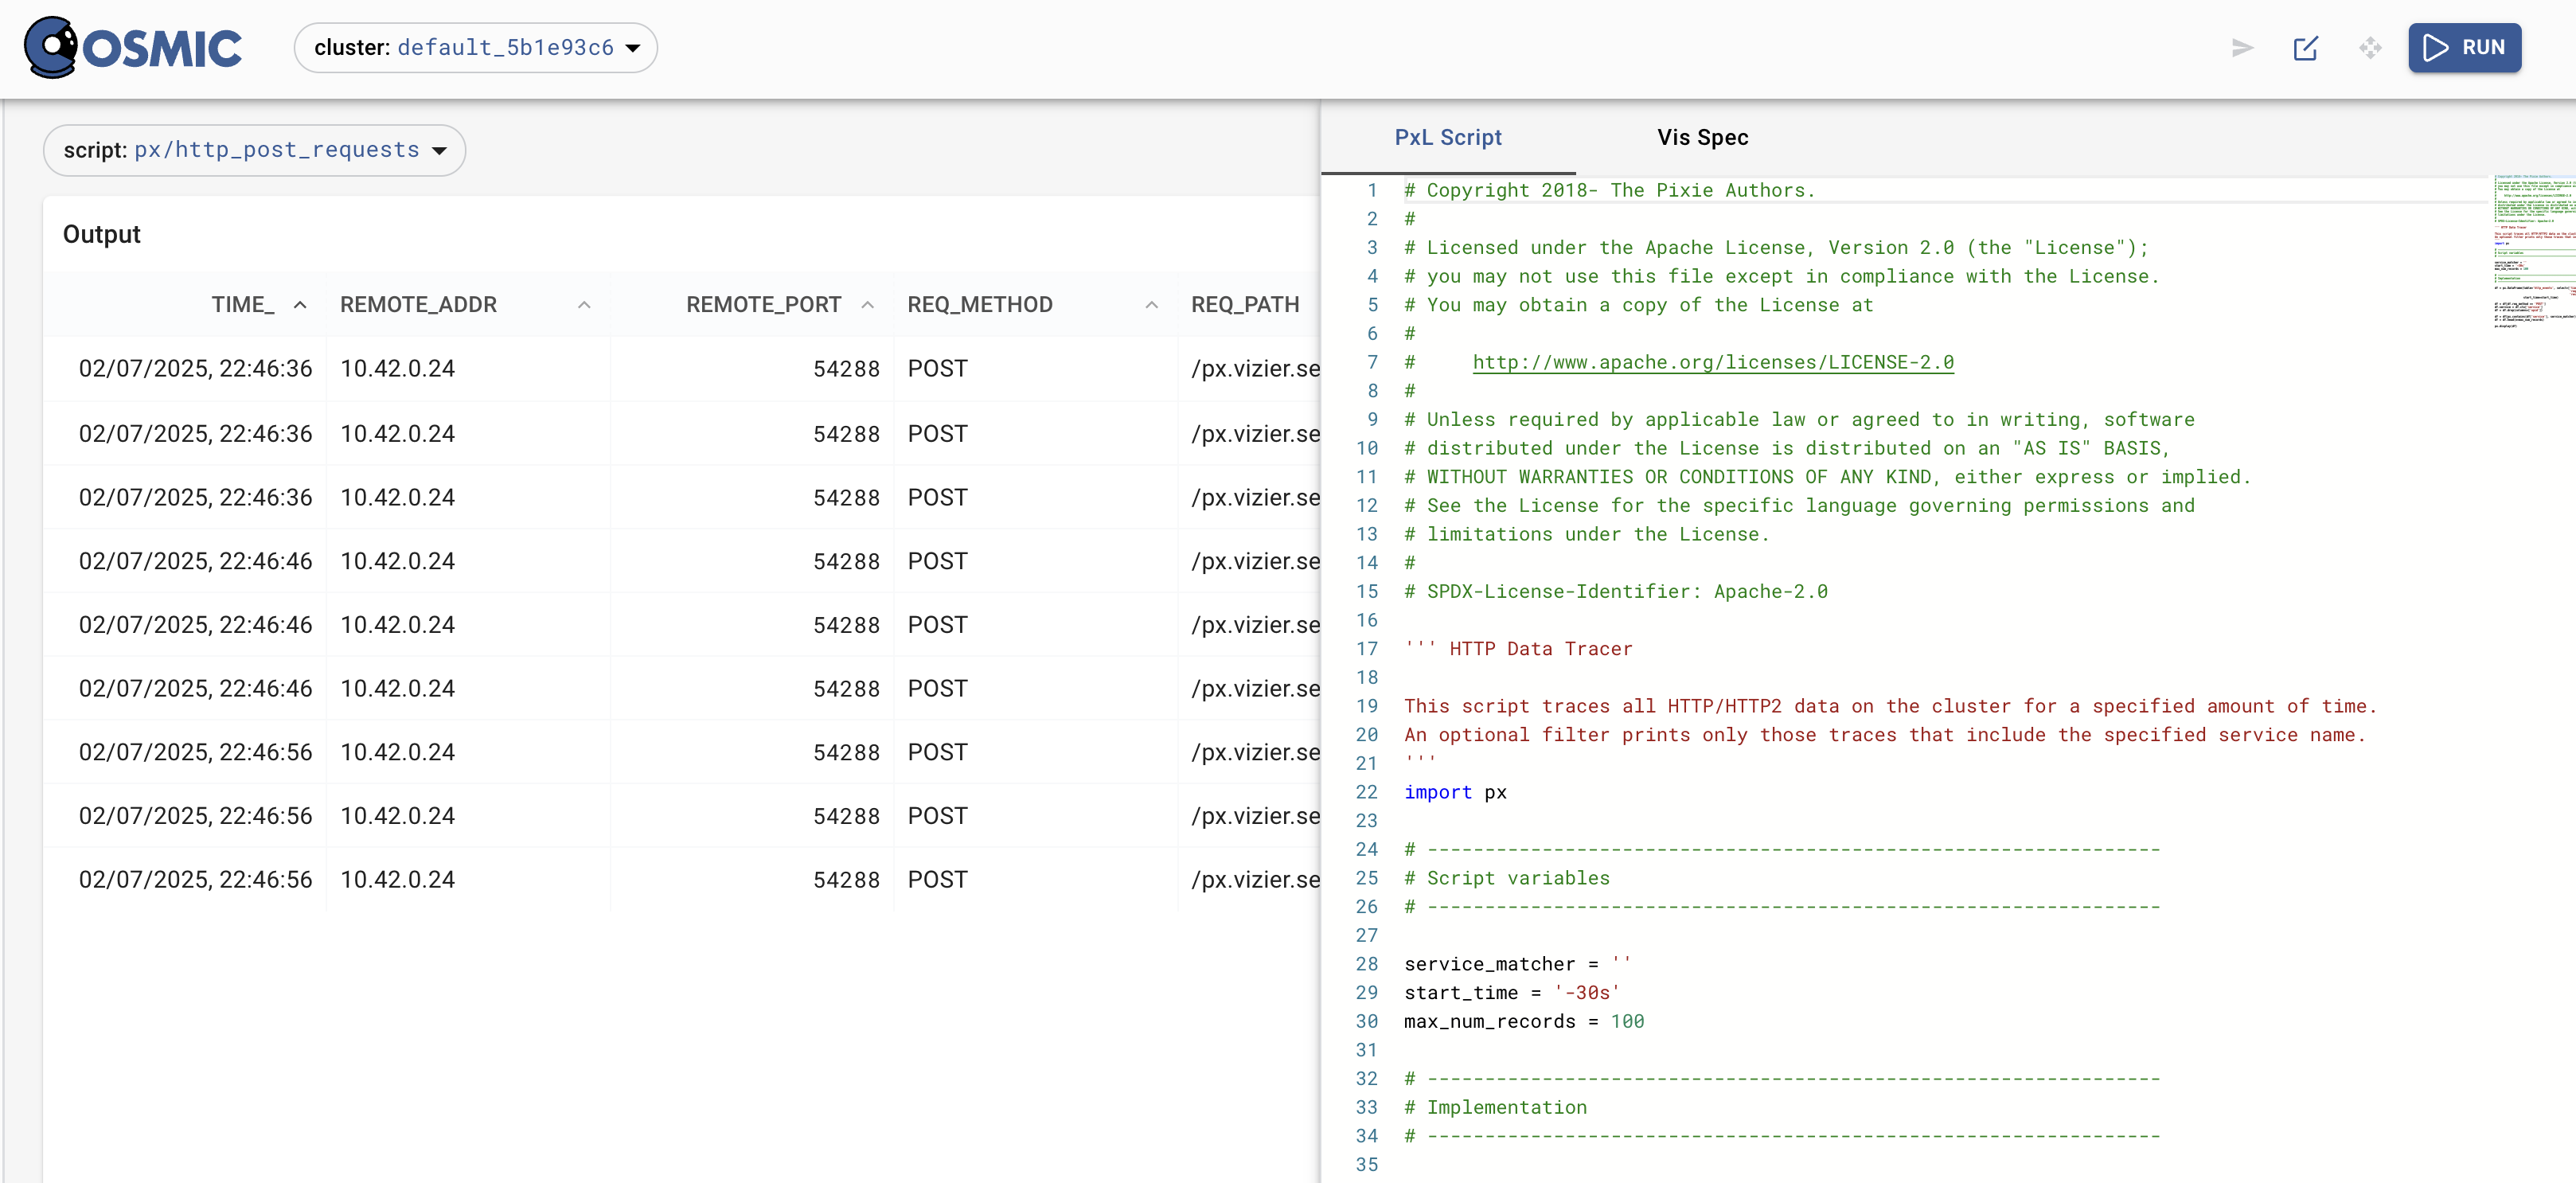
Familiarize yourself with the concept of df aka Dataframe by modifying the PxL script, executing it and receiving something meaningful.
You may see similarities with pandas and the PxL script is powerful (it has a learning curve, though)
But but but, how does it (protocol inference) work?
Above, these eBPF-maps contained more or less readable data captured from the different kernel probes, e.g.
{...
"protocol": "kProtocolDNS",
"role": "kRoleClient",
"direction": "kEgress",
"ssl": false,
"ssl_source": "kSSLNone",
"source_fn": "kSyscallSendMMsg"
  },
    "msg": [-33,114,1,0,0,1,0,0,0,0,0,0,3,119,104,121,3,100,105,100,3,116,104,101,10,112,114,111,103,114,97,109,109,101,114,4,113,117,105,116,3,104,105,115,3,106,111,98,7,98,101,99,97,117,115,101,2,104,101,5,...
You may have noticed protocol attributions in the above data-maps , their definitions are here.
//.../socket_tracer/bcc_bpf_intf/common.h
enum traffic_protocol_t {
  kProtocolUnknown = 0,
  kProtocolHTTP = 1,
  kProtocolHTTP2 = 2,
  kProtocolMySQL = 3,
  kProtocolCQL = 4,
  kProtocolPGSQL = 5,
  kProtocolDNS = 6,
  kProtocolRedis = 7,
  kProtocolNATS = 8,
  kProtocolMongo = 9,
  kProtocolKafka = 10,
  kProtocolMux = 11,
  kProtocolAMQP = 12,
  kProtocolTLS = 13,
};

struct protocol_message_t {
  enum traffic_protocol_t protocol;
  enum message_type_t type;
};
This still doesn't tell us how Pixie derives those protocols, though. If we look at the actual Pixie DNS Source code, we get more clues:
// Each protocol should define a struct called defining its protocol traits.
// This ProtocolTraits struct should define the following types:
// - frame_type: This is the low-level frame to which the raw data is parsed.
//               Examples: http::Message, cql::Frame, mysql::Packet
// - state_type: This is state struct that contains any relevant state for the protocol.
//               The state_type must have three members: global, send and recv.
//               A convenience NoState struct is defined for any protocols that have no state.
// - record_type: This is the request response pair, the content of which has been interpreted.
//                This struct will be passed to the SocketTraceConnector to be appended to the
//                appropriate table.
//
// Example for HTTP protocol:
//
// namespace http {
// struct ProtocolTraits {
//   using frame_type = Message;
//   using record_type = Record;
//   using state_type = NoState;
// };
// }
//
// Note that the ProtocolTraits are hooked into the SocketTraceConnector through the
// protocol_transfer_specs.


#include "src/stirling/source_connectors/socket_tracer/protocols/common/event_parser.h"  // For FrameBase.


// Flags in the DNS header:
// +--+--+--+--+--+--+--+--+--+--+--+--+--+--+--+--+
// |QR|   Opcode  |AA|TC|RD|RA| Z|AD|CD|   RCODE   |
// +--+--+--+--+--+--+--+--+--+--+--+--+--+--+--+--+

#define EXTRACT_DNS_FLAG(flags, pos, width) ((flags >> pos) & ((1 << width) - 1))
// A DNSRecord represents a DNS resource record
// Typically it is the answer to a query (e.g. from name->addr).
// Spec: https://www.ietf.org/rfc/rfc1035.txt
struct DNSRecord {
  std::string name;

  // cname and addr are mutually exclusive.
  // Either a record provdes a cname (an alias to another record), or it resolves the address.
  std::string cname;
  InetAddr addr;
};

struct Frame : public FrameBase {
  DNSHeader header;
  const std::vector<DNSRecord>& records() const { return records_; }
  bool consumed = false;

  void AddRecords(std::vector<DNSRecord>&& records) {
    for (const auto& r : records) {
      records_size_ += r.name.size() + r.cname.size() + sizeof(r.addr);
    }
    records_ = std::move(records);
  }

  size_t ByteSize() const override { return sizeof(Frame) + records_size_; }

 private:
  std::vector<DNSRecord> records_;
  size_t records_size_ = 0;
};
For each event that comes over a socket, a protocol type is inferred. Given that characteristics such as headers the underlying protocols
are very well known (e.g. RFC 1035 for DNS), these patterns are overlayed, allowing the socket_tracer
to translate the raw data into the interpreted protocol.
Does this always work? 💡
This does not always work and there may be mis-attributions, which why realistic test data is required to
have an anticipation of which conditions lead to non-identification or confusion.
Exercise
- Find a DNS request in an eBPF map
- How do you know it's DNS and not something else?
- Draw your understanding of how this data was extracted on a napkin or the back of an envelope
- Why is DNS such a valuable protocol for security defense?
- Advanced: Try spoofing DNS and catching yourself
Conclusions
🪄 Magic works 🪄 - sprinkling Pixie dust ✨ and there was the traffic

So far, we found out that eBPF is an event-driven method that allows attaching hooks to the kernel to extract data via maps. And, once in userspace, applications can use and display those data.
- We didn't make any changes to any applications, we deployed Pixie, specifically the Pixie-Edge-Module and the traffic appeared.
- By comparing a
nakedlinux with the one Pixie was deployed on, we saw there were different types of probes most notablykprobes,tracepointsanduprobes. - The source code hinted that the type of traffic is inferred and overlayed like a pattern over a stream of data.
🌟 This week's special thanks 🌟:
...go to Dom Delnano for being so patient and always graceful 🙏
Next week:
Do you have the feeling we barely scratched the surface?
Next week, we will be X-raying Databases and see inserts/deletions, connection-strings being passed and listen to DBs chatter internally and while we decipher kafkaesk behavior, we ll also explore what the different types of eBPF-probes are.
Footnotes
Footnotes
- See caveat about not writing production eBPF yourself, as there are hard problems like misattribution across protocols, keeping state and ordering frames ↩
- Cloud Native Compute Foundation ↩
- Depending on where you deploy the
Pixie Cloud, you can also keep the analysis and display inside your datacenter ↩
X-raying Databases with Pixie - Redis
Welcome back !
We just saw the absolute minimum of what Pixie could do by leveraging eBPF:
As a user-space application, it was able to interpret the data extraced from the kernel and give us humans an easy-to-digest SQL-like access.
Network protocols are somewhat obvious to trace, because we know exactly what to expect over "the wire" : there are RFCs and because of the critical importance of .e.g. TCP guarantees, complications like vendors inventing custom dialects are very rare.
Databases are a common type of object with which applications communicate and where there is a well-defined protocol. Also, from a security perspective, these communications tend to be very interesting. However, here vendors can take liberties, as we shall see shortly...
See a Key Value Database
redis is synonymous with a key value database, even though its modern form has many additional features. We'll focus on the original functionality of setting and getting keys paired with values so-called KV-pairs
Let s deploy two redis containers one as DB and one as client 💡
git clone https://github.com/k8sstormcenter/honeycluster
cd /home/laborant/honeycluster
helm repo add bitnami https://charts.bitnami.com/bitnami
helm repo update
helm upgrade --install redis-db bitnami/redis -n redis-db --create-namespace --values lightening-rod/redis/values.yaml
helm upgrade --install redis-client bitnami/redis -n redis-client --create-namespace --values lightening-rod/redis/values.yaml
We grab a relevant IP into our env variables, like so:
kubectl get  svc -n redis-db
export svcIP=$(kubectl get  svc redis-db-master -n redis-db -o jsonpath='{.spec.clusterIP}')
So now we can directly connect into the DB, which we treat as our client:
kubectl exec --tty -i redis-client-master-0 --namespace redis-client -- redis-cli -h $svcIP -p 6379
You may now perform some DB operations
set servus everyone
get servus
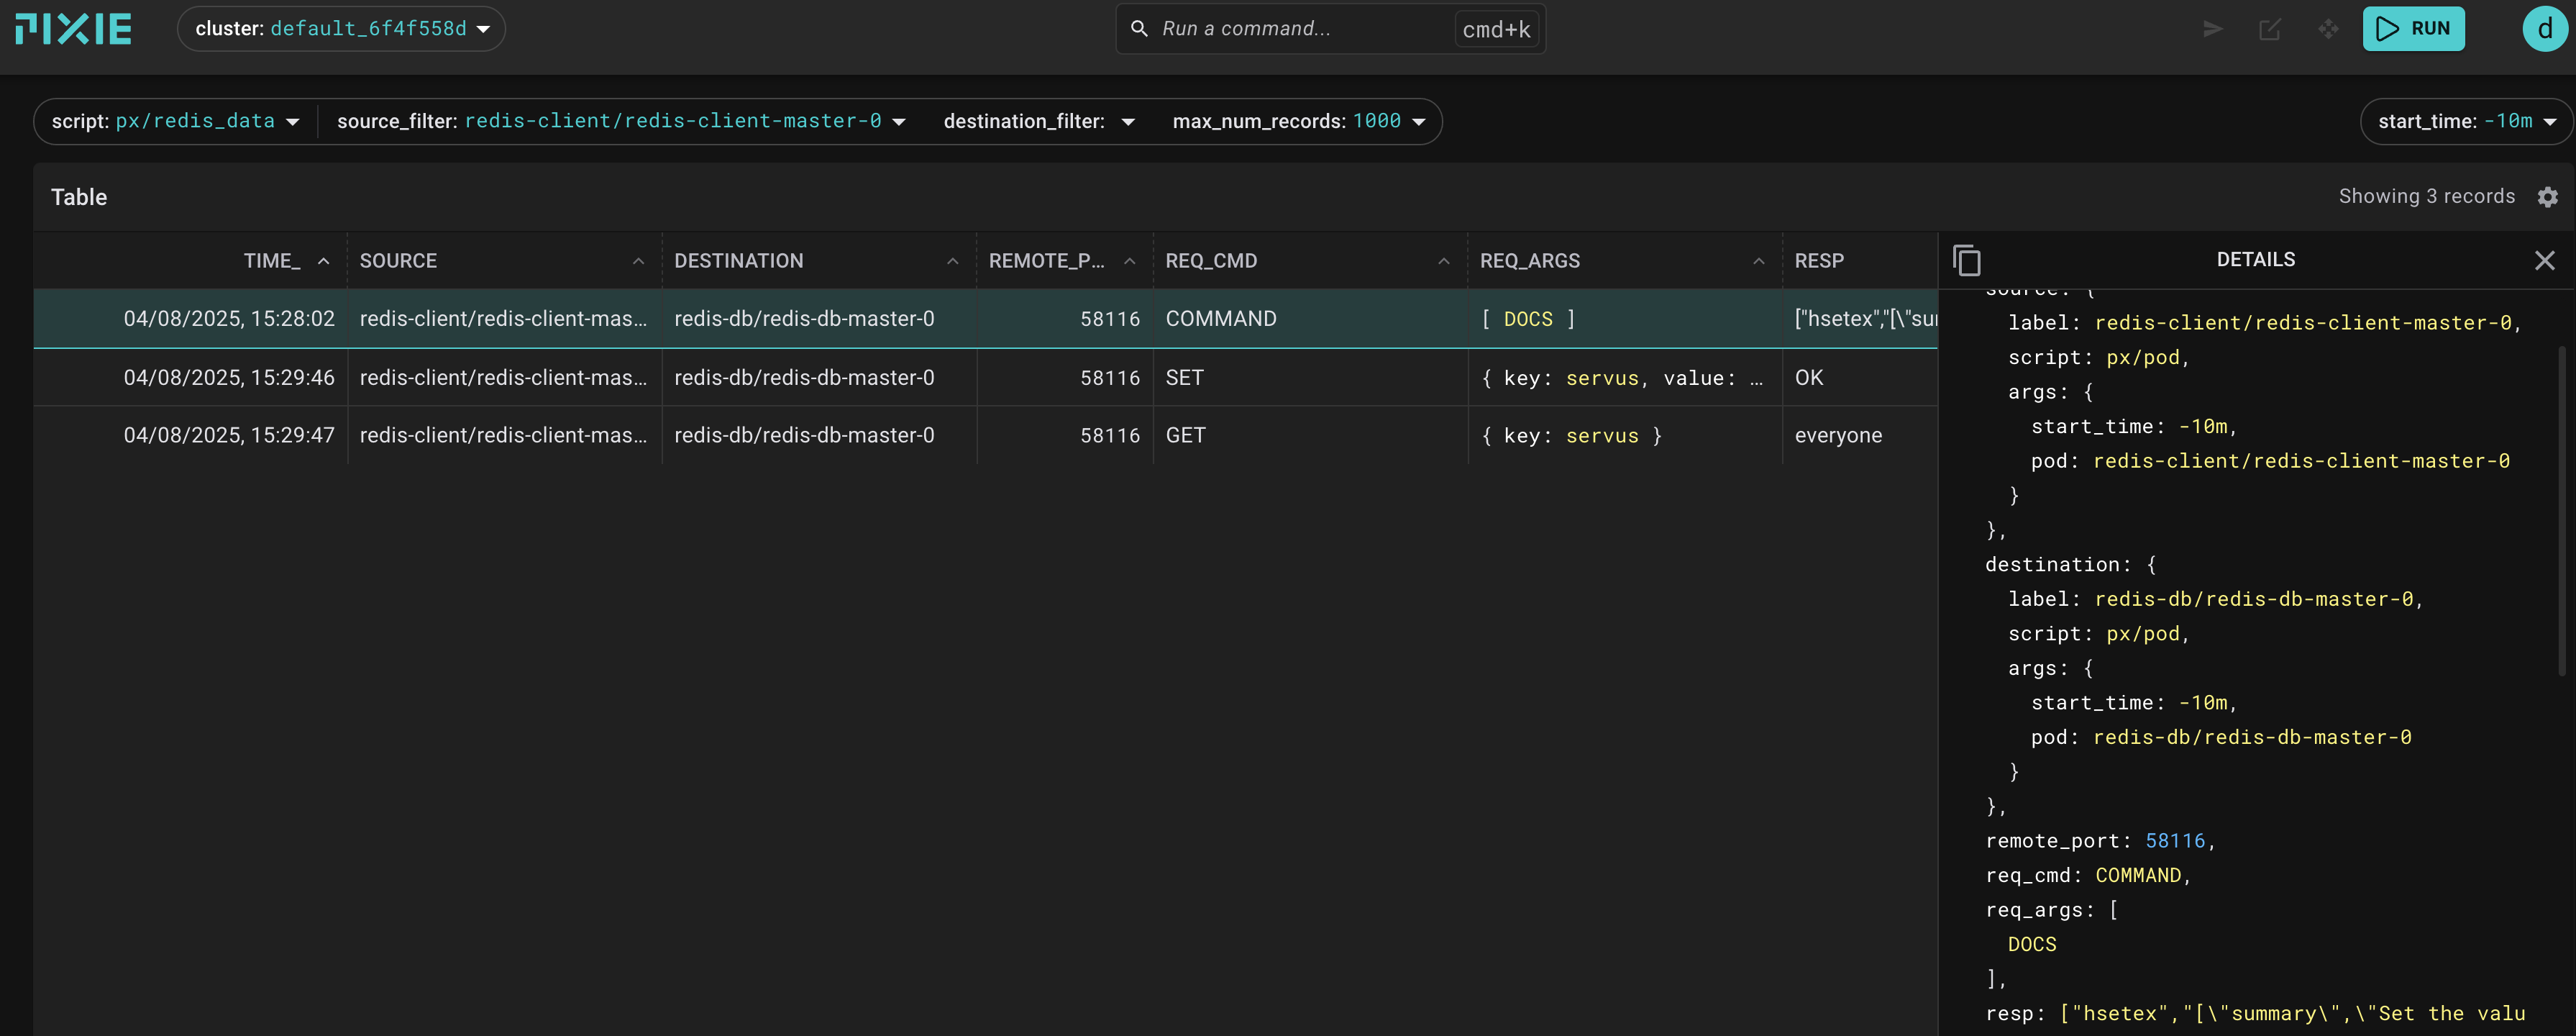
let's go over to the pixie UI and navigate to px/redis_data. You can generate the link to the correct query
by running
px run px/redis_data
and following the
==> Live UI: https://work.withpixie.ai:443/live/clusters/default_......
Exercise: Your may prefer to filter the Source Column to redis-client/redis-client-master-0:
you should find three entries recognizing our connection, otherwise most of what you see are liveness-probes
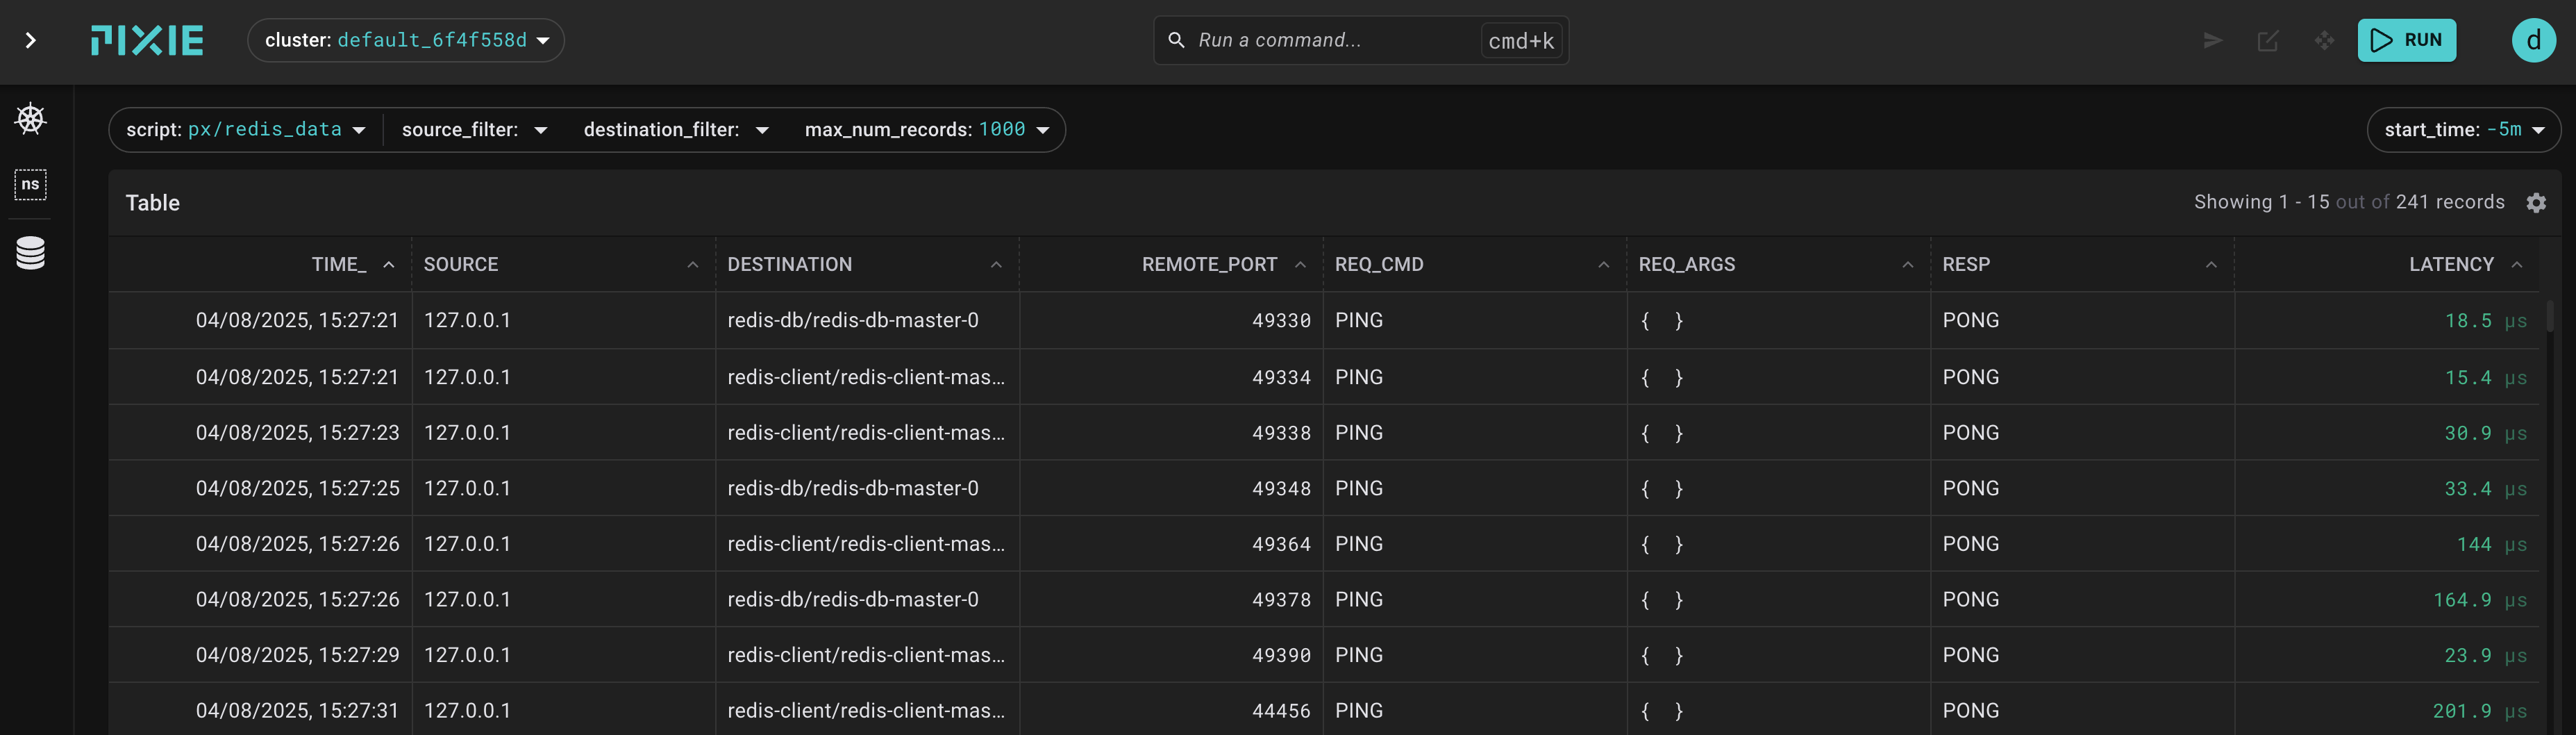
After the filter, things are a lot clearer:
Redis Connection in Pixie 💡
{
  "time_": 1746561537167,
  "source": {
    "label": "redis-db/redis-db-master-0",
    "script": "px/pod",
    "args": {
      "start_time": "-5m",
      "pod": "redis-db/redis-db-master-0"
    }
  },
  "destination": {
    "label": "redis-client/redis-client-master-0",
    "script": "px/pod",
    "args": {
      "start_time": "-5m",
      "pod": "redis-client/redis-client-master-0"
    }
  },
  "remote_port": 56940,
  "req_cmd": "GEOPOS",
  "req_args": "{\"key\":\"[\\\"summary\\\",\\\"Returns the longitude and latitude of members from a geospatial index.\\\",\\\"since\\\",\\\"3.2.0\\\",\\\"group\\\",\\\"geo\\\",\\\"complexity\\\",\\\"O(1) for each member requested.\\\",\\\"arguments\\\",\\\"[\\\\\\\"[\\\\\\\\\\\\\\\"name\\\\\\\\\\\\\\\",\\\\\\\\\\\\\\\"key\\\\\\\\\\\\\\\",\\\\\\\\\\\\\\\"type\\\\\\\\\\\\\\\",\\\\\\\\\\\\\\\"key\\\\\\\\\\\\\\\",\\\\\\\\\\\\\\\"display_text\\\\\\\\\\\\\\\",\\\\\\\\\\\\\\\"key\\\\\\\\\\\\\\\",\\\\\\\\\\\\\\\"key_spec_index\\\\\\\\\\\\\\\",\\\\\\\\\\\\\\\"0\\\\\\\\\\\\\\\"]\\\\\\\",\\\\\\\"[\\\\\\\\\\\\\\\"name\\\\\\\\\\\\\\\",\\\\\\\\\\\\\\\"member\\\\\\\\\\\\\\\",\\\\\\\\\\\\\\\"type\\\\\\\\\\\\\\\",\\\\\\\\\\\\\\\"string\\\\\\\\\\\\\\\",\\\\\\\\\\\\\\\"display_text\\\\\\\\\\\\\\\",\\\\\\\\\\\\\\\"member\\\\\\\\\\\\\\\",\\\\\\\\\\\\\\\"flags\\\\\\\\\\\\\\\",\\\\\\\\\\\\\\\"[\\\\\\\\\\\\\\\\\\\\\\\\\\\\\\\"optional\\\\\\\\\\\\\\\\\\\\\\\\\\\\\\\",\\\\\\\\\\\\\\\\\\\\\\\\\\\\\\\"multiple\\\\\\\\\\\\\\\\\\\\\\\\\\\\\\\"]\\\\\\\\\\\\\\\"]\\\\\\\"]\\\"]\",\"member\":[\"sismember\",\"[\\\"summary\\\",\\\"Determines whether a member belongs to a set.\\\",\\\"since\\\",\\\"1.0.0\\\",\\\"group\\\",\\\"set\\\",\\\"complexity\\\",\\\"O(1)\\\",\\\"arguments\\\",\\\"[\\\\\\\"[\\\\\\\\\\\\\\\"name\\\\\\\\\\\\\\\",\\\\\\\\\\\\\\\"key\\\\\\\\\\\\\\\",\\\\\\\\\\\\\\\"type\\\\\\\\\\\\\\\",\\\\\\\\\\\\\\\"key\\\\\\\\\\\\\\\",\\\\\\\\\\\\\\\"display_text\\\\\\\\\\\\\\\",\\\\\\\\\\\\\\\"key\\\\\\\\\\\\\\\",\\\\\\\\\\\\\\\"key_spec_index\\\\\\\\\\\\\\\",\\\\\\\\\\\\\\\"0\\\\\\\\\\\\\\\"]\\\\\\\",... [TRUNCATED]",
  "resp": "",
  "latency": 0
}
{
  "time_": 1746561561652,
  "source": {
    "label": "redis-client/redis-client-master-0",
    "script": "px/pod",
    "args": {
      "start_time": "-5m",
      "pod": "redis-client/redis-client-master-0"
    }
  },
  "destination": {
    "label": "redis-db/redis-db-master-0",
    "script": "px/pod",
    "args": {
      "start_time": "-5m",
      "pod": "redis-db/redis-db-master-0"
    }
  },
  "remote_port": 56940,
  "req_cmd": "GET",
  "req_args": "{\"key\":\"servus\"}",
  "resp": "myvalue",
  "latency": 201305
}
{
  "time_": 1746561560811,
  "source": {
    "label": "redis-client/redis-client-master-0",
    "script": "px/pod",
    "args": {
      "start_time": "-5m",
      "pod": "redis-client/redis-client-master-0"
    }
  },
  "destination": {
    "label": "redis-db/redis-db-master-0",
    "script": "px/pod",
    "args": {
      "start_time": "-5m",
      "pod": "redis-db/redis-db-master-0"
    }
  },
  "remote_port": 56940,
  "req_cmd": "SET",
  "req_args": "{\"key\":\"servus\",\"value\":\"everyone\",\"options\":[]}",
  "resp": "OK",
  "latency": 389584
}
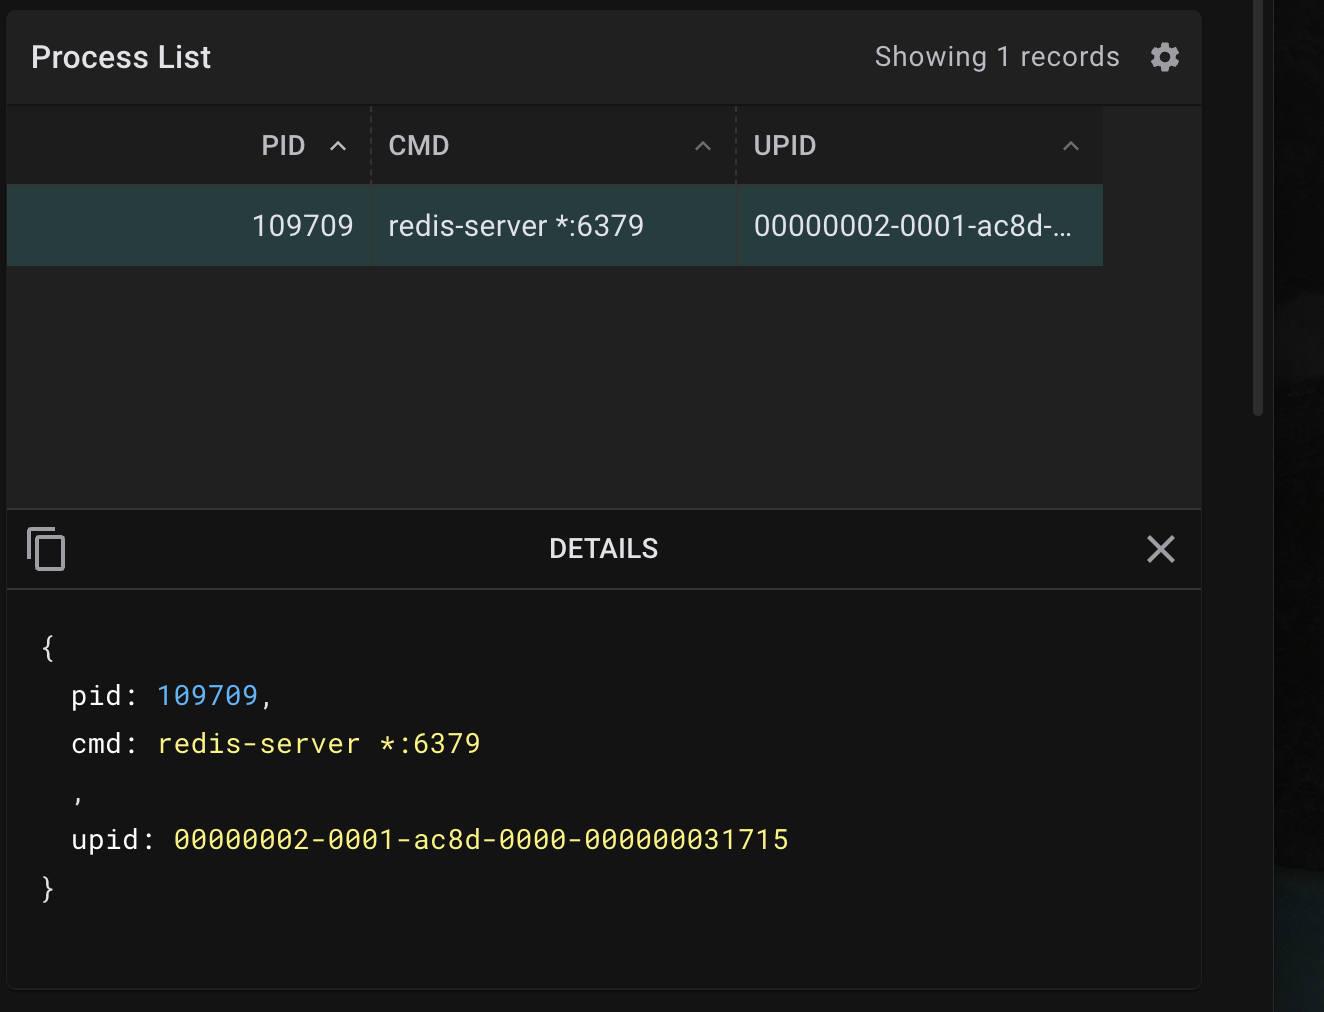
Find the redis CLI process in pixie 💡
If you search around a bit, you ll also discover our cli process
{
  "pid": 109709,
  "cmd": "redis-cli -h 10.43.222.160 -p 6379",
  "upid": "00000002-0000-746b-0000-00000003958d"
}
Exercise :
- Setup redis, shell into it like above
- Try some more commands and find them in the output. Like
INCR myCounterorTTL ebpfIsCool - Find out what the commands really do behind the scenes by inspecting network and database protocols
Trace the redis connection directly on the node
In this case, this is the cplane-01 node, cause thats where the Redis Containers are actually running
Install tcpdump on the `cplane-01` node 💡
sudo apt update && sudo apt install -y tcpdump
sudo tcpdump -i any -A port 6379 -w redis.pcap
Now, back in Terminal dev-machine inside your redis-shell, execute some redis commands:
redis-shell in case you lost it 💡
export svcIP=$(kubectl get  svc redis-db-master -n redis-db -o jsonpath='{.spec.clusterIP}')
kubectl exec --tty -i redis-client-master-0 --namespace redis-client -- redis-cli -h $svcIP -p 6379
10.43.24.11:6379> set servus everyone_again
OK
10.43.24.11:6379> get servus
"everyone_again"
On the cplane-01, kill the packet-capture with CTRL-C and inspect the collected pcap:
tcpdump -r redis.pcap -X
14:49:42.662464 veth6c463fdb P   IP 10.42.0.38.48626 > 10.43.24.11.redis: Flags [P.], seq 231511284:231511318, ack 2160693072, win 1325, options [nop,nop,TS val 303769050 ecr 4168758692], length 34: RESP "set" "servus" "everyone_again"
14:49:42.662487 cni0  Out IP 10.42.0.38.48626 > 10.42.0.37.redis: Flags [P.], seq 231511284:231511318, ack 2160693072, win 1325, options [nop,nop,TS val 303769050 ecr 4168758692], length 34: RESP "set" "servus" "everyone_again"
14:49:45.378037 veth7796faf4 Out IP 10.42.0.38.48626 > 10.42.0.37.redis: Flags [P.], seq 34:59, ack 6, win 1325, options [nop,nop,TS val 303771766 ecr 4168767057], length 25: RESP "get" "servus"
14:49:45.378106 veth7796faf4 P   IP 10.42.0.37.redis > 10.42.0.38.48626: Flags [P.], seq 6:15, ack 59, win 503, options [nop,nop,TS val 4168769772 ecr 303771766], length 9: RESP "everyone_again"
Confusion
Constanze, you said eBPF would see things, we otherwise dont see. But this is already (sort of) readable in plaintext
Key Takeaways
- If you are not encrypting your database traffic -> anyone can sniff it (also without eBPF)
- Yes, for a plaintext protocol like Redis, eBPF is not required
- It is a lot more performant though
- We have multiple context perspectives in the Kernel, and the more we know about what we are looking for, the more concretely we can find and identify it
How did this work?
Exactly like DNS, by protocol inference.
Dialects, you said?
Unlike core network protocols, databases come in flavors, many are forked and re-forked and lots of drama. Point being, it tends to matter, which parts of a database API is considered core and which vendor is implementing it.
In the case of redis, you can try
JSON.SET doc $ '{"foo": "bar"}'
and it will fail in this installation, as the module for documents is not loaded in the standard Helm-chart that we used to install it.
10.43.10.230:6379> JSON.SET doc $ '{"foo": "bar"}'
(error) ERR unknown command 'JSON.SET', with args beginning with: 'doc' '$' '{"foo": "bar"}'
And some implementation of the same 'DB' deviate so far, that you need a seperate interference for the traffic, even if the SQL is similar. SQL is after all
not a standard.
Conclusions
So, this application of eBPF allowed us to read all operations on a Key Value Database in human-friendly form. It also allowed us to correlate between network and database protocols, as we have the data in the same format in the same location.
This is often referred to a single-pane of glass when the user can see data from different sources in the same location. However, eBPF
allowed us to go further and also collect the data at the same source -> it all (DNS, HTTP, Redis) was all just traffic over a socket.
🌟 This week's special thanks 🌟:
...go to Ivan for trouble-shooting the weirdest bugs 🐛 with me and never loosing his high spirits 🙏
Next week:
After redis being one of the simplest DBs that are routinely used in production, we'll look at Kafka next week- which is not simple- not in any way imaginable.
X-raying Databases with Pixie - Kafka
Alright, so much for warm-up, let's get serious.

Apache Kafka or the most cryptic messaging platform. According to Wikipedia its name was chosen as it is optimized for writing
The entire deployment is a pixie demo app and described by the Pixie author's here. I've added lots of commentary, but credit belongs to the original authors.
The following command will take a bit, so let's go ahead and install Pixie's kafka-demo app (original reference)
px demo deploy px-kafka
kubectl get pods -n px-kafka
What is Kafka?
An author that you likely had to read in high-school, famous for a somewhat bizarre approach to literature. Also: a message-queue.
The picture of the demo app describes that Kafka is made up of so-called topics, those can be partitioned, and per partition, there are guarantees such
as ordering. Kafka is not really a database, it is an append-only log. For further reading, I cannot too highly recommend Martin Kleppmann's Designing Data-Intensive Applications.
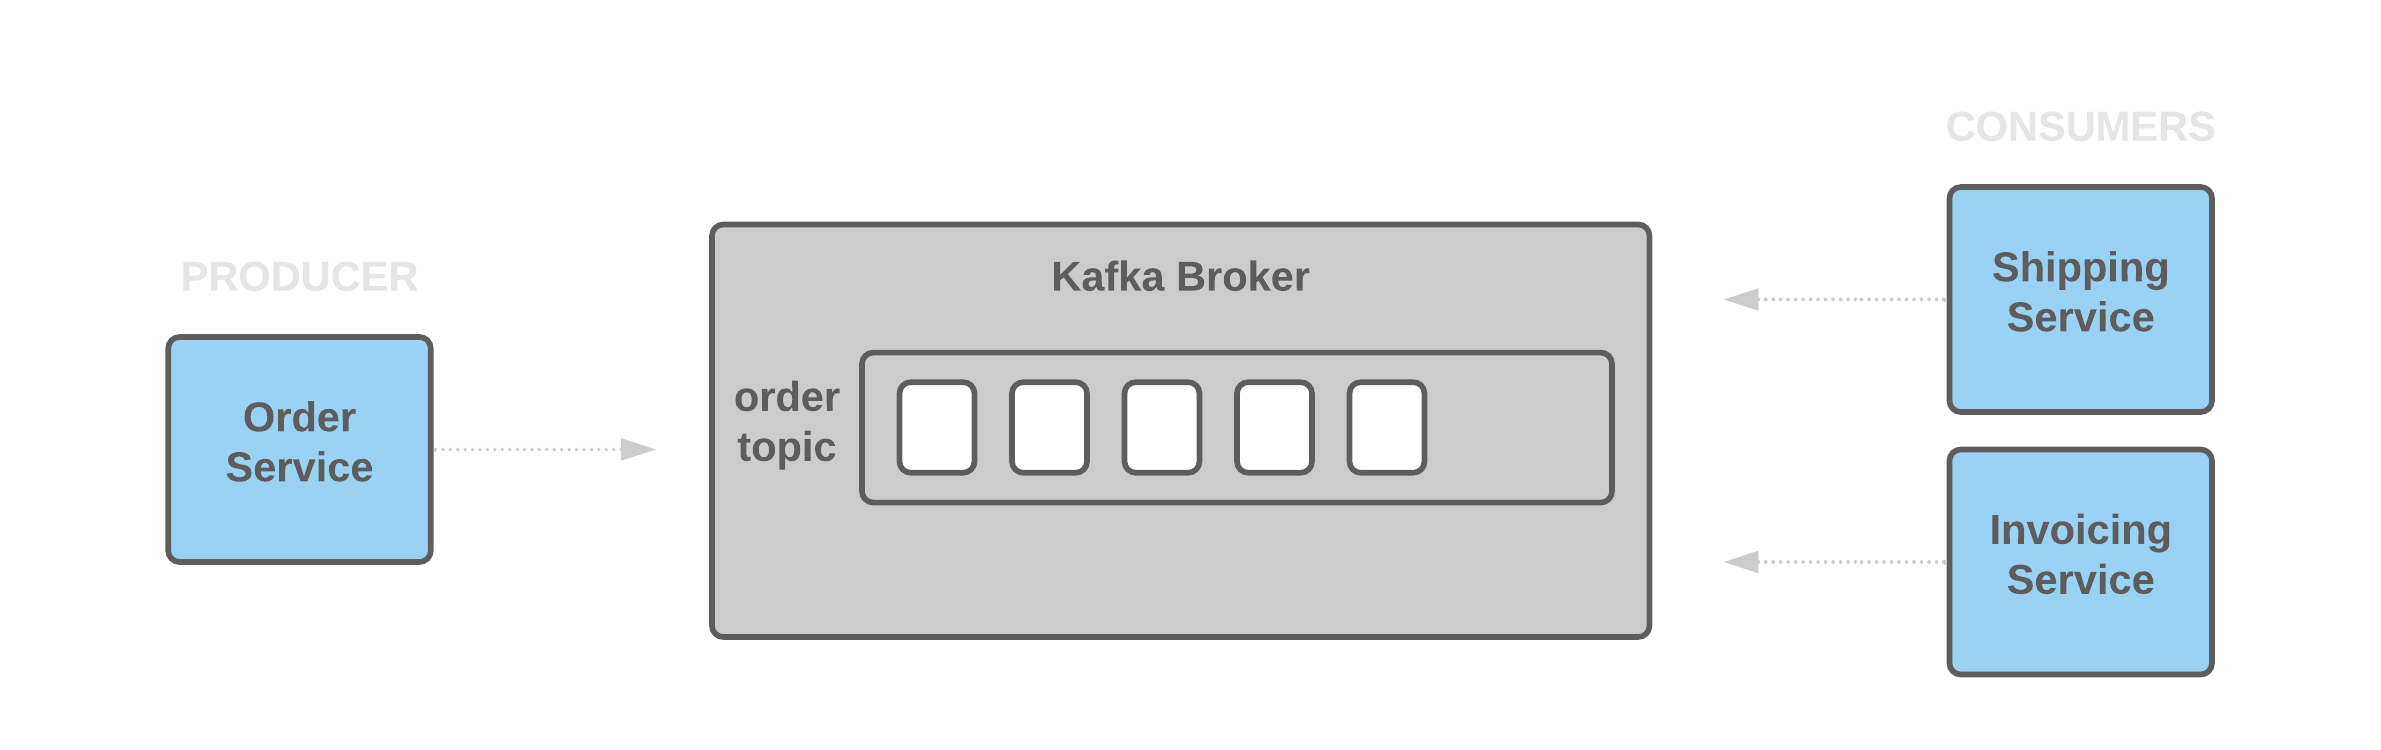
The order service creates orders. This service publishes messages to the order topic. The shipping service consumes the order topic messages and extracts the information needed to ship the items. This service is able to consume the order topic messages at the rate they are produced. The invoicing service consumes the order topic messages and extracts the information needed to send out an invoice. This service, when configured with the delay in the Prereqs step, is slower and unable to consume the order topic messages at the rate they are produced. (Credit: docs.px.dev/tutorials/pixie-101)
As many things in this course, it ll take a while, because we installing quite a few things. Please wait until the task is green.
kubectl -n px-kafka get svc apache
Now, we will use the UI of the pixie-kafka demo and generate some traffic. Expose the 8080 port on cplane-01
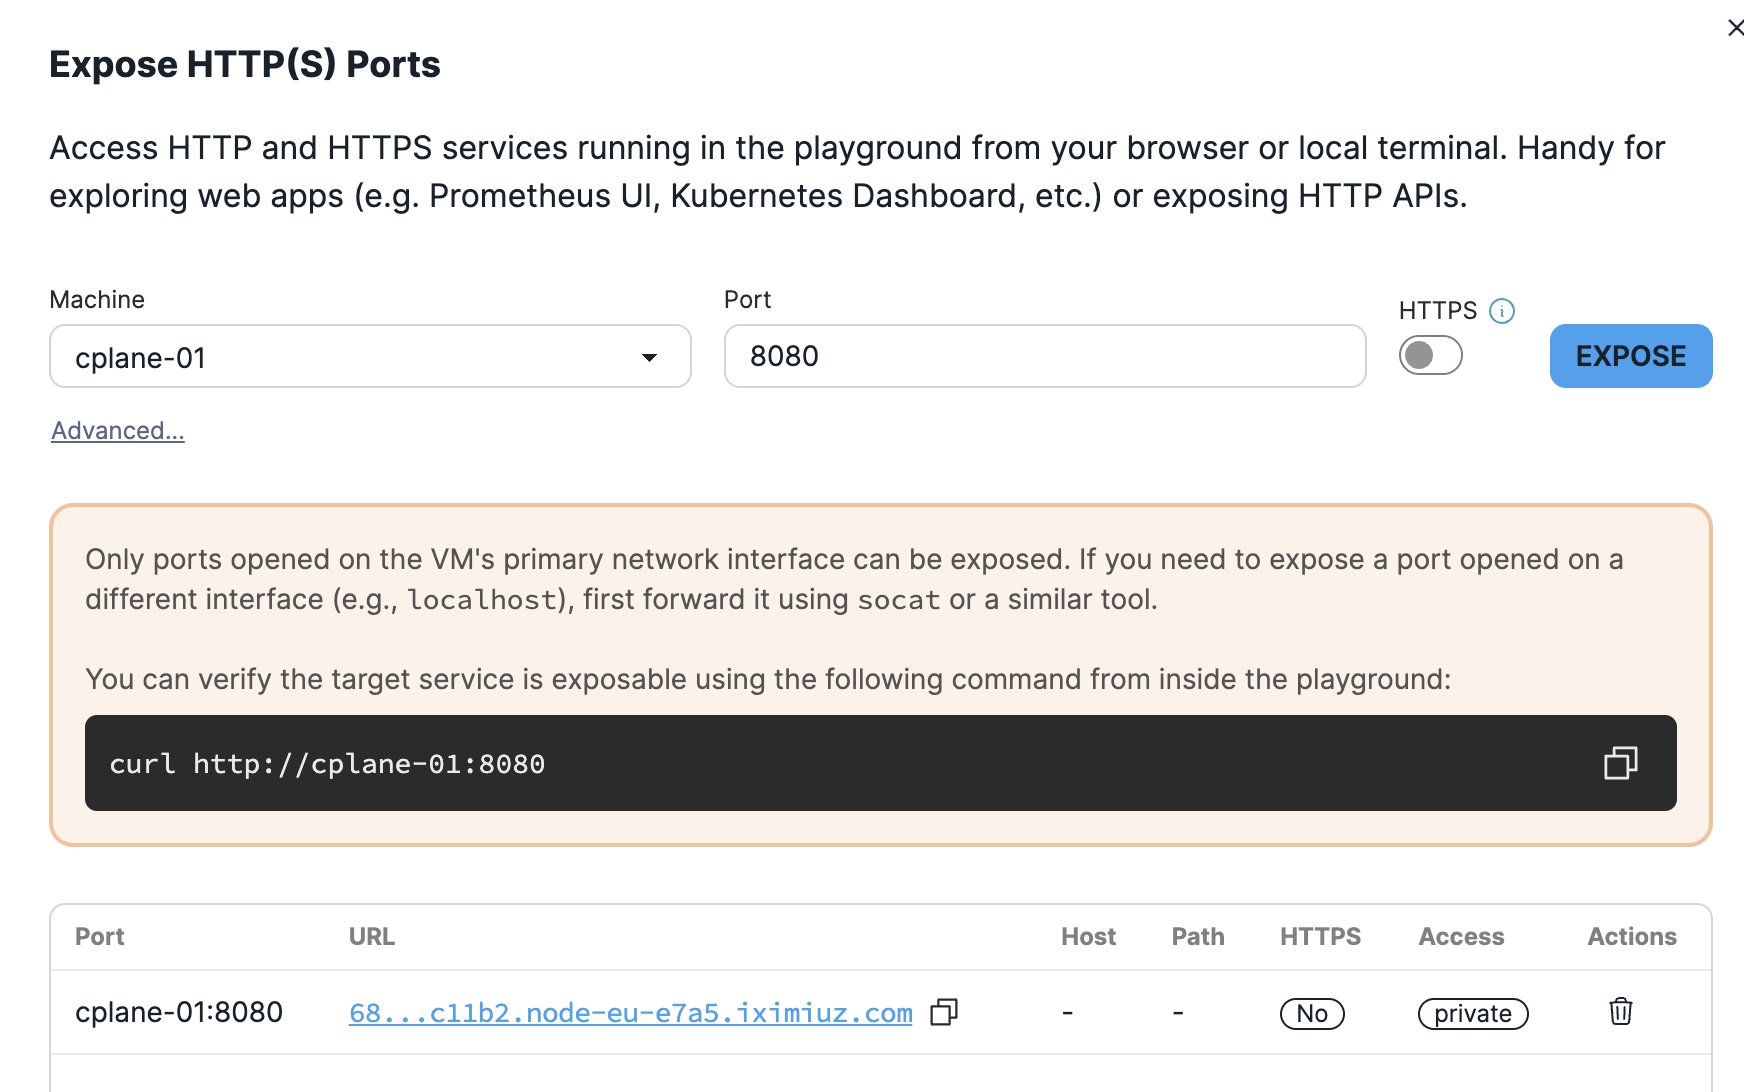
This type of architecture is called event-driven: services can be producers and consumers of messages onto topics. Remember, eBPF is also event-driven, however
we refer to hooks rather than to subscribers and the ring-buffer isn't really a message queue, more like a bus.
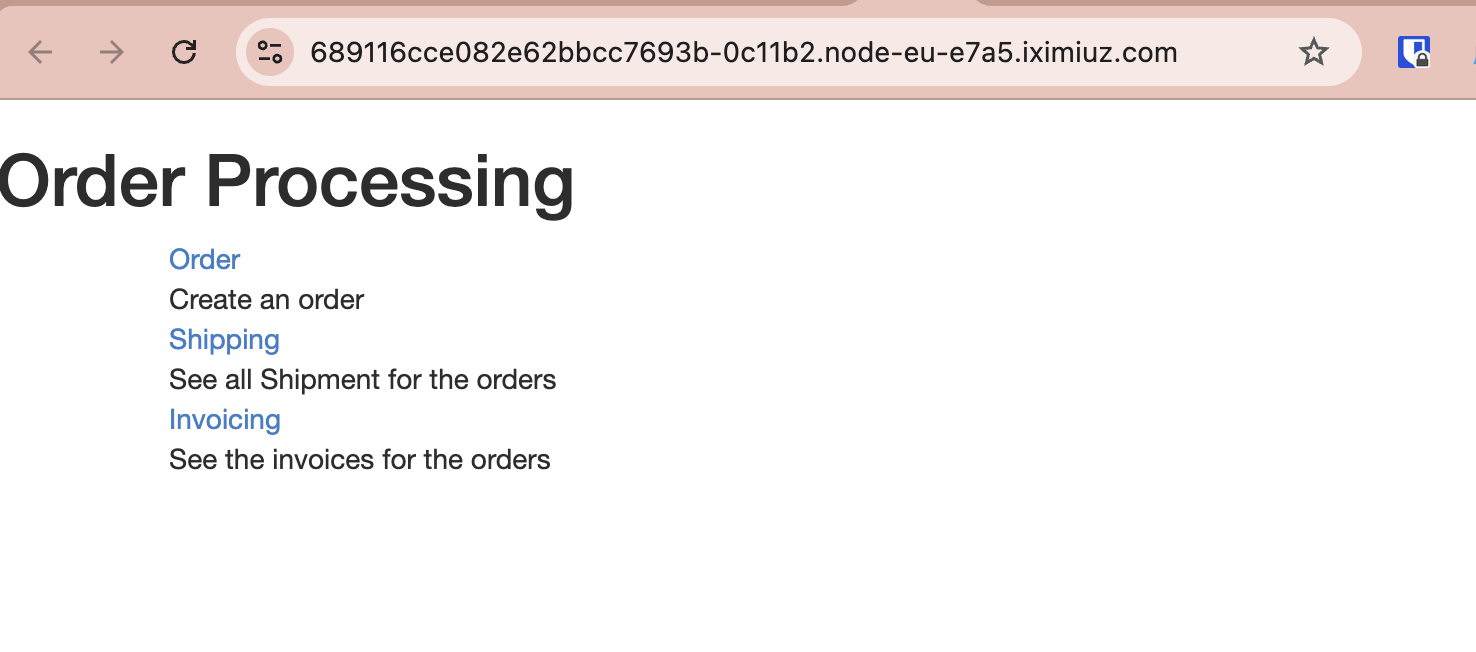
Press Create Order
Kafka protocol inference
So, this protocol is a tiny bit involved. https://kafka.apache.org/protocol#protocol_api_keys . Suffice it to say, that using kafka can be overwhelming, especially
when you re debugging any real-life sized system. There used to be nickname kafka-blindness describing that UIs would fail to get you to the messages you were
actually interested in, on top of the fact that an eventually consistent system distributed over a number of points is notoriously hard to debug, no matter what.
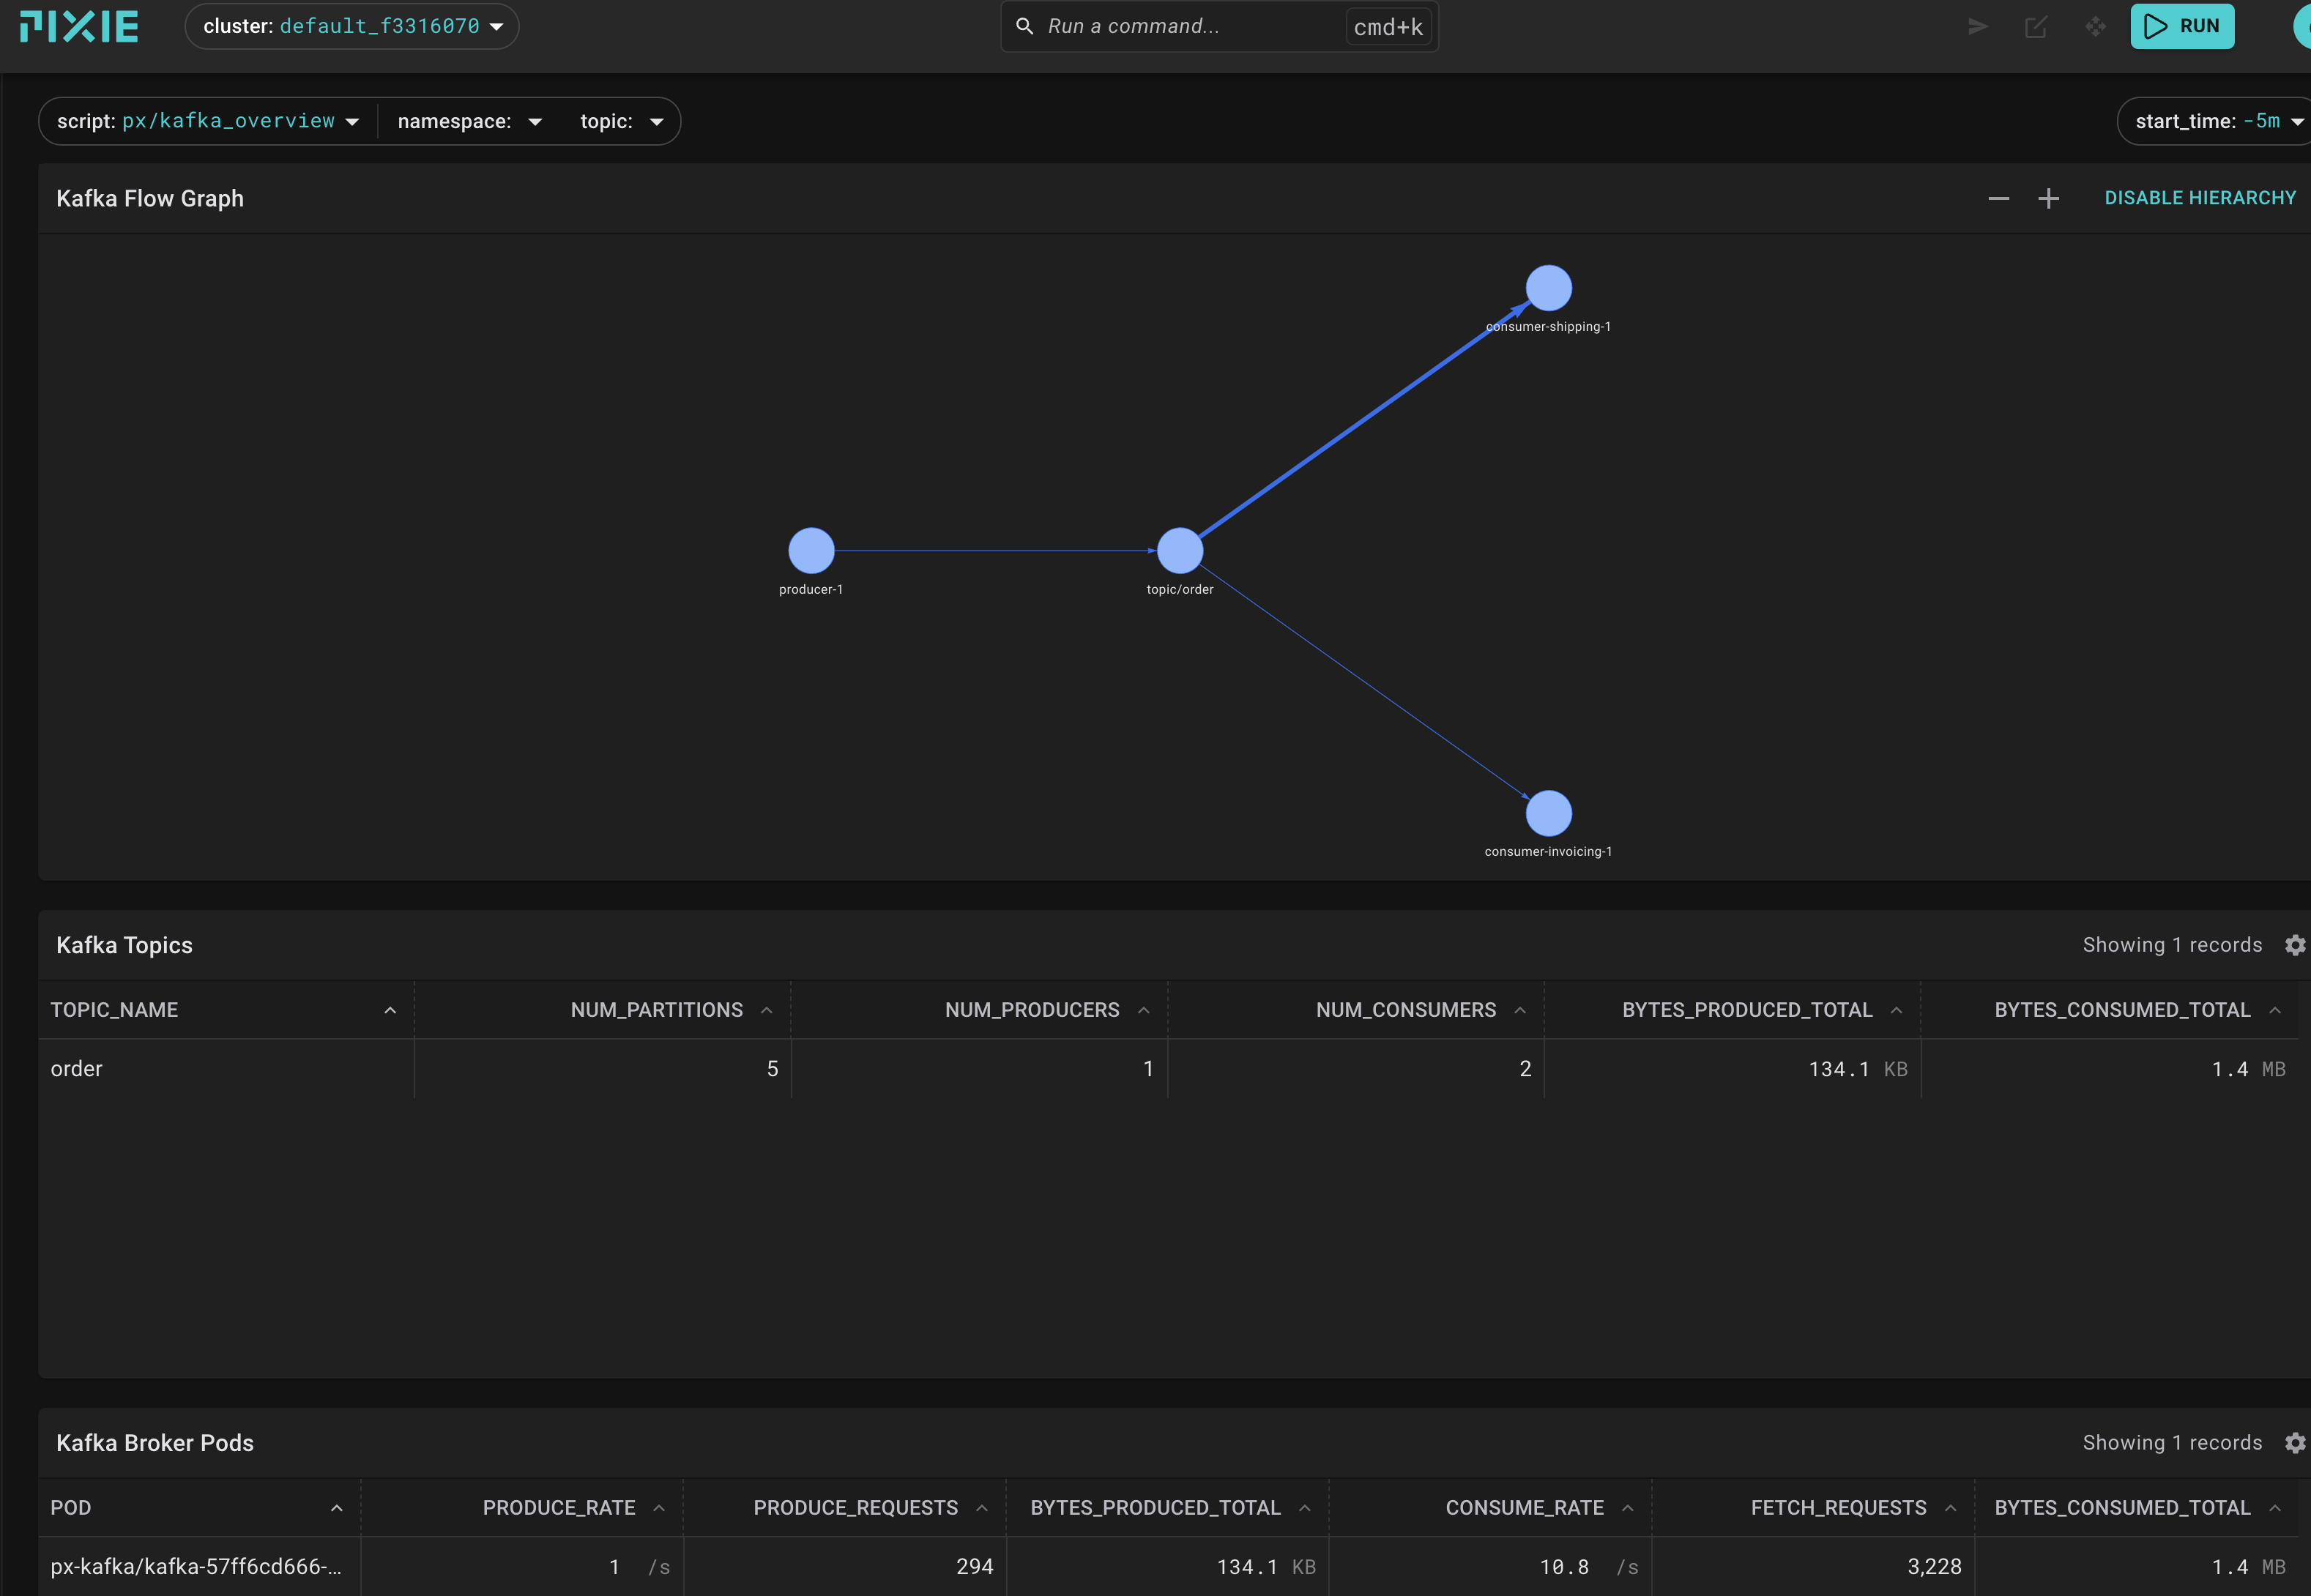
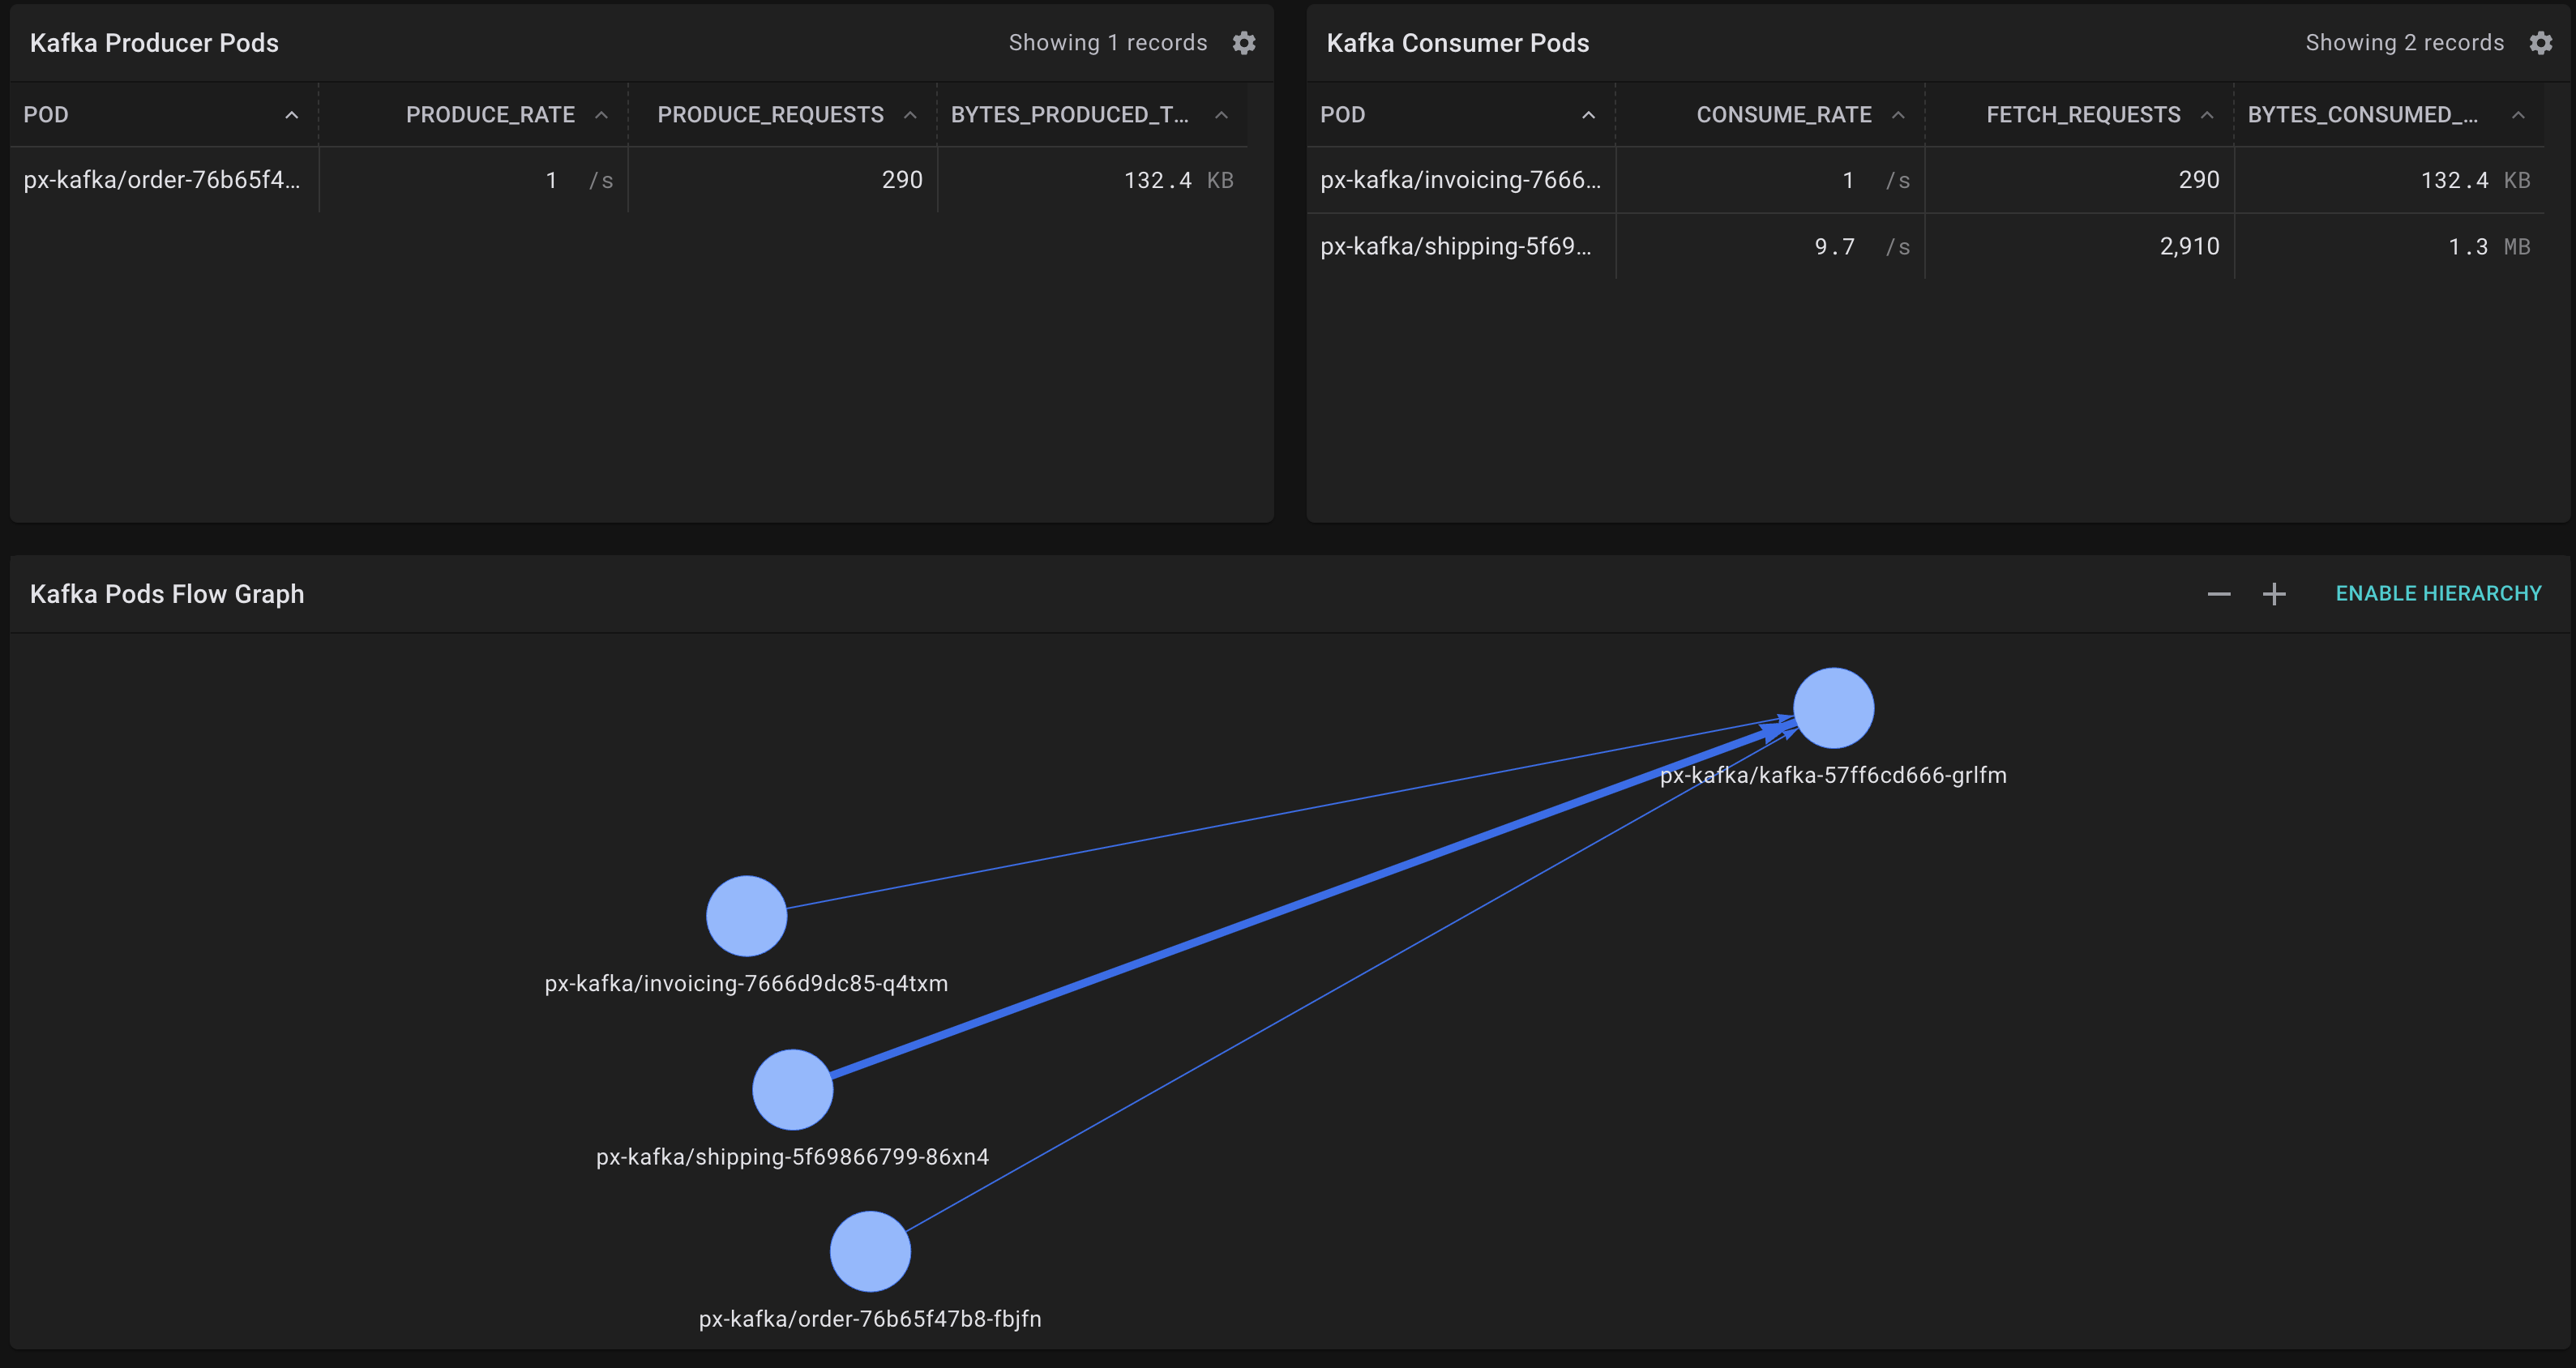
So, our order service is acting as producer here. It's important to note that there is no direct service to service communication, all messages
are transmitted via the bus which is kafka. This creates robustness and scale (and sometimes: confusion).
We may notice upon closer inspection that the invoicing service is about 10 times slower than the shipping service.
In case the services seem to be the same, make sure the invoicing delay is switched on 💡
   px demo interact px-kafka
   export INVC_POD=$(kubectl get pod -n px-kafka -l io.kompose.service=invoicing -o jsonpath='{.items[0].metadata.name}')
   export INVC_PID=$(kubectl exec -n px-kafka $INVC_POD -c invoicing -- pgrep java)
   kubectl exec -n px-kafka $INVC_POD -c invoicing -- kill -USR1 $INVC_PID
eBPF for debugging: application level vs kernel level
As a dev or an ops person, who is unfortunate enough to be asked why the invoicing service is slower, there is a choice:
We can use application level debugging to understand what is going on or ... eBPF.
If you are a kafka expert and know your way around instrumenting the JVM, that's cool. There are also many many helper application for kafka, like kafkacat.
Coming back to our single pane of glass concept, the power of eBPF in this usecase is that we can - but dont need to care about the JVM and all that:
We have the alternative route, to use our X-ray aka protocol-inference from all traffic over any socket:
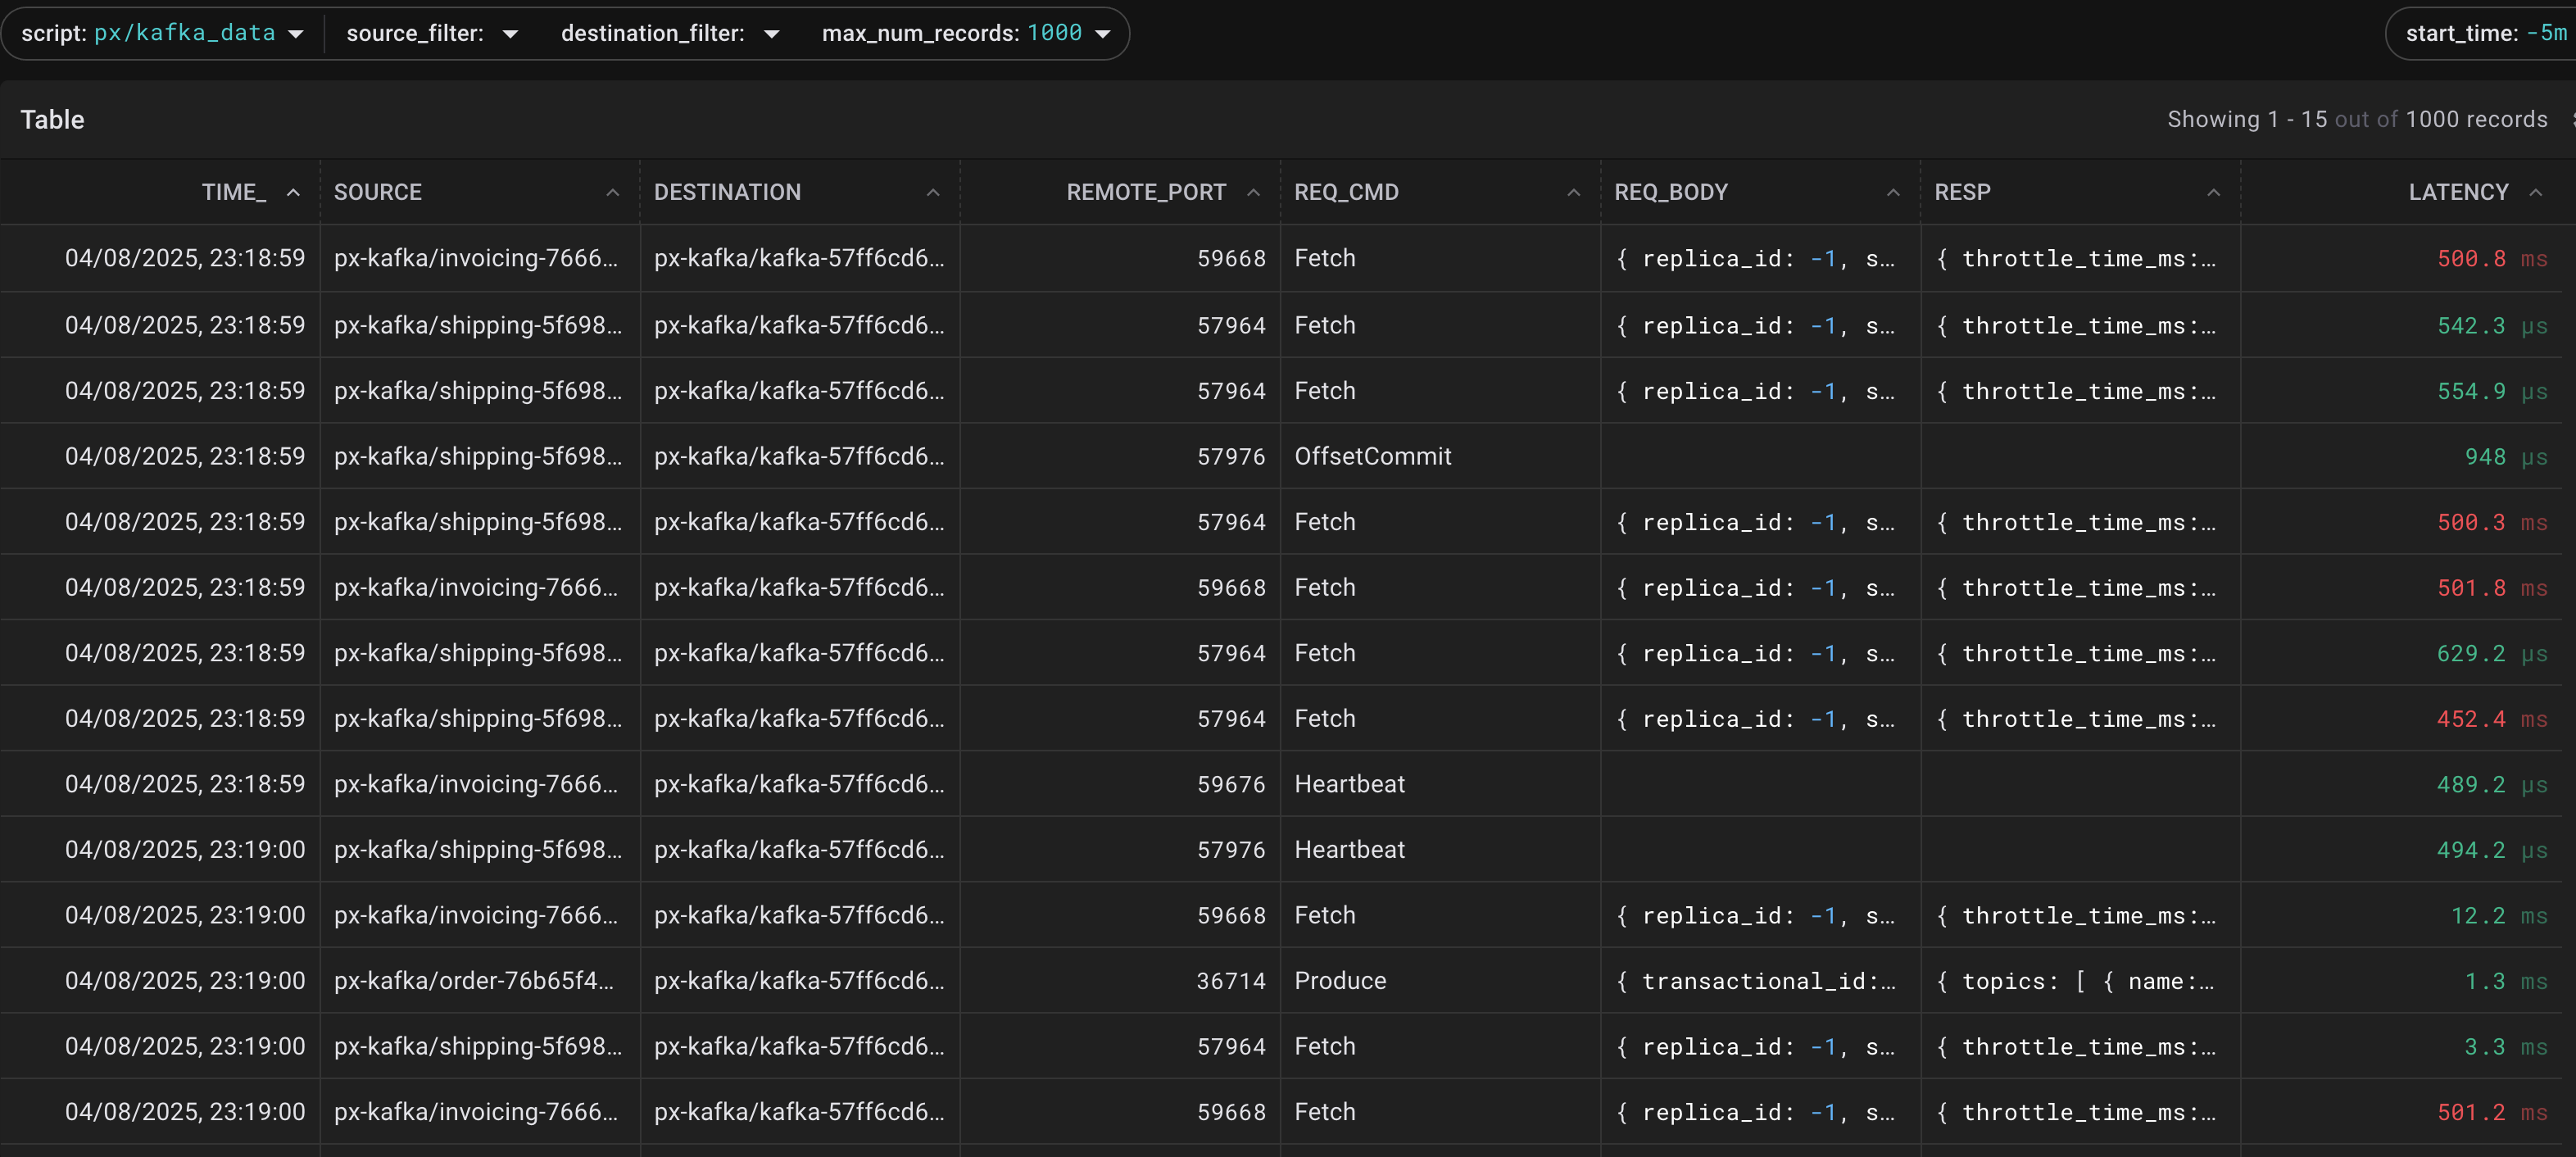
Switching over to the data where we can (a) understand how the kafka messaging logic works and (b) see any errors inside the REQ_BODY
Exercise: How does Constanze know it's a JVM ?
- Find the process
/usr/lib/jvm/zulu8-ca/bin/javaand see how kafka is started in the container
Latency : the story of an app vs the story of the network
Sometimes, applications dont tell you the truth. Not that we accuse anyone of lying, usually it's a misconfig or a bug (or both). Whenever we suspect such issues, we need an independent, usually out-of-band measure to confirm/disprove the suspicion.
It very much looks like we have a latency issue here. So, head over to Pixies inbuilt kafka_consumer_producer_latency query:
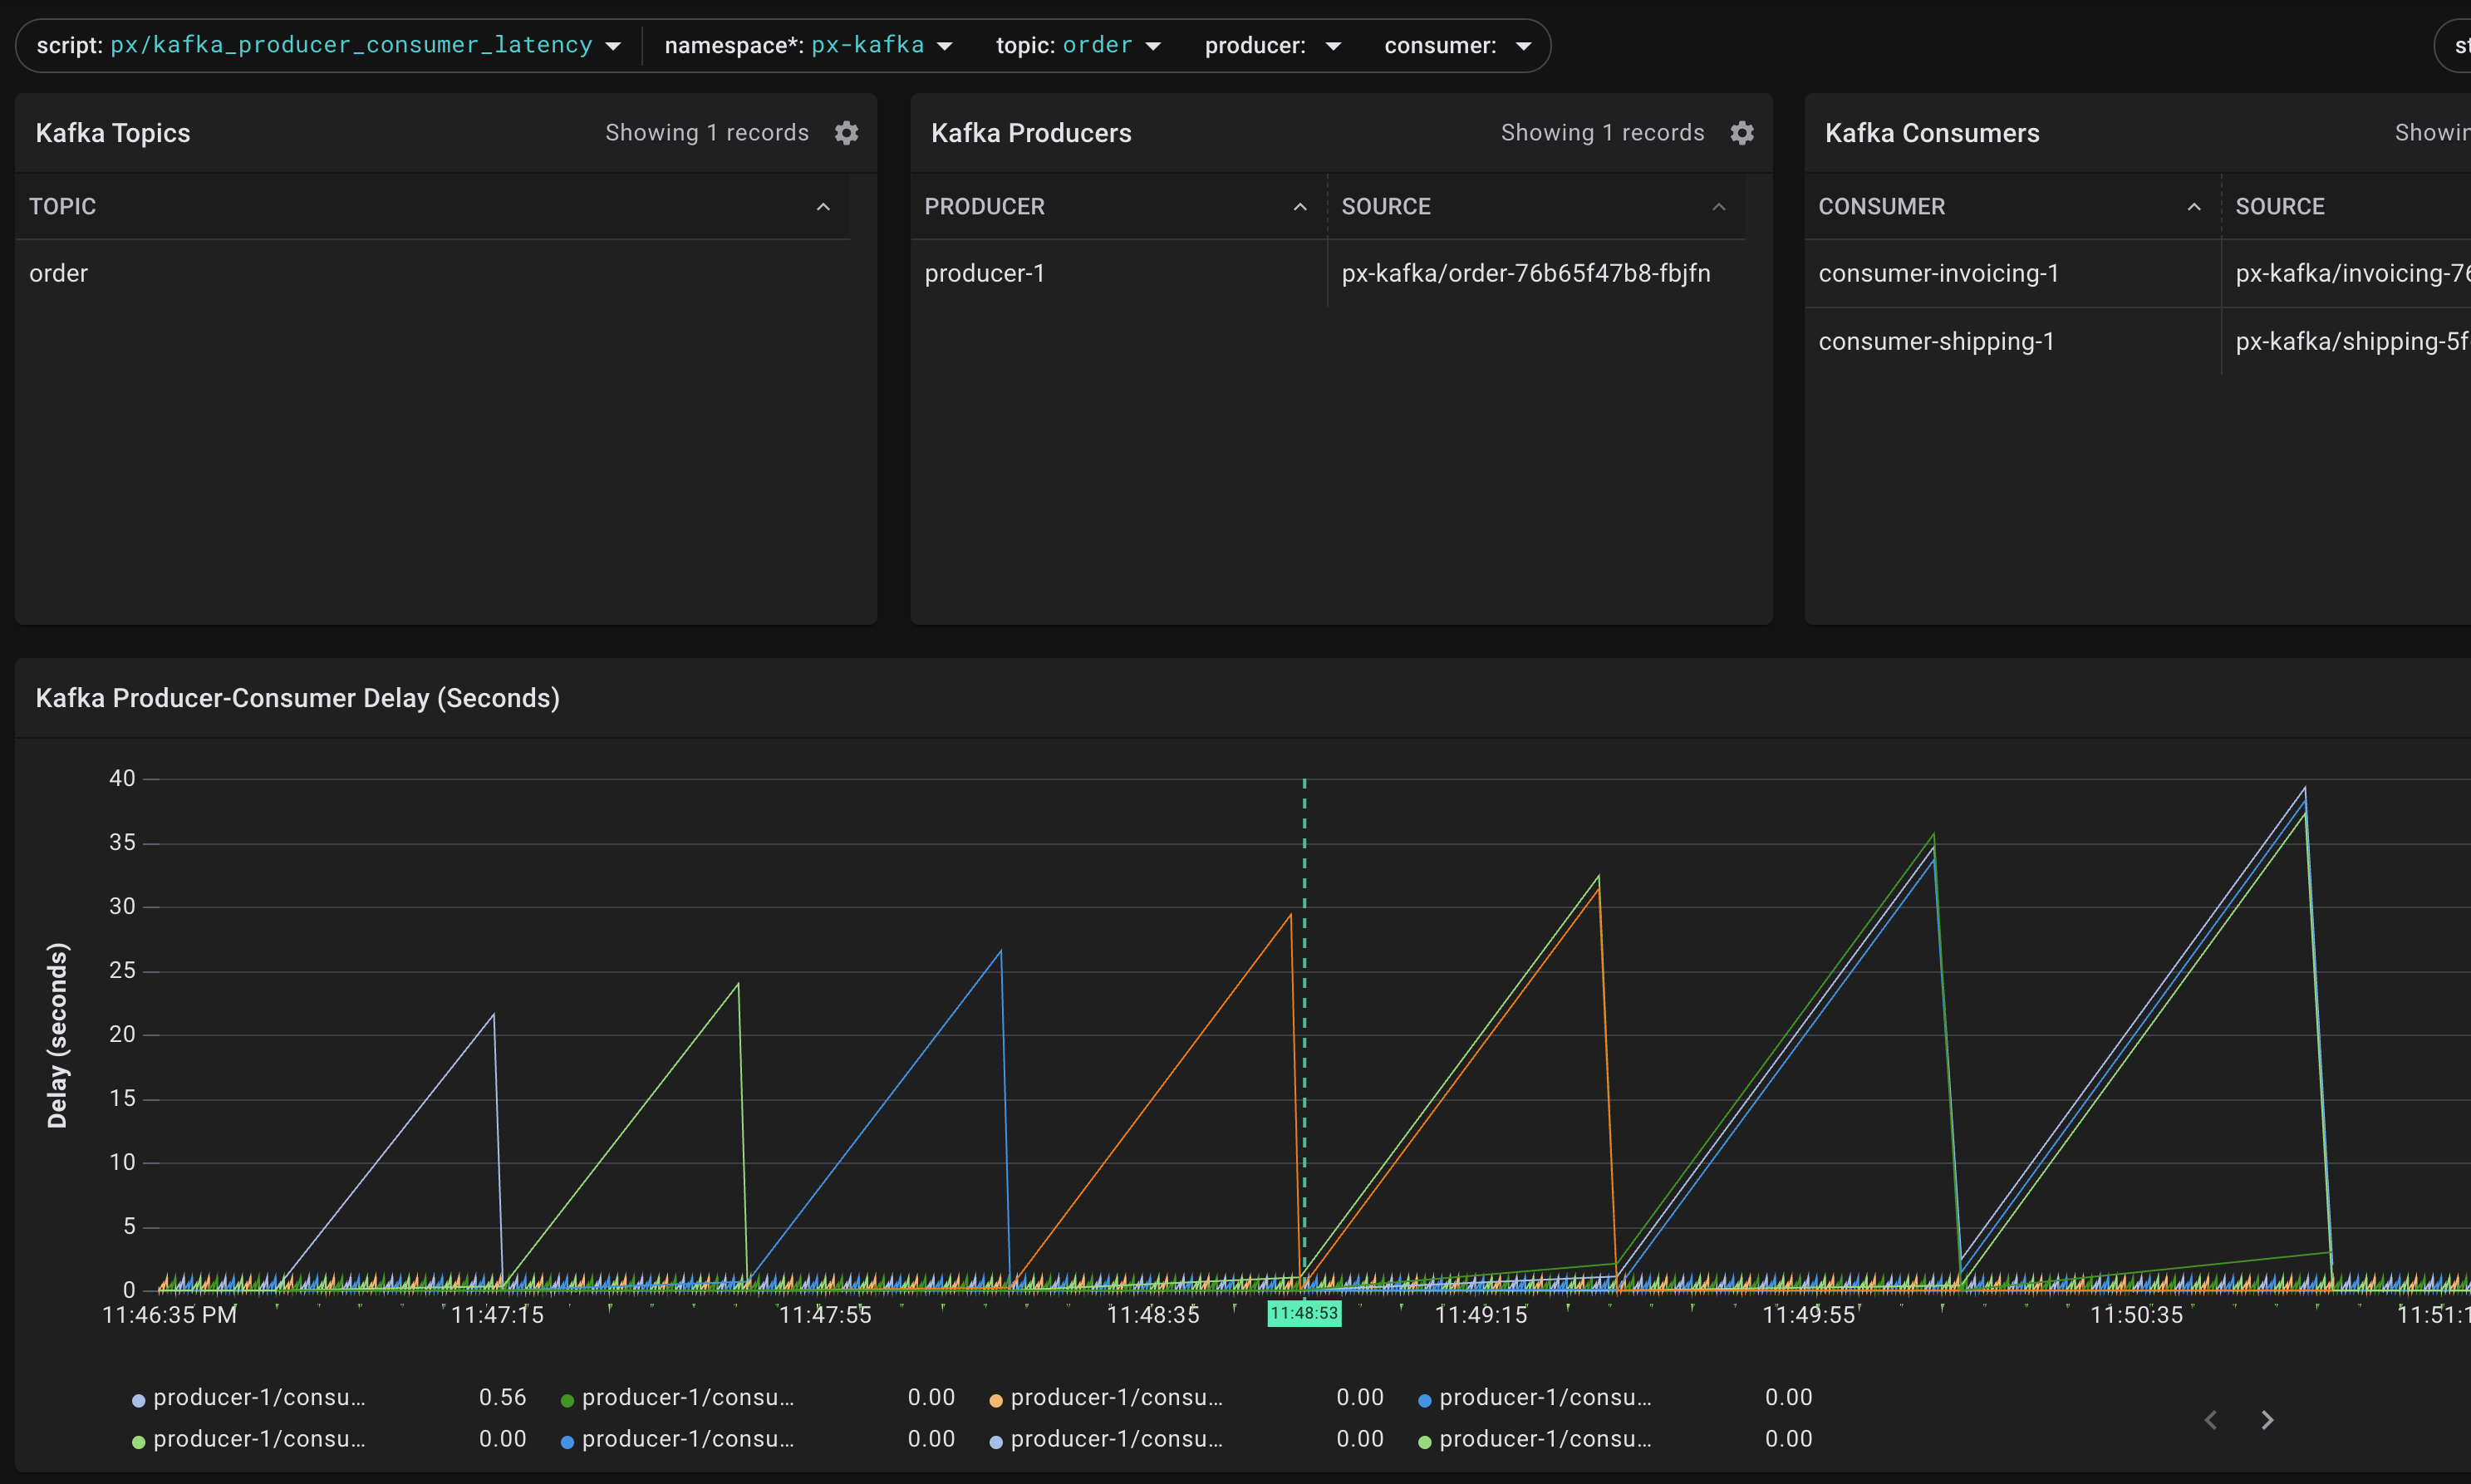
Looks like something s headed towards an instability, as we record an ever increasing delay. Hover/Toggle the different legend items to inspect the different partitions.
Filter the consumer further to isolate, that the sawtooth issue really is only affecting the invoicing service.
To confirm this positively, lets turn our artifical delay mechanism off:
kubectl exec -n px-kafka $INVC_POD -c invoicing -- kill -USR2 $INVC_PID
you should see the the sawtooth pattern dissipate. In this case, the delay was fake.
Crucial Ops Tasks Monitoring with eBPF
A common operation is for the kafka cluster to rebalance, this can interfere with the system-stability, the network-load, the message-offsets. Fortunately, the demo app has this covered. Let's upscale:
kubectl scale --replicas=3 deployment shipping -n px-kafka
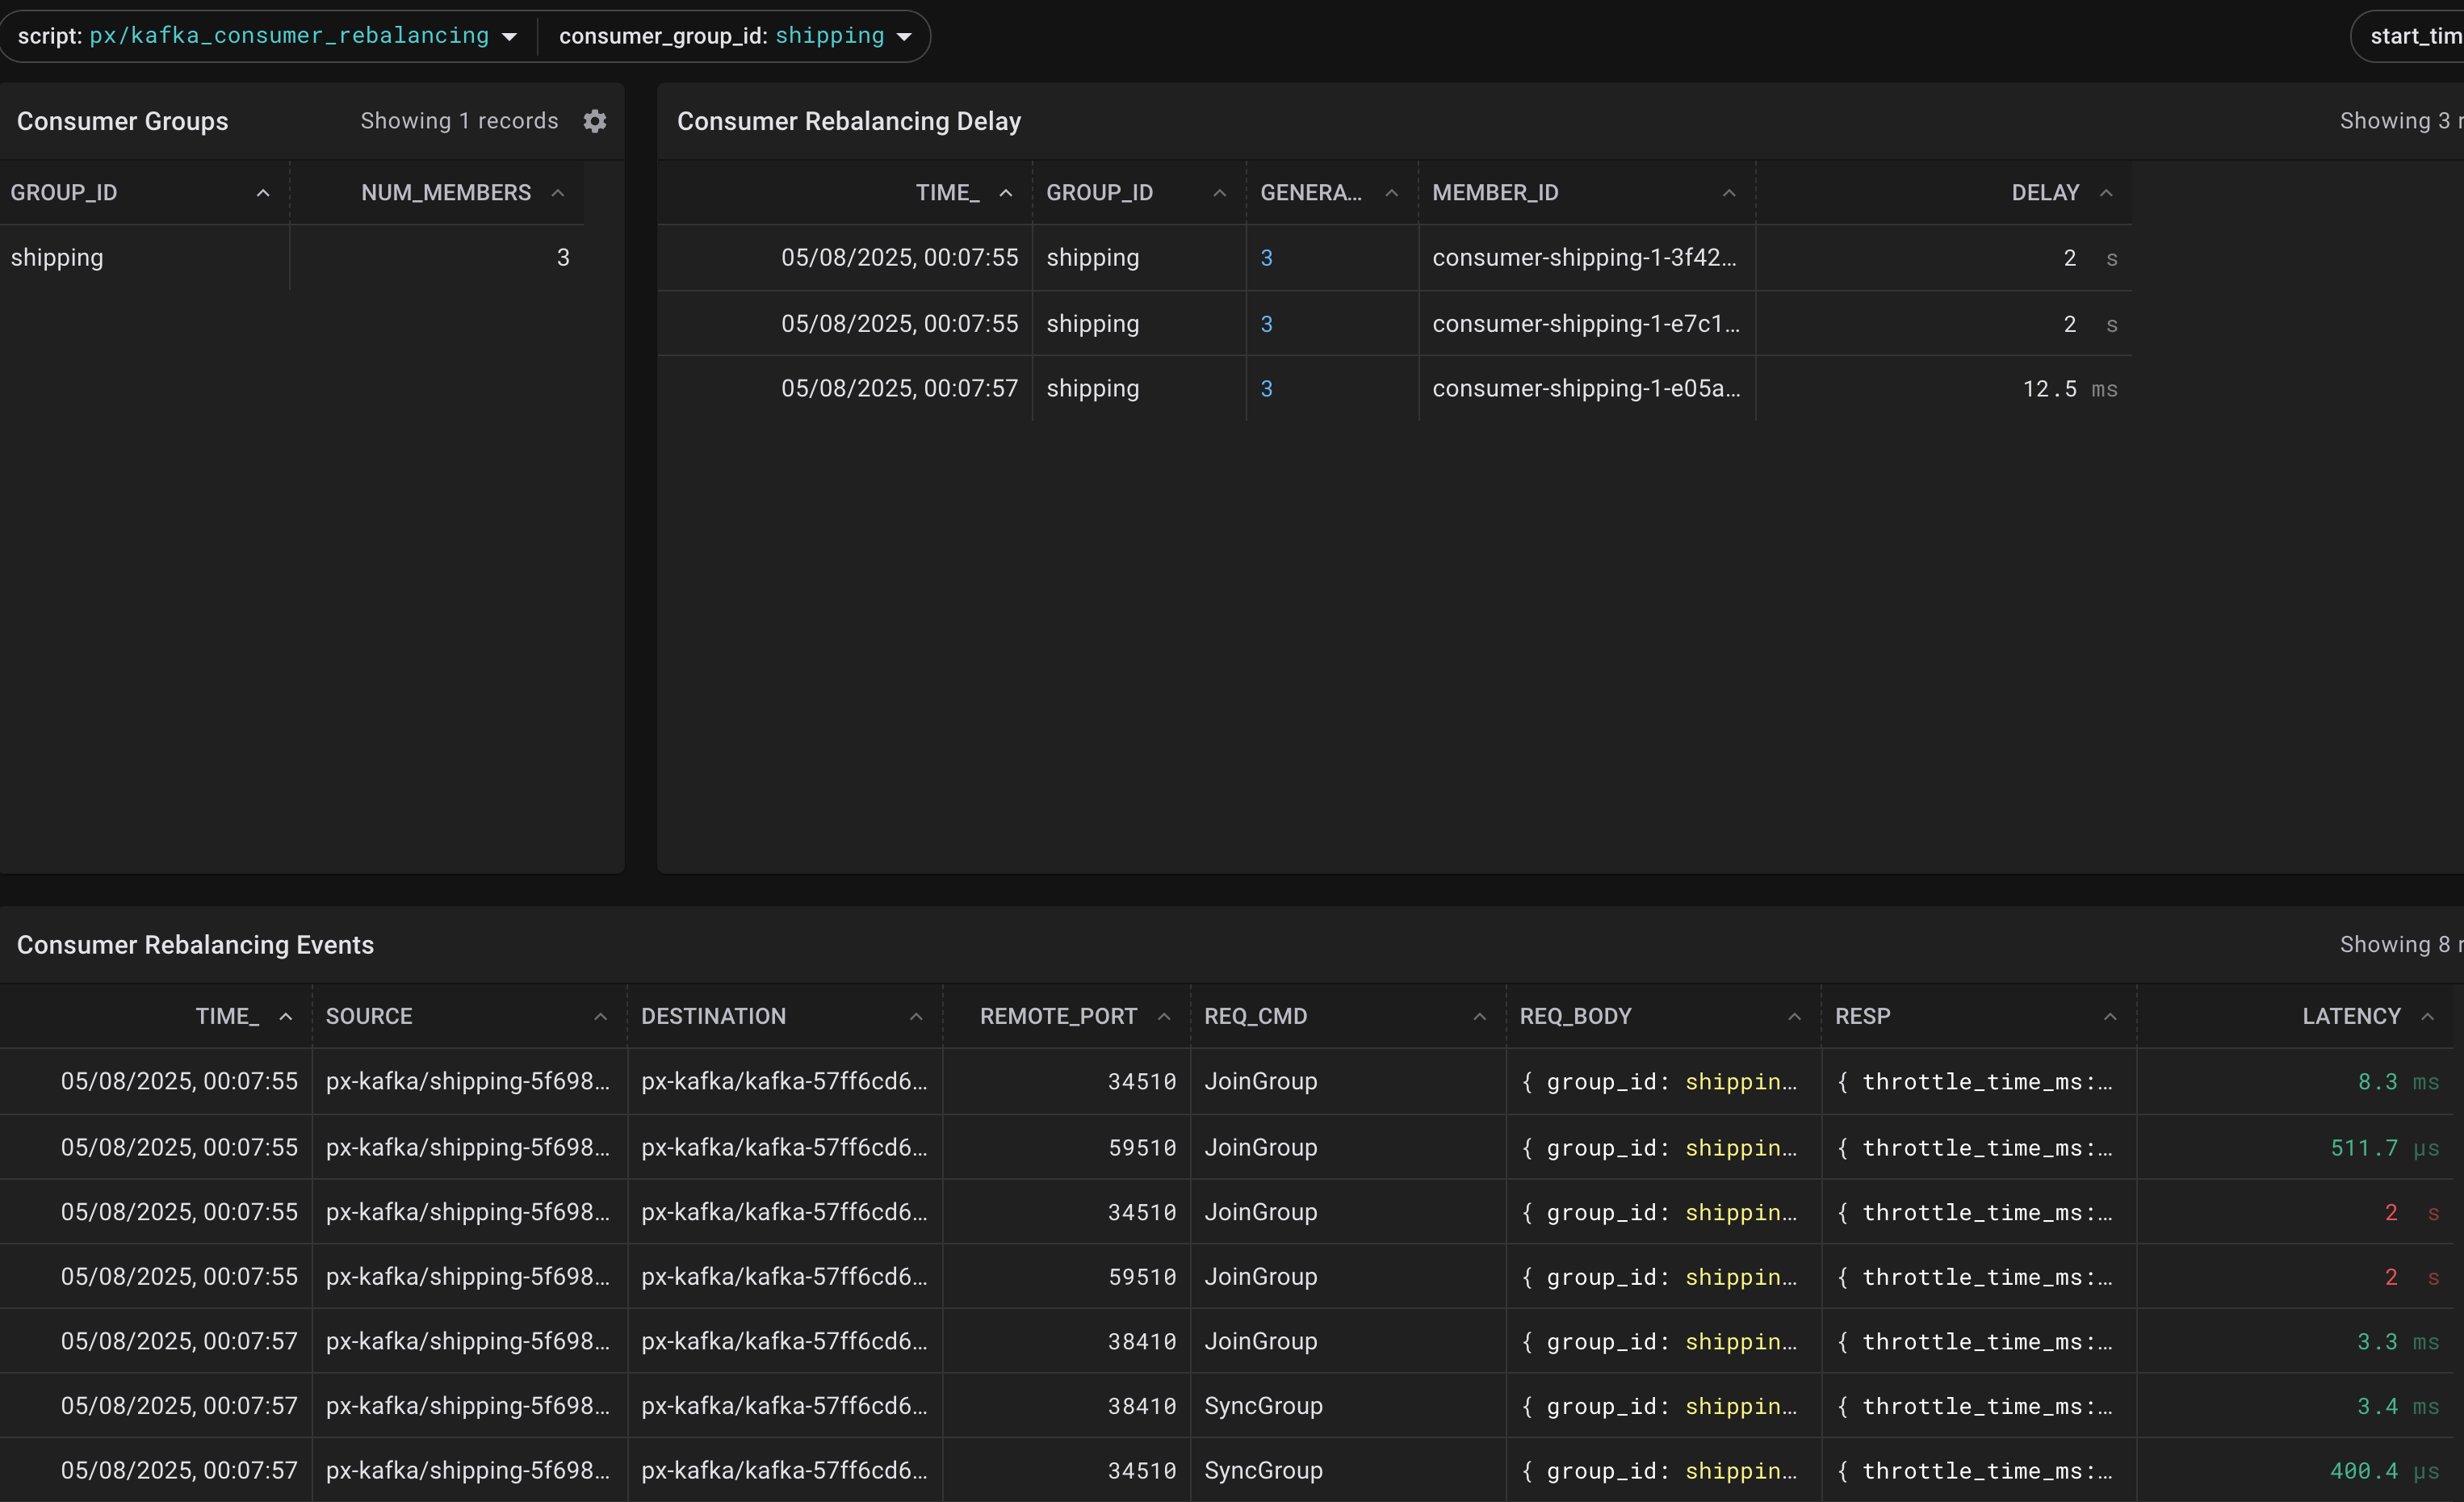
So, while the rebalancing is in progress, the consumers (all in that consumer_group unless explicitely overwritten) are stopped from consuming.
The delay between JoinGroup and SyncGroup is the crucial number, as during this time, no messages are being consumed.
That's it for today folks, you can watch the full talk "Monitoring Kafka without instrumentation with eBPF"
Conclusions
In this section, we used eBPF for operational observability of a very complex and heavy data-queue named Kafka. As usual, no instrumentation or knowledge of the JVM was required, Pixie overlayed the socket traffic in the kernel with the well-known Kafka protocol, which allowed us to visualize various connected metrics.
Often, we require independent measurements to confirm or triage the root-cause of a misbehaving system. This is why comparing application settings with eBPF data can be extremely valuable.
Now: Should you use Kafka in your work?
Only if you have requirements that need this level of scale, throughput, redundancy and advanced features. Do not underestimate the complexity of operating a distributed stateful application. If simpler queues are sufficient for your pub/sub pattern, I highly recommend testing those first.
🌟 This week's special thanks 🌟:
...go to the whole Pixie team, keep up the awesome work ♥️ . I just wish, we had some observability like this back in the day.
Next up:
After Pixie, Kubescape is my second my favorite eBPF project and I hope to show you why
References and Contact
If you'd like to show your appreciation -> consider leaving a star ⭐ at https://github.com/k8sstormcenter and at https://github.com/pixie-io/pixie
To give me feedback, stay in touch or find a conference where to meet me https://fusioncore.ai
This content is not sponsored, and comes with lots of ♥️ but no liability. If you find that I m misrepresenting something or any other errors, please do reach out in some way and help me improve.
For the ongoing research on the bill of behavior
https://github.com/k8sstormcenter/bobctl
You can write to the authors using croedig@sba-research.org or just leave a ⭐
- “eBPF Foundation and eBPF Foundation logo design are registered trademarks of eBPF Foundation.”
- https://github.com/pixie-io/pixie is part of the Cloud Native Compute Foundation
- https://docs.px.dev/tutorials/pixie-101/network-monitoring/
- Liz Rice, Container Security, https://www.oreilly.com/library/view/container-security/9781492056690/ ISBN: 9781492056706
- Liz Rice, Learning eBPF, https://www.oreilly.com/library/view/learning-ebpf/9781098135119/, ISBN: 9781098135126
- Martin Kleppmann, Designing Data Intensive Application, ISBN: 9781449373320
FAQs
Common questions:
- How is it different from an LSM like SELinux or AppArmour: the effect at runtime is similar, however, an LSM doesnt change
in realtime. LSMs are very well tested and serve rather broad use-cases. But, their coverage, i.e. the changes they can affect are limited to their design. This means, you can't alter random locations in the kernel with LSMs. So: you can typically modify LSM-policies at runtime and probably even switch them on/off in productionat will, but I have not heard of anyone doing this. People tend to test out their config going fromaudit -> enforceonce confident and then leaving it atenforce. - Can I use eBPF and LSMs at the same time? Yes, of course. And you should
- How is it different from seccomp profiles? Blocking/allowing syscalls (which is what those
secure computing modeprofiles do to achieve sandboxing) is very much in the same line of idea. Differences are that these profiles are typically supplied at deploy-time and they only manage syscalls. eBPF has a much broader applicability and flexibility.
Level up your Server Side game — Join 20,000 engineers who receive insightful learning materials straight to their inbox