How Linux Manages Process Memory (A Deep Dive with deep_in_memory)

deep_in_memory is a Linux terminal user interface (TUI) utility designed to help understand how the Linux kernel manages process memory. It provides a real-time visualization of key memory lifecycle events, including virtual address space reservations, page faults, physical page allocation, and swap activity. The tool uses eBPF tracepoints and kprobes to make kernel memory management mechanisms visible and easier to understand.
Key Capabilities
- Virtual Address Space Monitoring: Tracks mmap, munmap, and brk syscalls to observe the creation, growth, and removal of memory regions.
- Page Fault Visualization: Identifies "lazy" physical allocation (INIT) by hooking into kernel functions, showing exactly when reserved virtual space becomes backed by RAM.
- Swap Lifecycle Tracing: Monitors the movement of pages to and from swap via page_out (SWAP) and page_in (UNSWAP) events.
- Address-to-Physical Resolution: Allows users to look up specific virtual addresses to retrieve Page Frame Numbers (PFN) and cross-reference them with physical hardware ranges in /proc/iomem.
- Chronological Event Logging: Provides an aggregated, time-ordered log of memory operations, enabling the reconstruction of a process's memory behavior over time.
- Thread-Specific Analysis: Preserves thread identifiers (TIDs) for memory events, allowing the inspection of memory activity across different execution contexts within a single process.
Run tool
Jump to the deep_in_memory tab and run the command:
docker run -it -v /sys/kernel/tracing:/sys/kernel/tracing \
       --userns=host \
       --pid=host \
       --privileged \
       bareckidarek/deep_in_memory
or more securely:
docker run -it -v /sys/kernel/tracing:/sys/kernel/tracing:ro \
       --pid=host \
       --cap-drop=ALL \
       --cap-add=SYS_ADMIN \
       --cap-add=SYS_PTRACE \
       --cap-add=DAC_READ_SEARCH \
       bareckidarek/deep_in_memory
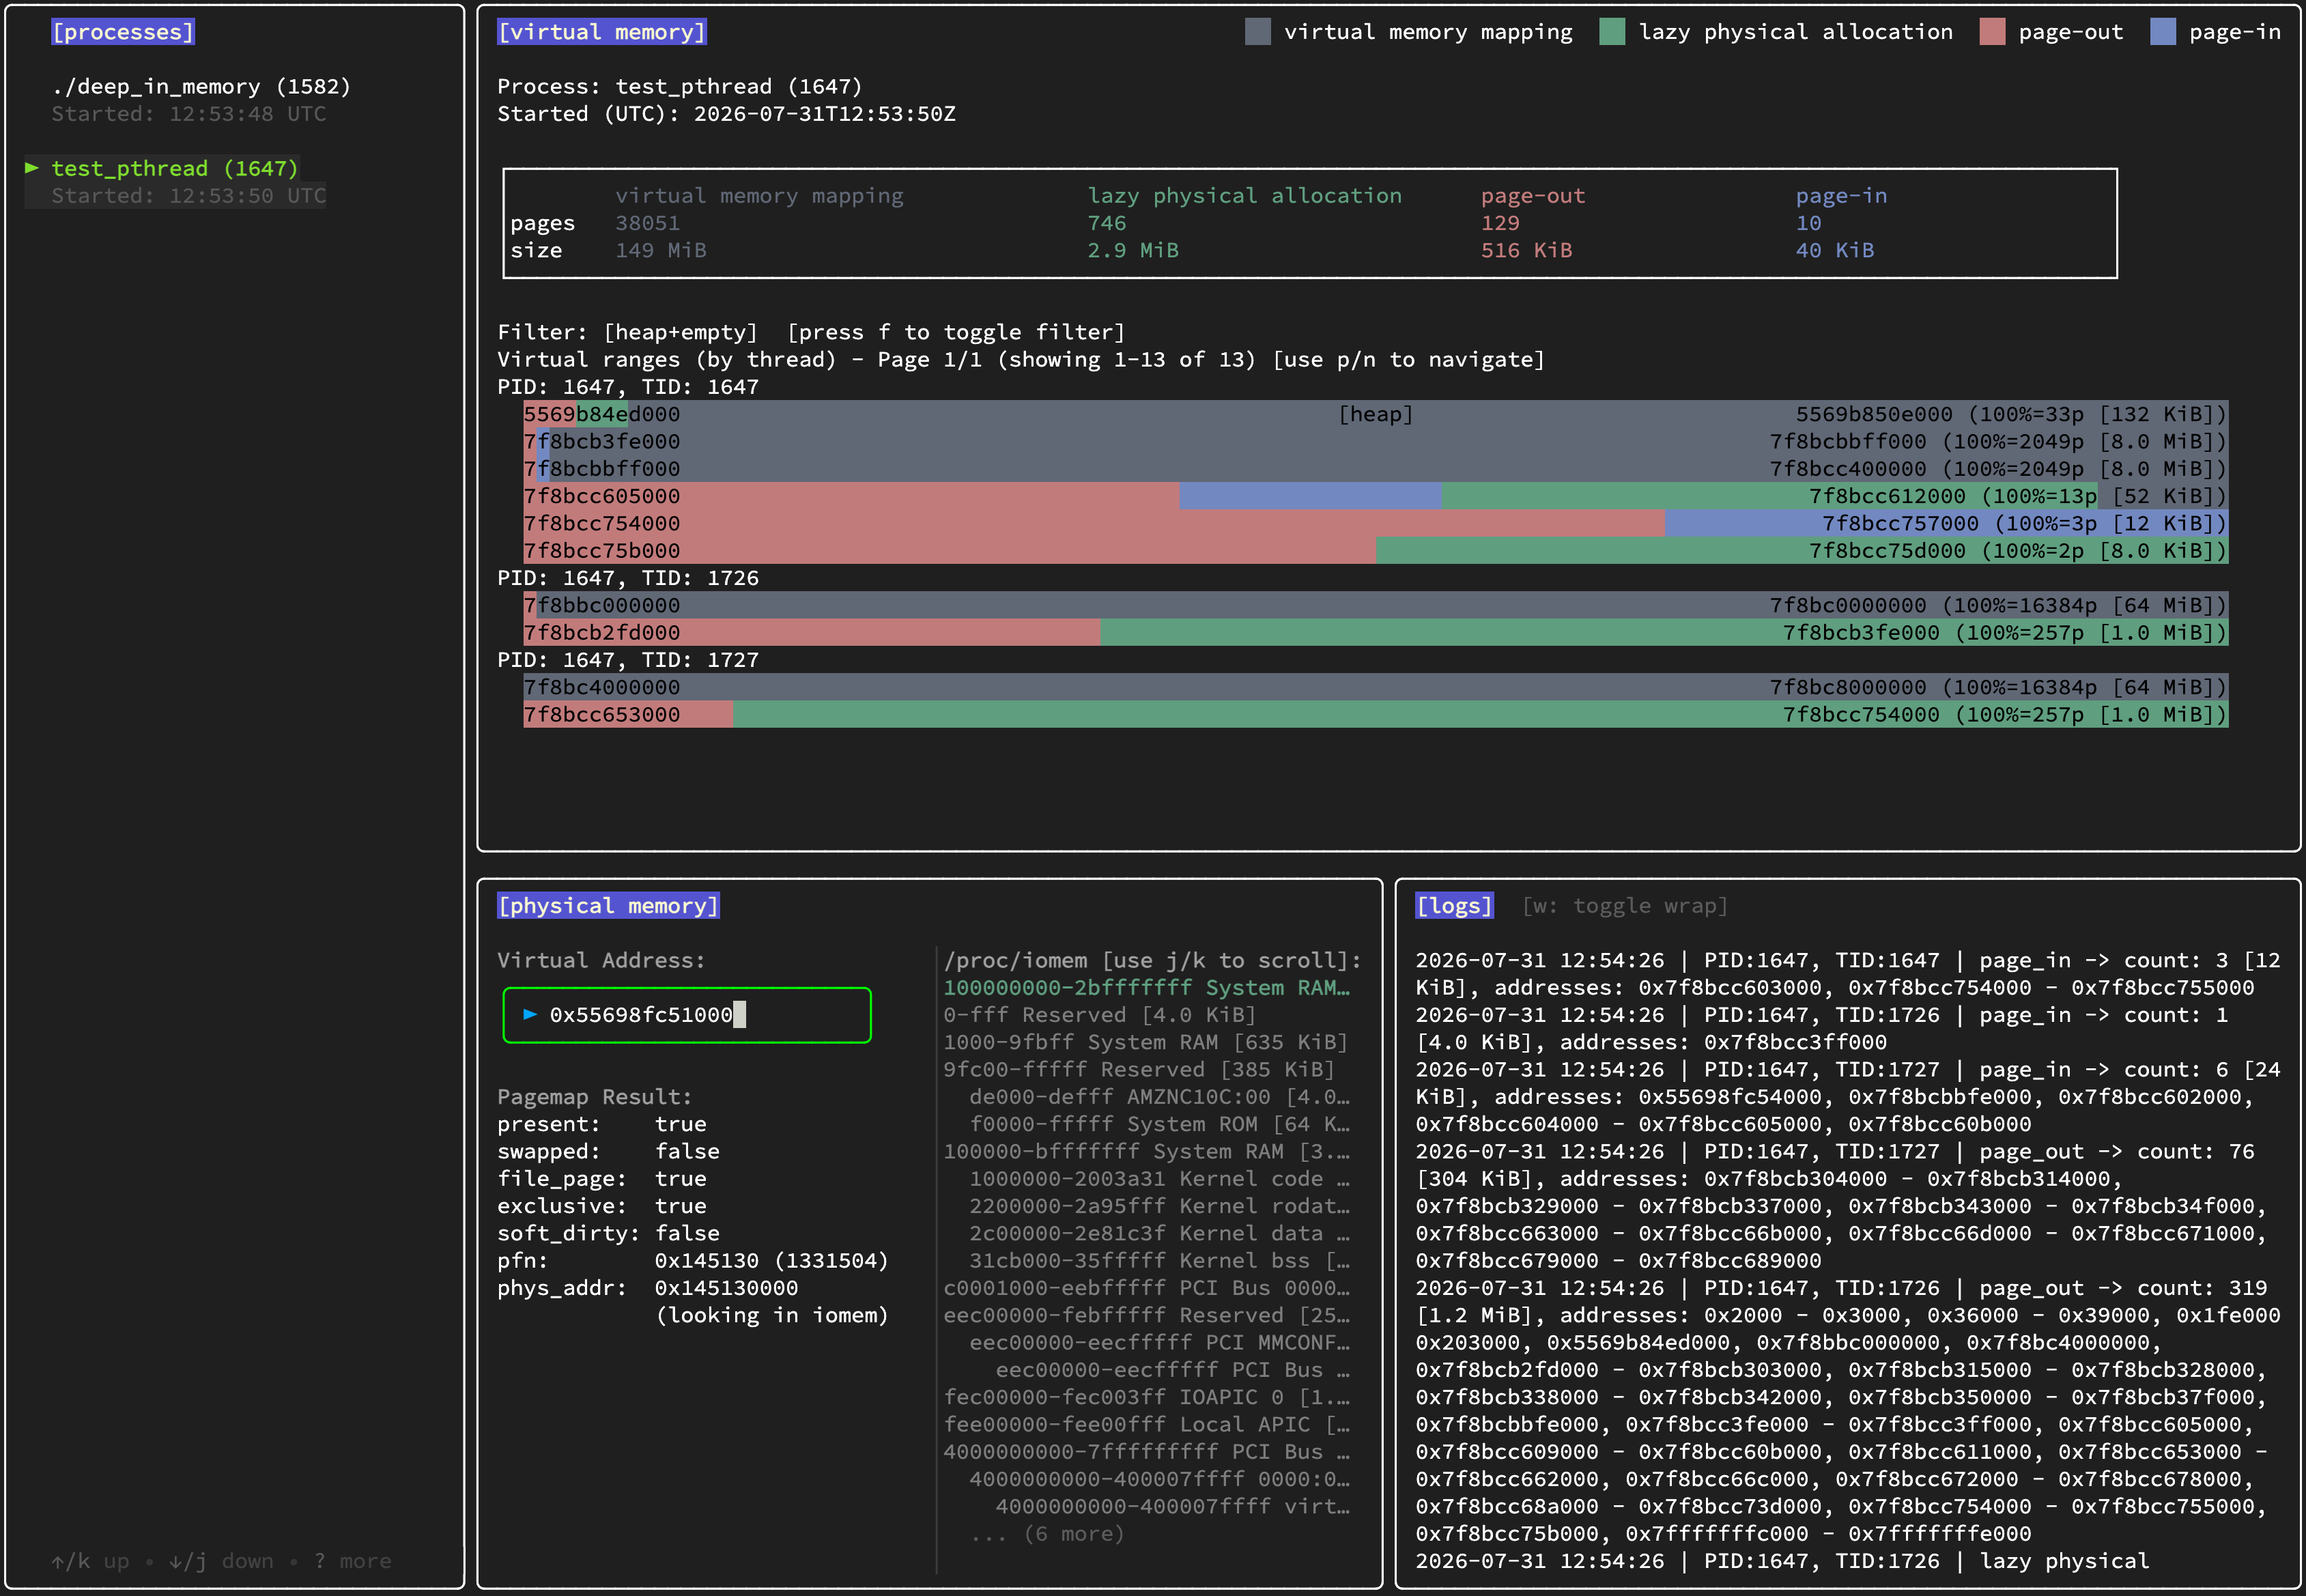
- [processes] Panel (Left Column): This area displays a list of live processes. Users navigate this list using the arrow keys and press Enter to select a target PID, which triggers the eBPF tracing and loads initial memory metadata.
- [virtual memory] Panel (Top Right): This is the primary visualization zone. It displays a summary of memory usage (reservation, allocation, and swap) followed by a paginated (use
p/nkeys) list of memory ranges for the selected process. Each range features a color-coded status bar:- Gray: Virtual memory mapping (reservation).
- Green: Lazy physical allocation (INIT).
- Red: Page-out (SWAP).
- Blue: Page-in (UNSWAP).
- [physical memory] Panel (Bottom Left of the right section): This section allows for point-inspection of specific virtual addresses. By entering an address (use
Tabkey to focus on input), the user can view Pagemap results (metadata flags such as present, swapped, or exclusive), the Page Frame Number (PFN), and its correlation with the system's physical hardware ranges from /proc/iomem. - [logs] Panel (Bottom Right): This panel provides a chronological, aggregated stream of memory-related events. It tracks operations like mmap, brk, clone, and various page fault types, grouping them by address and type to show a behavioral narrative of the process over time (use
wto toggle wrap).
Run single-task test apps
In these tests, the process has a single thread of execution and creates no additional tasks. It therefore does not share its resources with any other threads or processes.
Run test programs with manual control
Run with the manual parameter to control the step progression speed, for example:
./test_brk manual
systemd-run --user --scope -p MemoryMax=300K -p MemorySwapMax=1M ./test_brk manual
Extending the heap area using brk syscall
test_brk demonstrates the general lifecycle of dynamic memory in a process running under Linux. It is a test program designed to force glibc to use the brk system call via malloc. In the first phase, the program allocates 100 kB of memory (below M_MMAP_THRESHOLD = 128 kB), fills the first half with data, then the second half. In the second phase, the program allocates a second memory block and fills it with data. In the third phase, the program reads data from the first memory block. Finally, the program frees the first memory block and then the second one.
test_brk.c pseudo code
    //step 1: allocate block of size 100 * 1024
    // less than M_MMAP_THRESHOLD default (128 * 1024)
    // to provoke brk syscall
    void *b1 = malloc(ALLOC_SIZE);

    //step 2: fill first half of allocated block
    memset(&((char *)b1)[0], 'a', ALLOC_SIZE/2);

    //step 3: fill second half of allocated block
    memset(&((char *)b1)[0+ALLOC_SIZE/2], 'a', ALLOC_SIZE/2);

    //step 4: allocate second block of size 100 * 1024
    void *b2 = malloc(ALLOC_SIZE);

    //step 5: fill second allocated block
    memset(&((char *)b2)[0], 'b', ALLOC_SIZE);

    //step 6: read from first allocated block
    for(int i = 0; i < ALLOC_SIZE; i++) {
        char d = ((char *)b1)[i];
    }

    //step 7: free first allocated block
    free(b1);

    //step 8: free second allocated block
    free(b2);
Jump to the playground tab and run the command:
./test_brk
Then switch back to the deep_in_memory tab and select the process in the left panel.
Results
When test_brk starts, the process already has an allocated heap region. In the first phase, the allocation of 100 kB fits within this region, so glibc does not invoke brk, and the memory is allocated from the existing heap area. Filling this region with data causes page faults, since the application touches virtual memory pages that have not yet been mapped into physical memory.
In the second phase, when the second 100 kB memory block is allocated, glibc performs a brk syscall to extend the heap area and allocate additional virtual memory. In the third phase, reading data from the first memory block proceeds without issues, as the memory has been properly mapped and populated with data.
Finally, freeing the first and second memory blocks may allow glibc to merge the resulting free space into the top chunk and, if its size exceeds M_TRIM_THRESHOLD, reduce the program break via the brk system call, returning part of the heap to the operating system.
Extending the heap area using brk syscall under memory pressure
Next, we will run the same program, but under a memory limit enforced by cgroups.
Jump to the playground tab and run the command:
systemd-run --user --scope -p MemoryMax=300K -p MemorySwapMax=1M ./test_brk
Then switch back to the deep_in_memory tab and select the process in the left panel.
Results
After a few steps, the kernel begins to manage memory more aggressively due to the limit imposed on the process. When the process approaches the physical memory limit defined in cgroups, the kernel starts swapping out inactive memory pages to free up space for new allocations. In the step where the process accesses the first memory block again, the kernel must bring the pages back from swap into physical memory, which can introduce delays in the program’s execution.
It is worth experimenting with different parameters in the command systemd-run --user --scope -p MemoryMax=300K -p MemorySwapMax=1G ./test_brk to observe how this affects the frequency of swap usage. Additionally, reducing MemorySwapMax can eventually lead to the process being killed due to exceeding the memory limit.
Exhausting memory limits
In cgroups v2, MemoryMax and MemorySwapMax are independent limits — the process can use up to MemoryMax of RAM plus up to MemorySwapMax of swap at the same time (total headroom: 300K + 1M ≈ 1.3M in this example).
The OOM killer triggers only when both are exhausted.
Creating separate page regions using mmap syscall
test_mmap is very similar to test_brk, but it requests a larger memory allocation of 1 MB, which exceeds M_MMAP_THRESHOLD=128 kB, so glibc uses the mmap system call to allocate virtual memory.
The mmap call differs from brk in that it does not extend the [heap] region, but instead creates a new, independently managed virtual memory area, sized according to the allocation request.
To free the memory, glibc uses the munmap syscall, which releases the entire memory region allocated by mmap.
Page faults and swapping behave similarly to those in the [heap] region.
test_mmap.c pseudo code
    //step 1: allocate block of size 1024 * 1024
    // more than M_MMAP_THRESHOLD default (128 * 1024)
    // to provoke mmap syscall
    void *b1 = malloc(ALLOC_SIZE);

    //same as in test_brk
    ...
Jump to the playground tab and run the command:
./test_mmap
Then switch back to the deep_in_memory tab and select the process in the left panel.
Results
Virtual memory allocated via mmap does not have to be contiguous.
Notice that the second allocation (1 MB) is placed in a different virtual memory region than the first.
Filling the allocated memory triggers page faults, which map virtual memory pages to physical memory.
Creating separate page regions using mmap syscall under memory pressure
Next, we will run the same program, but under a memory limit enforced by cgroups.
Jump to the playground tab and run the command:
systemd-run --user --scope -p MemoryMax=1M -p MemorySwapMax=4M ./test_mmap
Then switch back to the deep_in_memory tab and select the process in the left panel.
Results
As with test_brk, when the process approaches the physical memory limit defined by cgroups, the kernel starts using swap space, moving inactive memory pages to disk.
Accessing a region that has already been swapped out causes the kernel to restore the corresponding pages from swap back into physical memory.
Run multi-task test apps
The process creates multiple tasks using the clone (or clone3) system call.
Depending on the flags passed to clone and the size of reserved virtual memory, the new tasks may share the same address space or have their own separate address
spaces.
Without sharing address space - brk
To create an application with multiple tasks that do not share an address space, the clone() system call can be used without the CLONE_VM flag.
In this configuration, the kernel creates a separate mm_struct for each task, initialized as a copy of the parent's memory mappings.
Although virtual addresses may be identical across tasks, each task maintains an independent address space.
Consequently, memory allocated after clone() may reside at the same virtual addresses while being mapped to different physical pages.
Jump to the playground tab and run the command:
./test_clone_brk no_sharing
or
./test_clone_brk no_sharing manual
Then switch back to the deep_in_memory tab and select the process in the left panel.
Results
When test_clone_brk no_sharing starts, the main process creates 10 worker tasks using clone() without the CLONE_VM flag.
Each worker receives a copy-on-write (CoW) snapshot of the parent's address space and is assigned its own distinct PID.
In deep_in_memory, all 10 child processes appear in the process list alongside the parent.
When workers call malloc(100 kB), each task allocates from its own independent heap — glibc extends each worker's [heap] region via the brk syscall.
The heap grows independently in each child, and deep_in_memory records a brk event per child process.
As workers write into the allocated regions, page faults fire and INIT events are recorded.
With sharing address space - brk
When the CLONE_VM flag is passed to clone(), the new task shares the parent's virtual address space.
Both the parent and all workers operate within the same mm_struct, so virtual addresses and physical page mappings are identical for all tasks.
Each task still retains its own PID, and the operating system treats them as separate processes.
Since all tasks share the same heap, malloc(100 kB) calls from different workers all allocate from the same [heap] region, which glibc extends via brk.
The heap expansion is visible as a single growing region in deep_in_memory, even though multiple tasks are driving the allocations.
Jump to the playground tab and run the command:
./test_clone_brk shared_vm manual
Then switch back to the deep_in_memory tab and select the process in the left panel.
Results
When test_clone_brk shared_vm starts, the main process creates 10 workers via clone(CLONE_VM | SIGCHLD).
All workers share the parent's virtual address space. In deep_in_memory, the child processes appear in the process list, and their memory region layouts match the parent's because they share the same mm_struct.
As workers call malloc(100 kB), they all allocate from the same shared heap and extend it via brk.
The [heap] region grows in deep_in_memory as each worker adds its allocation. INIT events appear in the log as workers touch their portions of the heap and trigger page faults in the shared address space.
With sharing thread group - brk
Using the full set of sharing flags — CLONE_VM | CLONE_THREAD | CLONE_SIGHAND | CLONE_FS | CLONE_FILES — the new tasks become true threads within the parent's thread group.
They share the same PID (the thread group leader's PID) but have distinct TIDs.
This is exactly how pthread_create() (see Bonus section) operates internally.
Jump to the playground tab and run the command:
./test_clone_brk shared_thread manual
Then switch back to the deep_in_memory tab and select the process in the left panel.
Results
When test_clone_brk shared_thread starts, all 10 workers are created as threads within the parent process.
In deep_in_memory, only a single process entry appears in the process list.
All threads share the same virtual address space and heap. When threads call malloc(100 kB), glibc extends the shared [heap] region via brk, just as in test_clone_brk shared_vm.
Without sharing address space - mmap
This test mirrors test_clone_brk no_sharing, but the larger allocation of 1 MB exceeds M_MMAP_THRESHOLD (default 128 kB).
As a result, glibc uses the mmap syscall instead of brk, creating a new, independent anonymous memory region for each allocation rather than extending the heap.
Jump to the playground tab and run the command:
./test_clone_mmap no_sharing manual
Then switch back to the deep_in_memory tab and select the process in the left panel.
Results
When test_clone_mmap no_sharing starts, 10 worker processes are created via clone() without CLONE_VM.
Each worker inherits a CoW snapshot of the parent's address space and has its own PID.
In deep_in_memory, each child process appears in the process list independently.
When workers call malloc(1 MB), glibc issues an mmap syscall to create a new anonymous region in each worker's private address space.
Unlike the brk case, these are separate virtual memory regions — not extensions of the heap.
New regions appear for each child process in the virtual memory panel of deep_in_memory.
As workers write data, page faults trigger INIT events specific to each worker's memory region.
After workers exit, munmap events are recorded and the corresponding regions are removed from the process views.
With sharing address space - mmap
With CLONE_VM, workers share the parent's virtual address space. When each worker calls malloc(1 MB), glibc issues an mmap syscall that creates a new anonymous region within the shared address space.
Since all tasks share the same mm_struct, every new region created by any worker is immediately visible to all others.
Jump to the playground tab and run the command:
./test_clone_mmap shared_vm manual
Then switch back to the deep_in_memory tab and select the process in the left panel.
Results
When test_clone_mmap shared_vm starts, 10 workers are created sharing the parent's virtual address space.
In deep_in_memory, workers appear as separate processes but their virtual memory layouts are identical because they share the same mm_struct.
As workers call malloc(1 MB), new mmap regions rapidly accumulate in the shared address space. The total virtual memory usage visible in deep_in_memory grows with each worker's allocation.
INIT events are attributed to each worker as they write to their allocated regions, even though all regions exist within the same virtual address space.
When workers free their memory, munmap events are logged and the corresponding regions are removed from the virtual memory panel.
With sharing thread group - mmap
With thread group sharing (CLONE_THREAD), workers are true threads. Each thread allocates 1 MB via malloc(), which glibc satisfies with mmap, creating new anonymous regions in the shared address space (use n/p to navigate between pages).
Jump to the playground tab and run the command:
./test_clone_mmap shared_thread manual
Then switch back to the deep_in_memory tab and select the process in the left panel.
Results
When test_clone_mmap shared_thread starts, 10 worker threads are created within the parent process.
deep_in_memory shows a single process entry in the process list; the threads are visible with their distinct TIDs.
As each thread calls malloc(1 MB), new mmap regions are created in the shared address space.
The virtual memory panel in deep_in_memory fills with new regions as threads allocate.
INIT events in the log are attributed to individual TIDs as threads fault in their allocated pages.
After freeing, munmap events are recorded and the regions are removed from the virtual memory panel.
Bonus
Using copy-on-write snapshot
Copy-on-write (CoW) is the mechanism the kernel uses when clone() is called without CLONE_VM.
Instead of immediately duplicating all physical pages, the kernel marks the parent's pages as read-only and shares them with the child.
A private copy of a page is made only when either the parent or the child actually writes to it — at that point the kernel allocates a new physical page, copies the content, and remaps the virtual address in the writing task to the new page.
test_clone_cow is designed to make this moment observable. The parent allocates 100 kB via malloc() (below M_MMAP_THRESHOLD, so brk extends the heap), fills the buffer with 'P', then clones a child without CLONE_VM. The child receives the same buffer pointer and writes 'C' into it, triggering CoW page faults.
At each step, you can use deep_in_memory's physical memory panel to look up the virtual address and compare the resulting PFN between parent and child — before the child writes, they share the same PFN; after the write, they point to different physical pages.
test_clone_cow.c pseudo code
    // step 1: parent allocates 100 kB  →  brk extends [heap]
    char *buf = malloc(SIZE);

    // step 2: parent fills buffer with 'P'  →  INIT page faults (virtual → physical)
    memset(buf, 'P', SIZE);

    // step 3: clone child without CLONE_VM  →  child gets CoW snapshot of parent's address space
    pid_t child = clone(child_fn, child_stack + STACK_SIZE, SIGCHLD, buf);
    // at this point: parent and child share the same physical pages (same PFN)

    // --- inside child_fn ---
    // step 4: child writes 'C' to buf  →  CoW page faults: kernel allocates new physical pages for child
    memset(buf, 'C', SIZE);
    // now: same virtual address → different PFN in parent vs child

    // step 5: child exits; parent frees buf  →  brk shrinks [heap]
Jump to the playground tab and run the command:
./test_clone_cow manual
Then switch back to the deep_in_memory tab and select the process in the left panel.
Results
When test_clone_cow starts, the parent process is visible in the deep_in_memory process list.
After the parent calls malloc(100 kB) and fills the buffer, the [heap] region grows in the virtual memory panel and INIT events appear in the log as the parent's page faults map virtual pages to physical memory.
Once clone() is called, the child process appears in the process list with an identical memory layout — the same heap region address and size — because it received a CoW snapshot. At this moment, both processes share the same underlying physical pages. Enter any virtual address from the [heap] range into the physical memory panel for both the parent and child to confirm they return the same PFN.
When the child writes 'C' into the buffer, CoW page faults fire and INIT events are recorded for the child's pages. The kernel silently allocates new physical pages for the child and remaps its virtual addresses. Look up the same virtual address again in the physical memory panel for both processes — the parent retains its original PFN while the child now has a different one, proving that the physical pages have been split.
Using fork function
fork() is the classic POSIX way to create child processes. Internally, it calls clone() with semantics equivalent to no_sharing — the kernel creates a complete copy-on-write snapshot of the parent's address space for each child. Physical pages are only duplicated when either the parent or a child writes to them (copy-on-write semantics).
test_fork creates 10 worker processes using fork(). Each worker allocates 200 kB via malloc().
Since 200 kB exceeds M_MMAP_THRESHOLD (128 kB), glibc uses the mmap syscall for the allocation, creating a private anonymous memory region in each child's address space.
test_fork.c pseudo code
    // spawn 10 worker processes via fork()
    for (int i = 0; i < WORKERS; i++) {
        pid_t pid = fork();
        if (pid == 0) {
            // child: wait for signal from parent pipe

            // step 1: allocate 200 kB  →  mmap (exceeds M_MMAP_THRESHOLD)
            char *mem = malloc(ALLOC_SIZE);

            // step 2: fill entire allocation with data
            for (size_t i = 0; i < ALLOC_SIZE; i++) mem[i] = (char)i;

            // step 3: free allocation  →  munmap
            free(mem);

            _exit(0);
        }
    }
    // parent: synchronize steps with children via pipes
Jump to the playground tab and run the command:
./test_fork manual
Then switch back to the deep_in_memory tab and select the process in the left panel.
Results
When test_fork starts, the main process spawns 10 child processes using fork().
In deep_in_memory, each child appears as a separate entry in the process list alongside the parent.
When workers call malloc(200 kB), glibc uses mmap to create a new anonymous region in each child's private address space.
As workers write to their allocations, page faults fire and INIT events are recorded per child.
After all workers free their memory and exit, their process entries disappear from the deep_in_memory list and munmap events are logged.
Using pthread library
POSIX threads (pthreads) are the standard Linux threading API. Internally, pthread_create() calls clone3() (newer version of clone()) with the same flags as test_clone_mmap shared_thread — CLONE_VM | CLONE_THREAD | CLONE_SIGHAND | CLONE_FS | CLONE_FILES. All threads share the process's address space, heap, and file descriptors.
test_pthread creates 2 worker threads. Each thread allocates 1 MB via malloc() (which glibc satisfies with mmap due to the allocation size exceeding the threshold), fills it with data, then frees it. The main thread coordinates phases using pthread_barrier_wait().
test_pthread.c pseudo code
    // create 2 worker threads
    for (long i = 0; i < THREADS; i++) {
        pthread_create(&threads[i], NULL, worker, (void*)i);
    }

    // phase 1: all threads allocate 1 MB each  →  mmap per thread
    step = STEP_ALLOC;
    pthread_barrier_wait(&barrier); // release threads to start phase
    pthread_barrier_wait(&barrier); // wait for all threads to finish

    // phase 2: all threads fill their allocations  →  INIT page faults per TID
    step = STEP_MEMSET;
    pthread_barrier_wait(&barrier);
    pthread_barrier_wait(&barrier);

    // phase 3: all threads free their allocations  →  munmap per thread
    step = STEP_FREE;
    pthread_barrier_wait(&barrier);
    pthread_barrier_wait(&barrier);

    // phase 4: threads exit
    step = STEP_EXIT;
    pthread_barrier_wait(&barrier);
    for (int i = 0; i < THREADS; i++) pthread_join(threads[i], NULL);
Jump to the playground tab and run the command:
./test_pthread manual
Then switch back to the deep_in_memory tab and select the process in the left panel.
Results
When test_pthread starts, 2 worker threads are created within the same process.
In deep_in_memory, the process appears as a single entry in the process list; the threads are visible with their distinct TIDs.
As each thread calls malloc(1 MB), glibc issues an mmap syscall, creating a new anonymous region in the shared address space.
New regions appear in the virtual memory panel as threads allocate. Page faults (INIT events) in the log are attributed to individual TIDs as each thread writes to its allocation for the first time.
After the threads free their memory, munmap events are recorded and the allocated regions disappear from the virtual memory panel.
This behavior closely mirrors test_clone_mmap shared_thread — at the kernel level, pthreads and clone() with full sharing flags are the same mechanism.
References
- deep_in_memory source code: github.com/bareckidarek/deep_in_memory
About the Author
More tutorials you might like
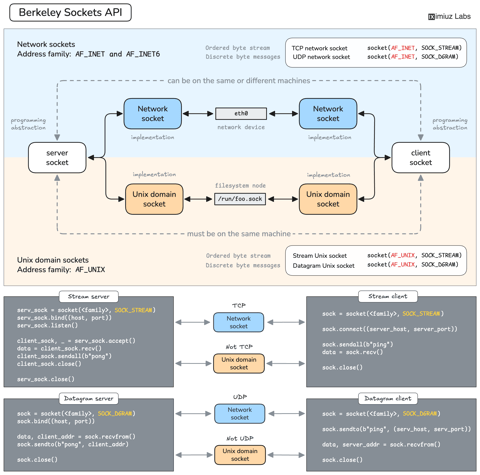
How Servers Work: A Hands-On Introduction to TCP Sockets
Learn how servers actually work by building a tiny TCP server and client from scratch. A hands-on introduction to sockets, TCP, and the network programming model every backend, DevOps, and platform engineer should go through at least once.


Getting Started with VictoriaMetrics on Kubernetes
Deploy VictoriaMetrics on Kubernetes using the VM Operator, configure metrics scraping with CRDs, and query cluster metrics.

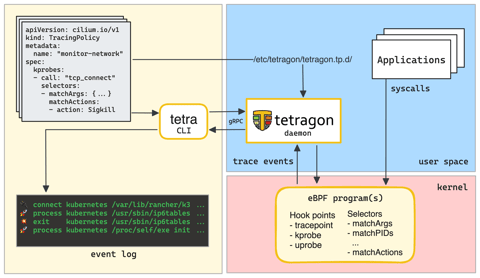
Exploring Tetragon - A Security Observability Tool for Kubernetes, Docker, and Linux
What is Tetragon, how it works, and how to use it to detect and react to security-significant events in your Kubernetes, Docker, or plain Linux environment.
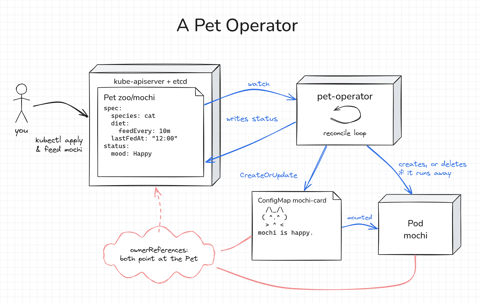
How Kubernetes Operators Work: Building a Controller From Scratch
Build a Kubernetes operator for a small Pet API, first as a 15-line bash loop and then as a Go controller with controller-runtime. Every Pet gets a Pod to live in, gets hungry as time passes, and runs away if nobody feeds it. Along the way, you'll see how the reconcile loop works.

Learn by doing, not just by reading or watching
Sign up for a free account to start a VM playground right on this page, track your progress, and get notified about new learning materials.