Inspecting and Monitoring eBPF Applications

When you start the tutorial, you’ll see a Term 1 terminal and an IDE on the right-hand side. You are logged in as laborant, and the current working directory already contains the ebpf-hello-world folder. Inside, you’ll find the eBPF Hello World labs, implemented with ebpf-go — a Golang eBPF framework developed as part of the Cilium project.
This tutorial serves as the continuation of From Zero to Your First eBPF Program and Storing Data in eBPF: Your First eBPF Map, expanding on the introduced concepts.
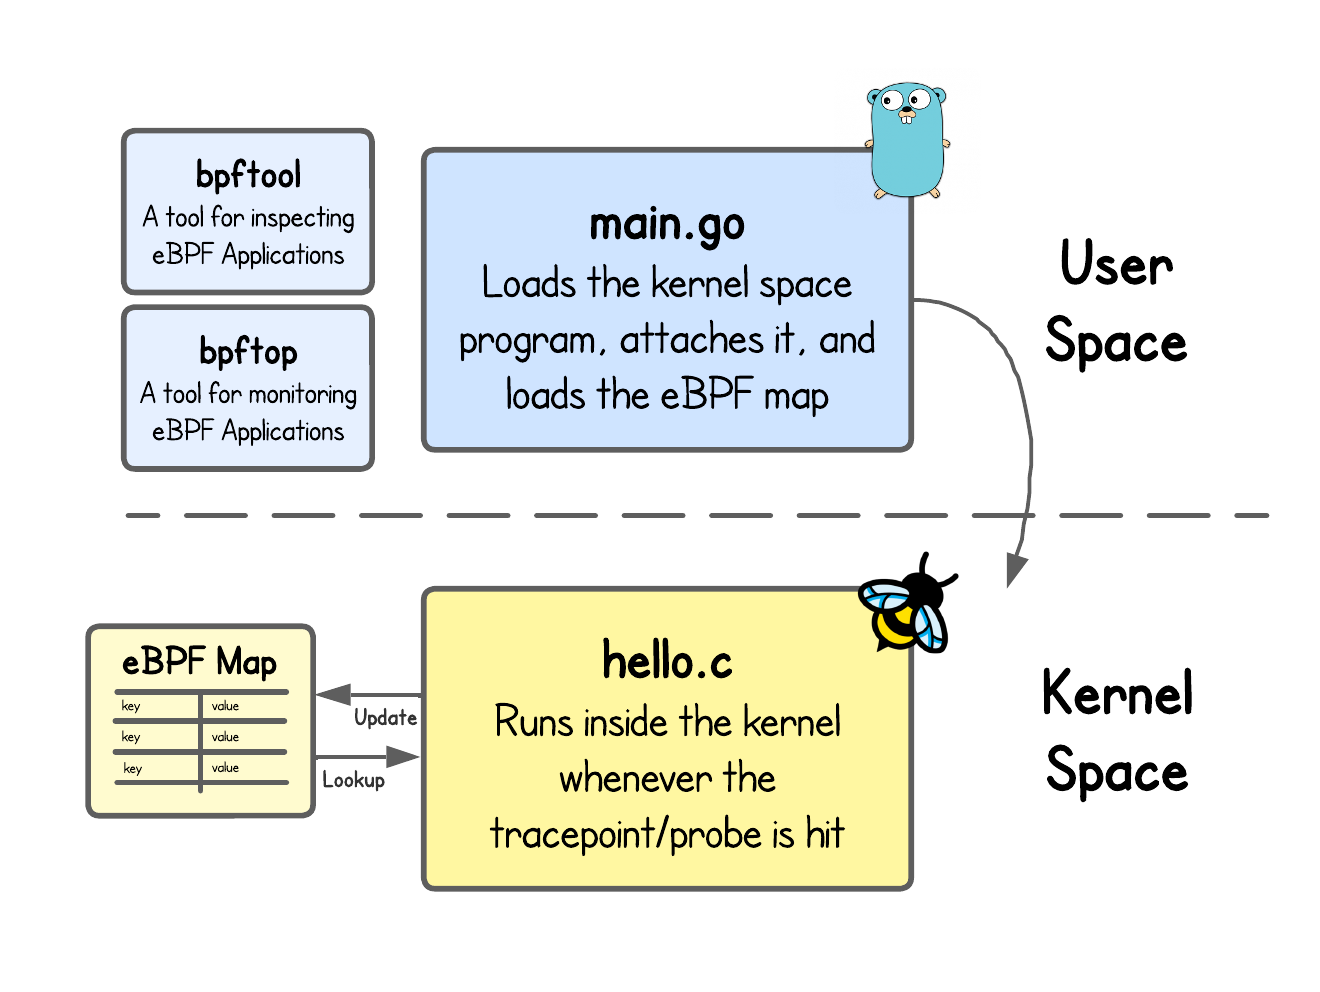
In this part, we’ll learn how to use bpftool to inspect eBPF programs and maps in the kernel, and bpftop, a top-like interface for monitoring eBPF program activity in real time.
Before we can inspect or monitor anything, we first need some eBPF application running. The code for this lab is in ebpf-hello-world/lab3 directory. Open the Term 1 terminal, navigate to this folder, then build and run the eBPF application as you did in the previous tutorials.
Forgot how to do it?
Using go generate you compile the eBPF kernel program (hello.c) into an object file (hello_bpf.o) and generate a Go source file (hello_bpf.go) that embeds the object and provides user space helper functions to work with it.
go generate
Then go build picks up the main.go and hello_bpf.go and builds the final eBPF application binary lab3.
go build
Finally, run the eBPF Application using:
sudo ./lab3
Inspecting eBPF Applications
Inspecting eBPF applications is useful for debugging and validation, since it lets you confirm that your programs and maps are correctly loaded into the kernel, or when and by whom the program was loaded. It also gives you visibility into the internal state of maps, so you can track how map entries change over time - like our exec_count eBPF map in our previous tutorial.
The most widely used tool for this purpose is bpftool, maintained within the upstream Linux kernel.
Since this in a eBPF playground, this tool is already installed. Open the Term 2 tab on the right (click the + at the top), and run:
sudo bpftool --help
Why do you need to run it using `sudo`?
Most bpftool operations interact directly with the kernel. Loading, attaching, or inspecting eBPF programs and maps requires privileged access to kernel resources.
As noted in the first tutorial, these actions are limited to processes with CAP_BPF, CAP_SYS_ADMIN, or other specific capabilities—privileges typically granted only to root or processes started with sudo.
Here are some common use cases of bpftool.
Listing and Inspecting eBPF Programs
You can use bpftool to view detailed information about eBPF programs. This includes attributes such as which user loaded the program, when it was loaded, and whether it is currently attached.
sudo bpftool prog list # Shows all eBPF programs currently loaded into the kernel, regardless of whether they are attached to a hook or not.
...
15: tracepoint  name handle_execve_tp  tag 8236b54ceef5a3ce  gpl
        loaded_at 2025-08-28T07:36:11+0000  uid 0
        xlated 560B  jited 375B  memlock 4096B  map_ids 5,7
        btf_id 6
What is the difference between loaded and attached eBPF program?
An eBPF program is loaded when it has been verified and accepted into the kernel, but it isn’t yet active. We'll talk about the verification process in an upcoming tutorial.
A program becomes active and attached when it is bound to a specific hook (like tracepoint/syscalls/sys_enter_execve in our code example), meaning the kernel will actually run it when that event occurs.
The program in the example output above has been assigned the ID 15. This "identity" is a unique number assigned to each eBPF program when it’s loaded into the kernel.
Knowing the ID, you can ask bpftool to show more information about this program.
sudo bpftool prog show id 15 --pretty
{
    "id": 15,
    "type": "tracepoint",
    "name": "handle_execve_tp",
    "tag": "8236b54ceef5a3ce",
    "gpl_compatible": true,
    "loaded_at": 1756366571,
    "uid": 0,
    "orphaned": false,
    "bytes_xlated": 560,
    "jited": true,
    "bytes_jited": 375,
    "bytes_memlock": 4096,
    "map_ids": [5,7],
    "btf_id": 6
}
What are all these output variables?
- id: Unique ID of the eBPF program.
- type: Type of the eBPF program.
- name: Name of the eBPF program, which is the function name from the source code.
- tag: SHA (Secure Hashing Algorithm) sum of the program’s instructions, which can be used as another identifier for the program. The program ID can change every time you load or unload the program, but the tag will remain the same. In fact, you get the same output for all of the following commands
sudo bpftool prog show id 15
sudo bpftool prog show name handle_execve_tp
sudo bpftool prog show tag 8236b54ceef5a3ce
- gpl_compatible: Whether the program is defined with a GPL-compatible license, i.e.,
char _license[] SEC("license") = "GPL";in our kernel code. - loaded_at: Unix timestamp showing when the program was loaded.
- uid: User that loaded the eBPF program. In this case, it is User ID 0 (which is root).
- orphaned: Whether the program is loaded in the kernel but no longer has any active attachment to a hook.
- bytes_xlated: Size of translated eBPF bytecode (e.g., 560 bytes) after verifier checks and possible kernel modifications; pretty low-level but not yet machine code.
- jited: Whether the eBPF program was JIT-compiled from translated eBPF bytecode into native CPU instructions.
- bytes_jited: Size of generated machine code after JIT compilation (e.g., 375 bytes).
- bytes_memlock: Amount of memory reserved (e.g., 4,096 bytes) in RAM that cannot be paged out.
- map_ids: IDs of eBPF maps referenced by this program.
- btf_id: ID of the program’s associated BTF (BPF Type Format) information. We'll learn about BTF later.
We can also inspect the eBPF bytecode loaded into the kernel (after it’s been verified and possibly modified).
sudo bpftool prog dump xlated id 15
int handle_execve_tp(struct trace_event_raw_sys_enter * ctx):
; const char *filename = (const char *)ctx->args[0];
   0: (79) r3 = *(u64 *)(r1 +16)
   1: (b7) r1 = 0
; struct path_key key = {};
   2: (7b) *(u64 *)(r10 -8) = r1
   3: (7b) *(u64 *)(r10 -16) = r1
   4: (7b) *(u64 *)(r10 -24) = r1
   5: (7b) *(u64 *)(r10 -32) = r1
   6: (7b) *(u64 *)(r10 -40) = r1
   7: (7b) *(u64 *)(r10 -48) = r1
   8: (7b) *(u64 *)(r10 -56) = r1
...
💡 To understand eBPF bytecode, you need to be familiar with how eBPF uses its registers and with the (unofficial) eBPF instructions set.
Or even look at the Just-in-Time (JIT) compiled machine code produced for the same program:
sudo bpftool prog dump jited id 15
int handle_execve_tp(struct trace_event_raw_sys_enter * ctx):
bpf_prog_8236b54ceef5a3ce_handle_execve_tp:
; const char *filename = (const char *)ctx->args[0];
   0:   nopl   0x0(%rax,%rax,1)
   5:   xchg   %ax,%ax
   7:   push   %rbp
   8:   mov    %rsp,%rbp
   b:   sub    $0x108,%rsp
  12:   mov    0x10(%rdi),%rdx
  16:   xor    %edi,%edi
; struct path_key key = {};
  18:   mov    %rdi,-0x8(%rbp)
  1c:   mov    %rdi,-0x10(%rbp)
  20:   mov    %rdi,-0x18(%rbp)
  24:   mov    %rdi,-0x20(%rbp)
  28:   mov    %rdi,-0x28(%rbp)
  2c:   mov    %rdi,-0x30(%rbp)
  30:   mov    %rdi,-0x38(%rbp)
...
This lets you debug or simply learn how your original C code is transformed first into eBPF instructions and then into native CPU instructions.
Listing and Managing eBPF Maps
With bpftool, you can also list, create, update, and delete eBPF map entries.
sudo bpftool map list # Shows all eBPF Maps loaded into the kernel
...
5: hash  name exec_count  flags 0x0
        key 256B  value 8B  max_entries 16384  memlock 5378048B
        btf_id 4
...
Knowing the ID, you can ask bpftool to dump maps content, using:
sudo bpftool map dump id 5
Or lookup a specific map entry:
keyhex=$(python3 - <<'PY'
s=b"/bin/bash\0".ljust(256, b"\x00")
print(" ".join(f"{b:02x}" for b in s))
PY
)
sudo bpftool map lookup id 5 key hex $keyhex
💡 Since we perform the lookup using the hex value of the key, we need to provide the exact 256-byte key the map expects. In our example, we perform the lookup using the /bin/bash key which is slightly tedious to convert.
Or update a value under a specific key in the map:
keyhex=$(python3 - <<'PY'
s=b"/bin/bash\0".ljust(256, b"\x00")
print(" ".join(f"{b:02x}" for b in s))
PY
)
sudo bpftool map update id 5 key hex $keyhex value hex 2a 00 00 00 00 00 00 00
💡 The map’s value size is 8 bytes (__u64), so we must provide it in little-endian order. In this case, setting the value to 42 is expressed as 2a 00 00 00 00 00 00 00.
Or delete a specific entry:
keyhex=$(python3 - <<'PY'
s=b"/bin/bash\0".ljust(256, b"\x00")
print(" ".join(f"{b:02x}" for b in s))
PY
)
sudo bpftool map delete id 5 key hex $keyhex
In practice, your eBPF applications will do all the updates/lookups to the eBPF map, but while debugging your code - these commands often come quite useful.
Debugging and Tracing
Up to this point, we’ve always printed the eBPF kernel program logs using:
sudo cat /sys/kernel/debug/tracing/trace_pipe
But exactly the same, can be achieved using:
sudo bpftool prog trace
There’s NO option in bpftool prog trace to only show logs from one particular eBPF program. So, whichever program calls bpf_printk(), the logs are all combined and interleaved in the output of this command.
Anyways, bpf_printk() should only be utilized during the development. Not only high-frequency events can overwhelm the logs/trace buffer and the output of the mentioned commands is corrupted, but also they can cause significant performance overhead on your eBPF application.
Generating the vmlinux.h File
At a high level, an eBPF program needs access to kernel context and data structures to do anything meaningful.
For example, when tracing the execve system call, we accessed the executable path and its arguments. These are exposed through the trace_event_raw_sys_enter struct — which is defined in vmlinux.h.
This header can be generated from /sys/kernel/btf/vmlinux, a file that contains the kernel’s type information (structs, enums, typedefs, function prototypes, etc.), using:
bpftool btf dump file /sys/kernel/btf/vmlinux format c > vmlinux.h
💡 We’ve included this file in the code repository to make the examples feel more plug-and-play. In practice, however, this only makes sense in environments where the kernel version is fixed (e.g., a VM image like this one).
For other cases, the header should be generated at build time, either through the Makefile or a //go:generate directive in user space program.
//go:generate sh -c "bpftool btf dump file /sys/kernel/btf/vmlinux format c > vmlinux.h"
Listing Available eBPF Features
If you've followed carefully, we’ve used several eBPF helper functions so far, such as bpf_probe_read_user_str, bpf_map_lookup_elem, and bpf_map_update_elem in our kernel program.
But where can you find the complete list of helpers, and are they all available for every program type?
In fact, you can check the eBPF features supported by your kernel with:
sudo bpftool feature probe kernel
Scanning system configuration...
bpf() syscall for unprivileged users is enabled
JIT compiler is enabled
JIT compiler hardening is disabled
JIT compiler kallsyms exports are enabled for root
Global memory limit for JIT compiler for unprivileged users is 796917760 bytes
CONFIG_BPF is set to y
CONFIG_BPF_SYSCALL is set to y
CONFIG_HAVE_EBPF_JIT is set to y
CONFIG_BPF_JIT is set to y
...

Scanning eBPF program types...
eBPF program_type socket_filter is available
eBPF program_type kprobe is available
eBPF program_type tracepoint is available
eBPF program_type xdp is available
...

Scanning eBPF map types...
eBPF map_type hash is available
eBPF map_type array is available
eBPF map_type prog_array is available
eBPF map_type perf_event_array is available
...
Scanning eBPF helper functions...
eBPF helpers supported for program type socket_filter:
        - bpf_map_lookup_elem
        - bpf_map_update_elem
        - bpf_map_delete_elem
        - bpf_ktime_get_ns
        - bpf_get_prandom_u32
...
The output is quite long, and we haven’t yet covered most of these eBPF program or helper functions—but you get the idea.
This command is especially useful when developing programs across different distributions or kernel versions, since not every feature is always enabled or available.
For example, if you want to check whether your eBPF program type supports bpf_get_socket_cookie() helper function (returns a unique, stable identifier for a socket, allowing you to correlate packets with the same connection across different hooks), this command will tell you.
Other ways to check available eBPF features
bpftool feature probe kernel is useful, but not always a one-size-fits-all solution. A limitation is that it only reports features of the currently running kernel and there’s no built-in way to check whether a specific helper is supported in another kernel version without running that kernel.
In our experience, bpftool can also fail to determine helper support for certain program types, showing messages like:
eBPF helpers supported for program type tracing: Could not determine which helpers are available
With that in mind, we outlined several alternative approaches in one of our blog posts.
There’s much more to bpftool, but here we’ve highlighted some lesser-known features that will come in handy as you progress through these tutorials.
Monitoring eBPF Applications
When you’re running multiple eBPF programs in the kernel, it’s not always directly obvious what they’re doing or how much impact they’re having on the system. That’s where bpftop (developed by Netflix) comes in—a top-like tool for eBPF that lets you monitor your programs.
Since this in a eBPF playground, this tool is already installed. Run it, using:
sudo bpftop
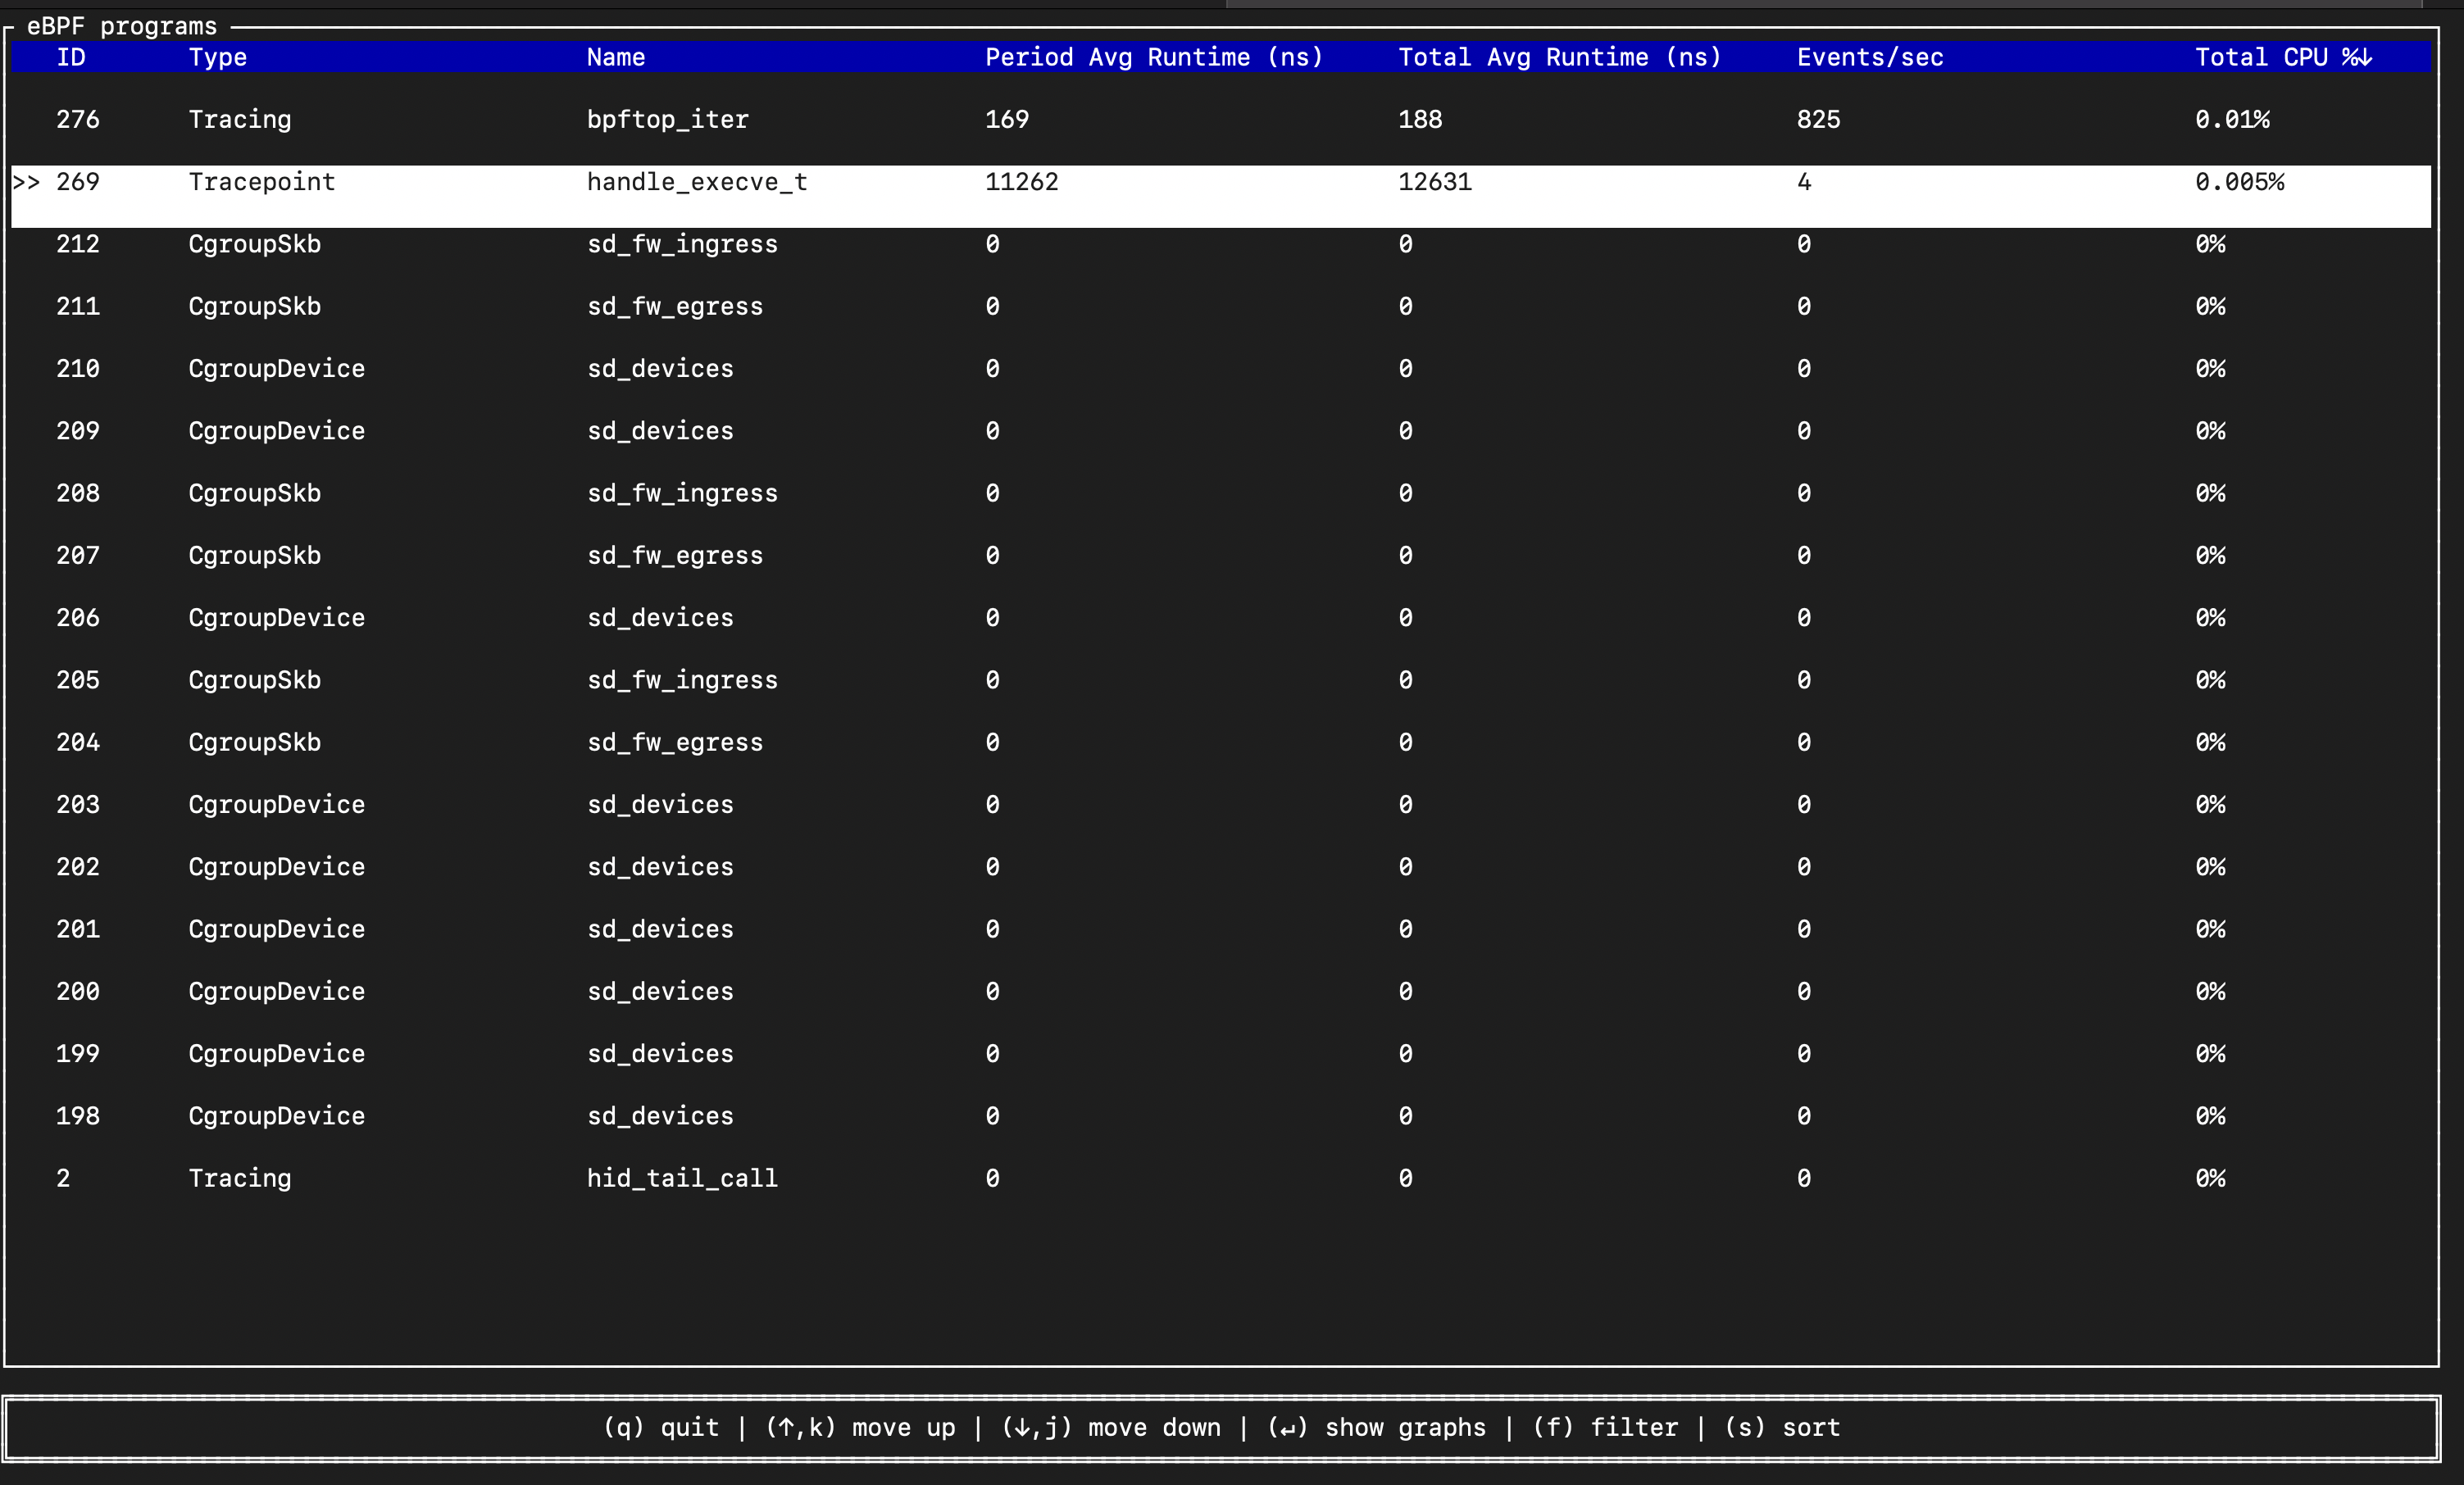
When you start bpftop it's gonna open a list of all the eBPF programs running in the kernel (first image). Choose your program using ↓ and ↑ and click Enter.
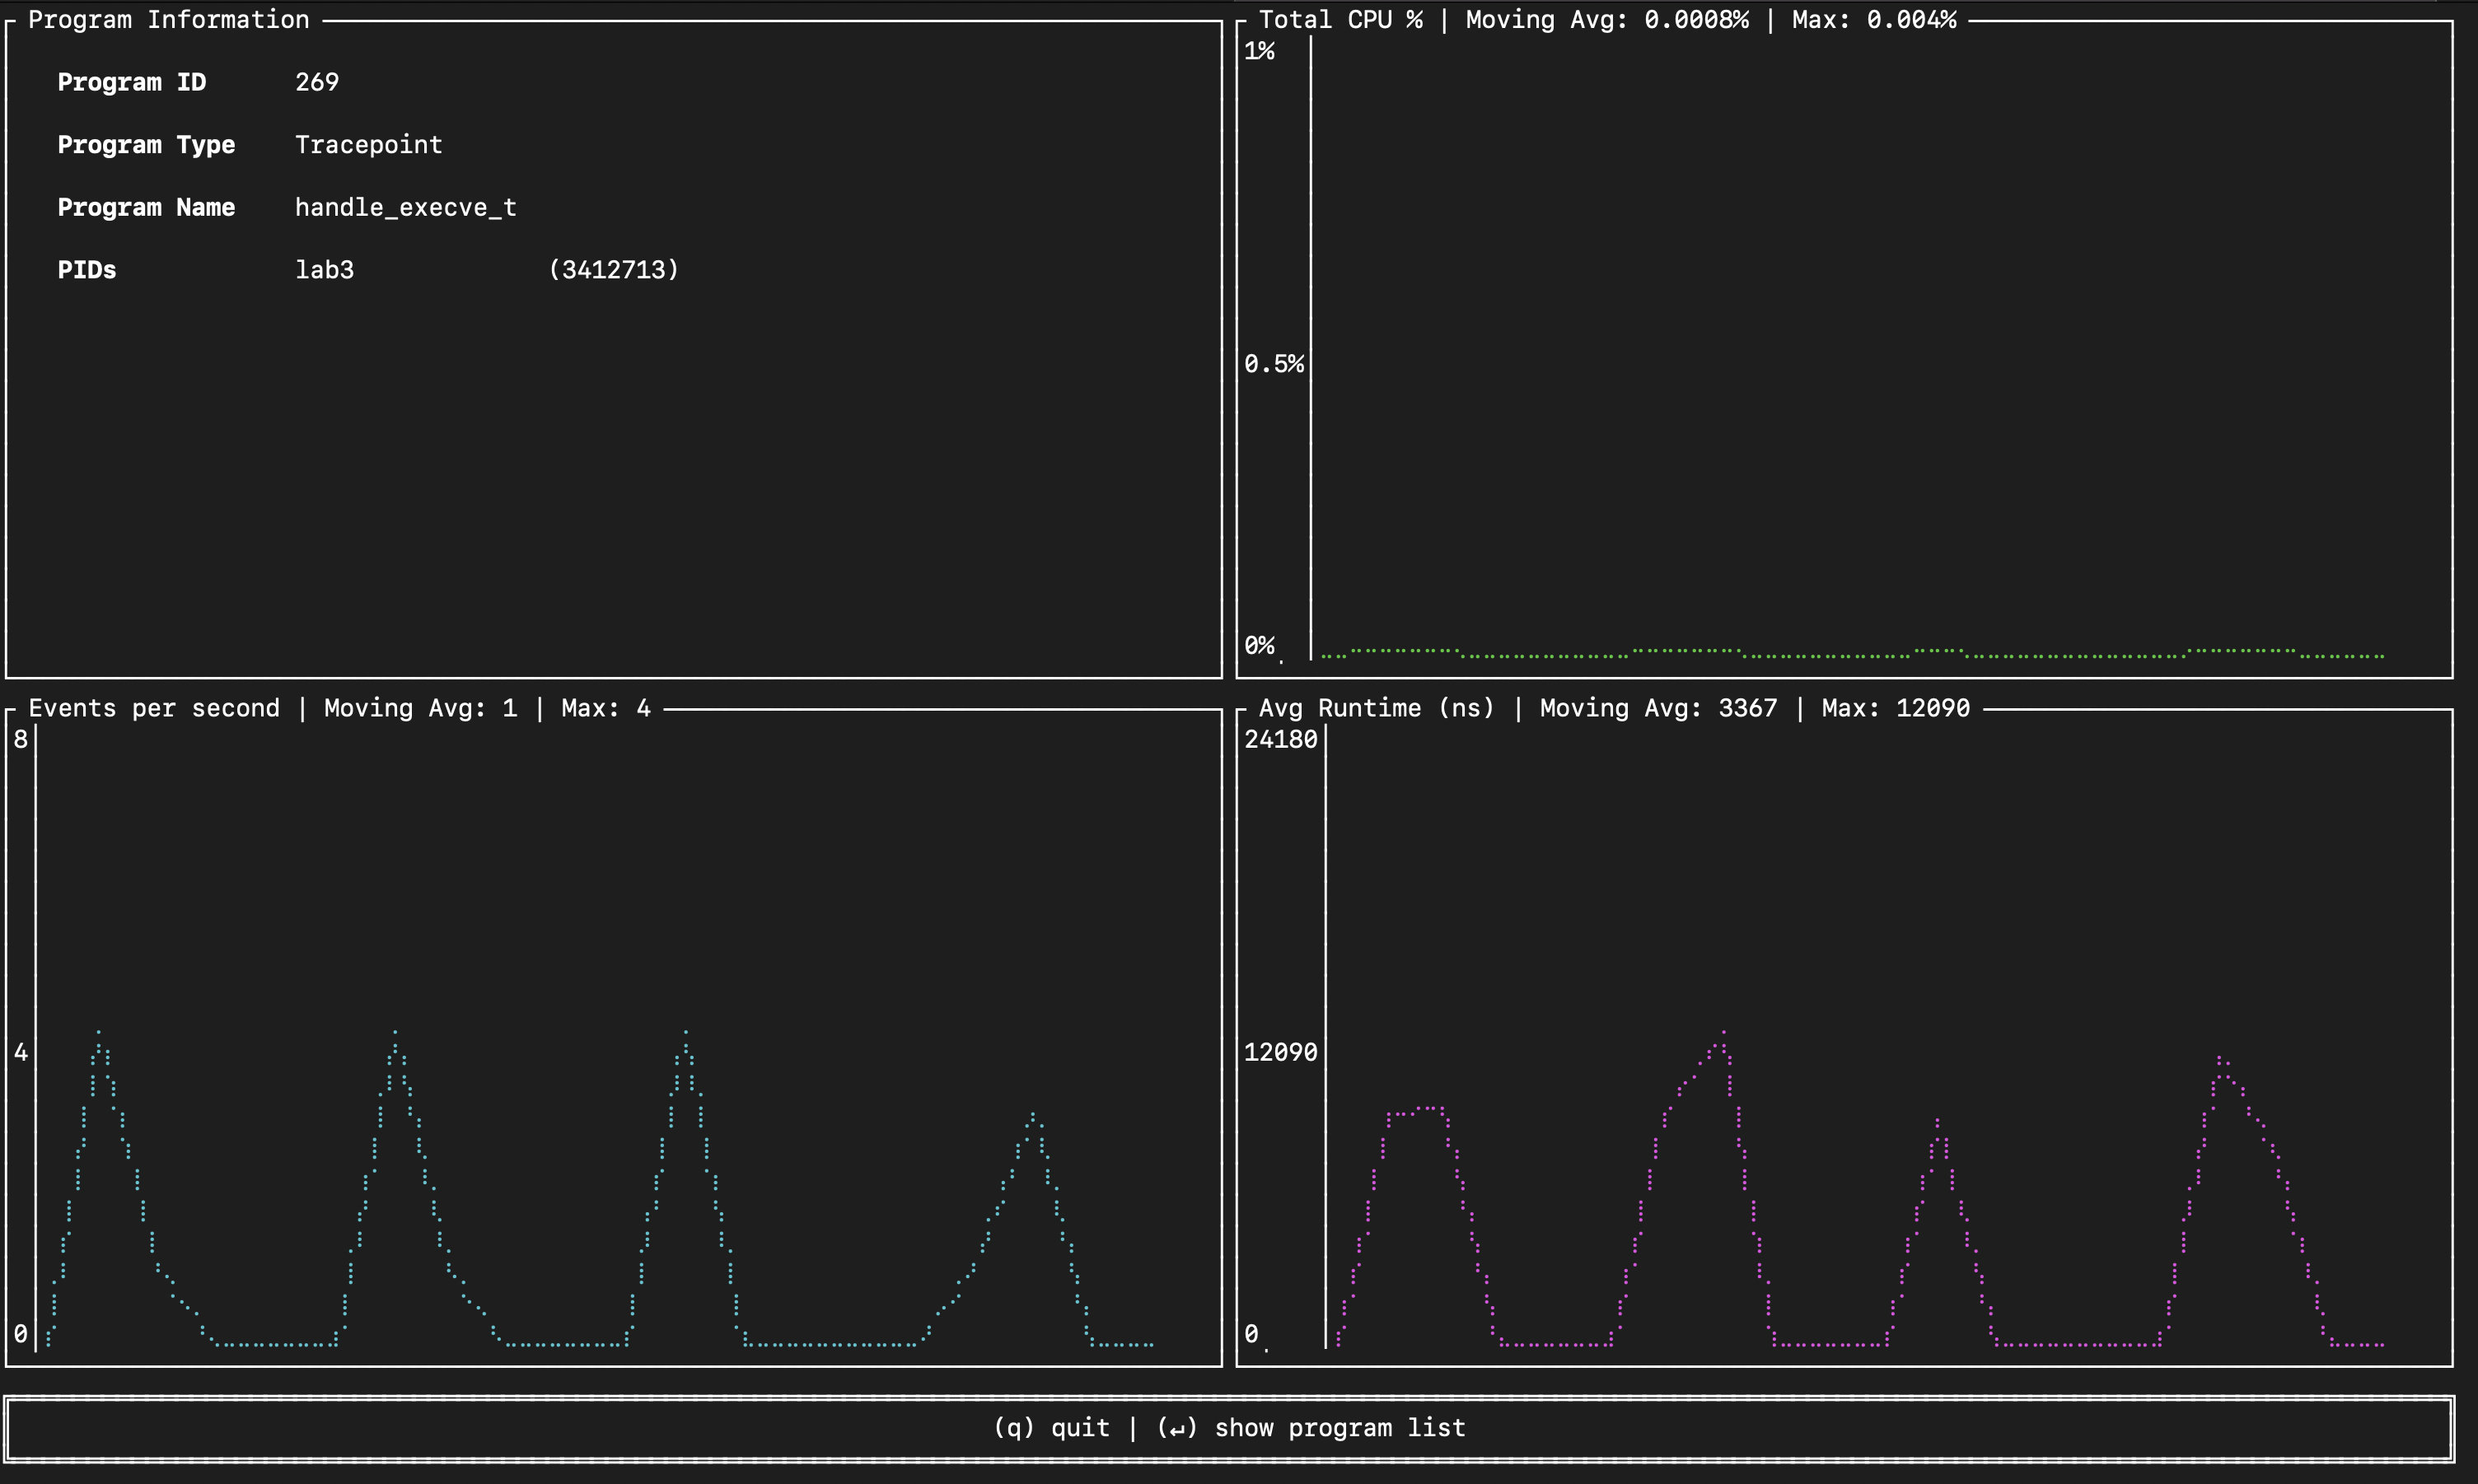
After that, you will see four panels (second image):
- Top-left (Program Information): Program ID, type, name and user space processes that reference BPF programs (in our case our
lab3binary but might be empty for older kernels). - Top-right (Total CPU %): Time-series of CPU usage for the program (moving avg ~0.0008%, max 0.004%).
- Bottom-left (Events per second): Bursty executions with peaks up to 4 eps and a moving avg of 1.
- Bottom-right (Avg Runtime in ns): Execution time per run; moving avg ~3367 ns (~3.3 µs), max ~12090 ns, shown as periodic spikes corresponding to occuring events (captured
execve()syscalls).
💡 bpftop enables global eBPF runtime stats via BPF_ENABLE_STATS (disabled by default). The per-run monitoring (timestamps, counters/atomics) adds overhead and can hurt throughput/latency—especially at high rates—so it's should be used only for debugging or profiling during development.
Congrats, you've came to the end of this tutorial. 🥳
In the next tutorial, you’ll learn how the eBPF verifier ensures that eBPF code can run safely in the kernel.
About the Author
Writes about
Frequently covers