KubeBlocks Tutorial 401 – Observability in Action

Welcome to the fourth chapter of our KubeBlocks tutorial series!
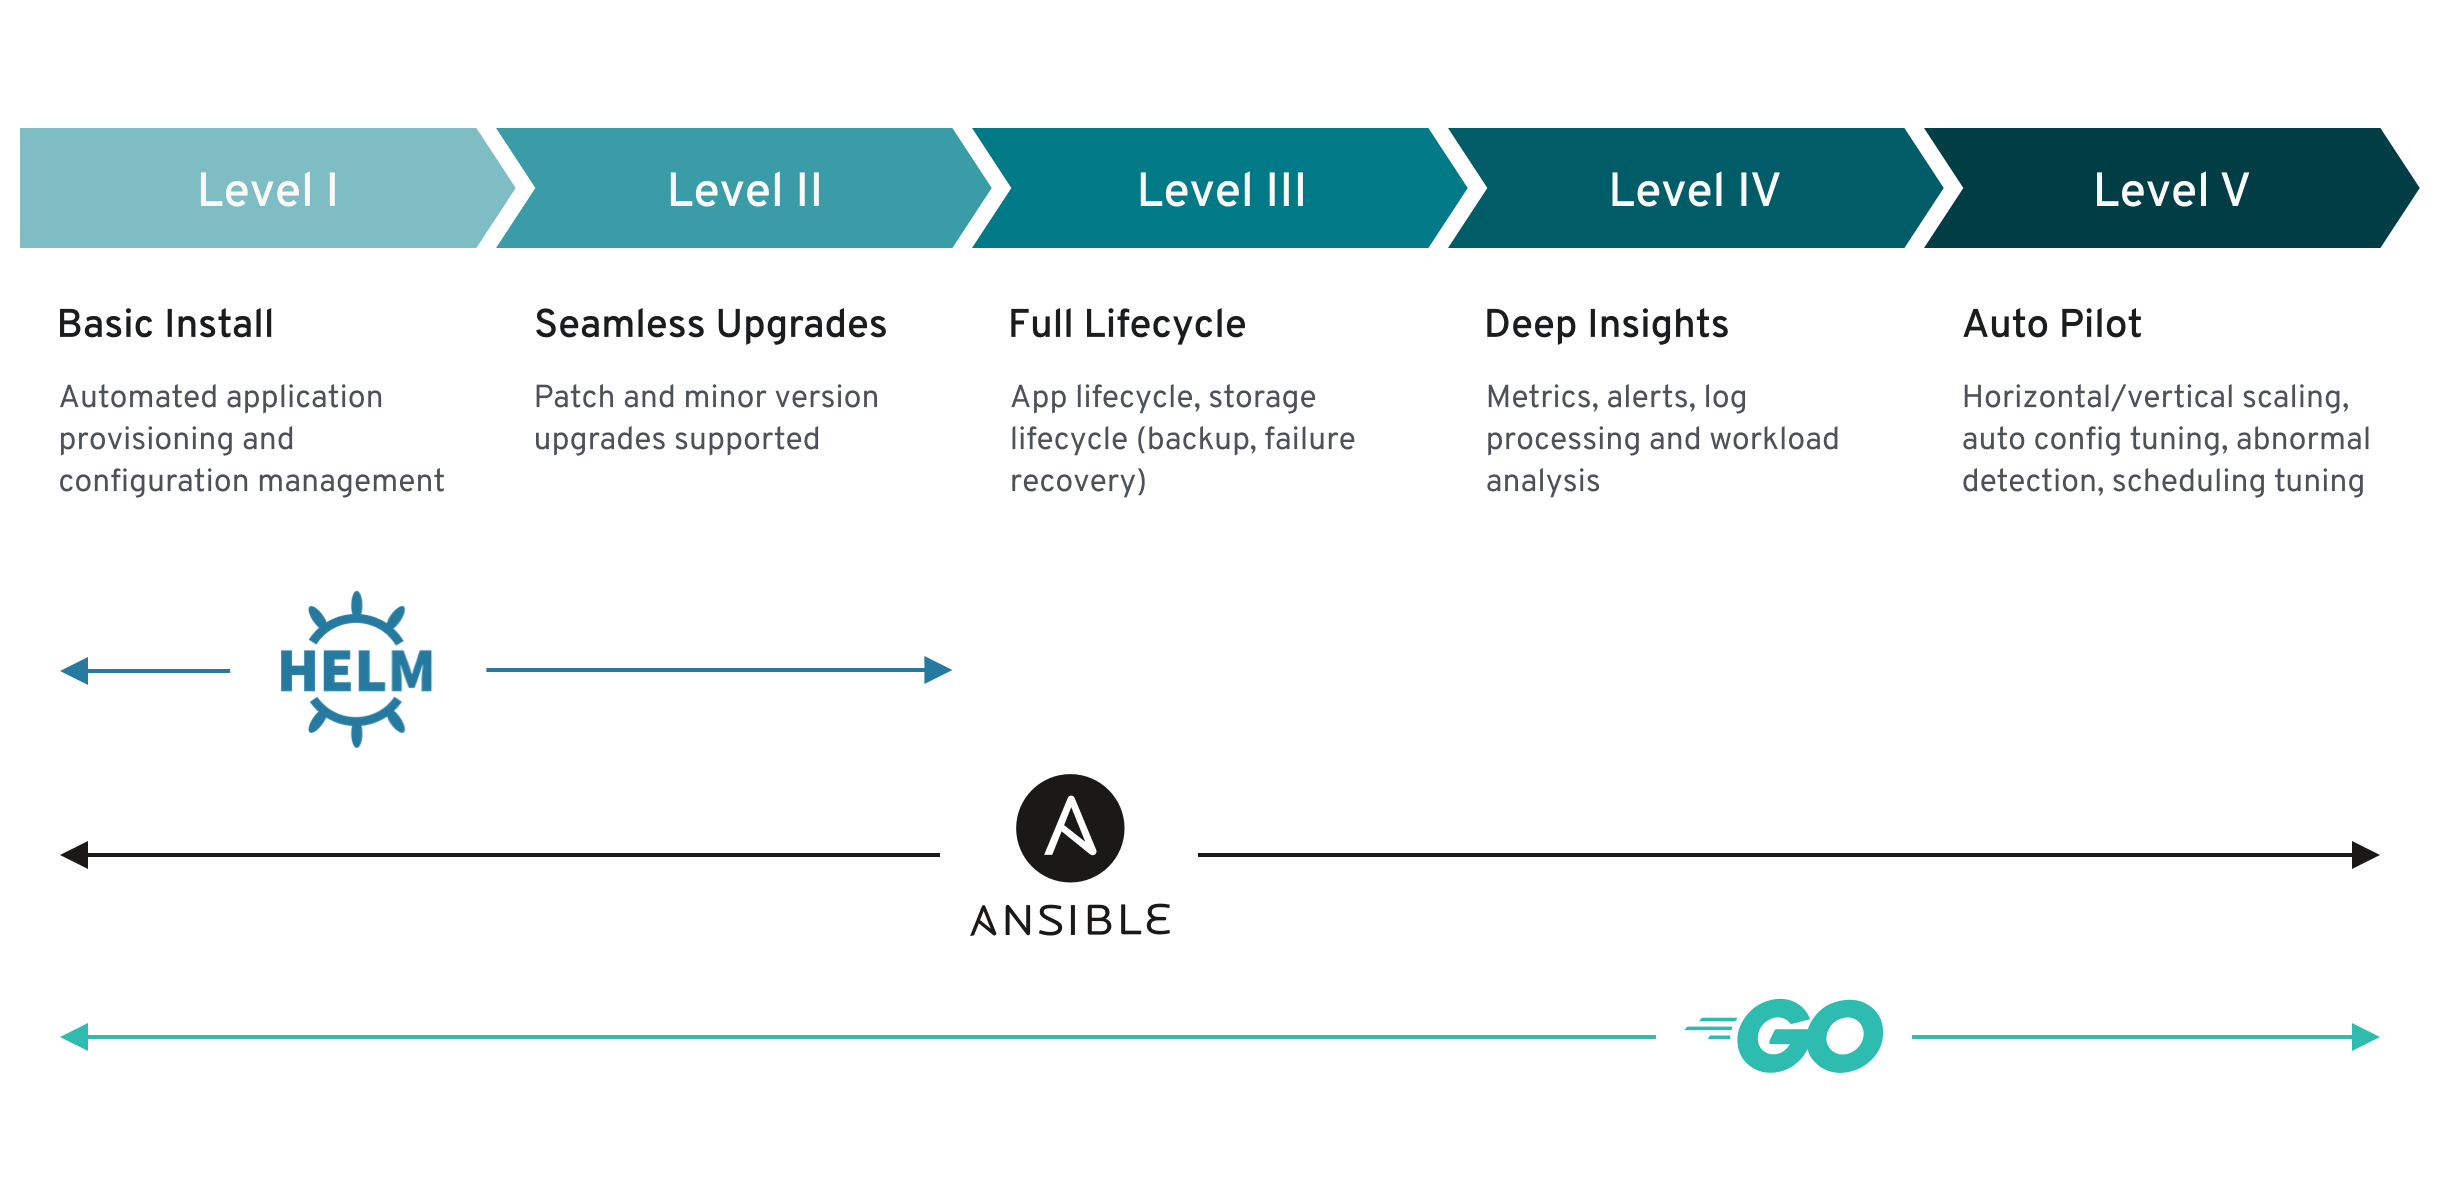
In this tutorial, we’ll explore Observability—a key feature of Operator Capability Level 4. You’ll learn how to monitor, analyze, and troubleshoot your database clusters on Kubernetes with built-in observability features.
👋 If you find KubeBlocks helpful, please consider giving us a star ⭐️ on our GitHub repository. Every star motivates us to make KubeBlocks even better!
Prerequisites
To save you time, we’ve automatically installed KubeBlocks and created a MySQL cluster in the background. It may take a few minutes to complete the setup—feel free to proceed, but keep in mind that some commands might need to wait until the installation is fully finished.
If you’re new to KubeBlocks or missed the previous tutorials, see:
- KubeBlocks Tutorial 101 – Getting Started
- KubeBlocks Tutorial 201 - Seamless Upgrades
- KubeBlocks Tutorial 301 - Backup & Restore
1. Introduction
What is Observability?
Observability in Kubernetes involves monitoring metrics, logs, and events to gain actionable insights into your system’s behavior. By analyzing this data, you can diagnose issues, pinpoint performance bottlenecks, and ensure that your clusters run smoothly.
Enhanced Metrics Exporting:
KubeBlocks automatically deploys a metrics exporter for each database instance (Pod). This built-in exporter collects detailed performance data in real time, seamlessly integrating with Prometheus to help you monitor resource usage and overall system health.
Key Features:
- Metrics:
KubeBlocks scrapes a wide range of cluster metrics via Prometheus, enabling continuous monitoring of resource usage and performance. - Alerting:
Set up alerts to notify you when critical events or performance thresholds are exceeded, ensuring issues are addressed promptly.
2. Enabling Observability for a KubeBlocks Cluster
To fully leverage observability in KubeBlocks, you need to set up monitoring tools such as Prometheus and Grafana. Follow the steps below to install and configure these tools in your Kubernetes cluster.
2.1 Install Prometheus Operator and Grafana
- Create a Monitoring Namespace
It is a best practice to isolate monitoring components in their own namespace. Create a new namespace calledmonitoring:
kubectl create namespace monitoring
- Add the Prometheus Community Helm Repository
This repository contains the official Helm chart for the Prometheus Operator:
helm repo add prometheus-community https://prometheus-community.github.io/helm-charts
- Install the Prometheus Operator (kube-prometheus-stack)
Use Helm to install the Prometheus Operator and Grafana. This command configures Grafana and Prometheus as NodePort services, exposing them on ports32000and32001respectively.
helm install prometheus-operator prometheus-community/kube-prometheus-stack \
  --namespace monitoring \
  --timeout 10m \
  --set grafana.service.type=NodePort \
  --set grafana.service.nodePort=32000 \
  --set prometheus.service.type=NodePort \
  --set prometheus.service.nodePort=32001 \
  --set alertmanager.service.type=NodePort \
  --set alertmanager.service.nodePort=32002
- Verify the Installation
Check that all the monitoring components are running in themonitoringnamespace:
kubectl get pods -n monitoring
You should be able to see output like this
NAME                                                     READY   STATUS    RESTARTS   AGE
alertmanager-prometheus-operator-kube-p-alertmanager-0   2/2     Running   0          4m24s
prometheus-operator-grafana-5f5b9584b8-qmzqm             3/3     Running   0          4m30s
prometheus-operator-kube-p-operator-8fd7b657-rc9c6       1/1     Running   0          4m30s
prometheus-operator-kube-state-metrics-75597dbd5-xr96v   1/1     Running   0          4m30s
prometheus-operator-prometheus-node-exporter-bcsqr       1/1     Running   0          4m30s
prometheus-operator-prometheus-node-exporter-hbvjv       1/1     Running   0          4m30s
prometheus-operator-prometheus-node-exporter-rpngp       1/1     Running   0          4m30s
prometheus-prometheus-operator-kube-p-prometheus-0       2/2     Running   0          4m23s
2.2 Monitor a Database Cluster
After setting up Prometheus and Grafana, configure them to monitor your KubeBlocks database cluster.
- Create a PodMonitor Resource
APodMonitorresource instructs Prometheus on which pods to scrape for metrics. In this example, thePodMonitoris configured to monitor the MySQL component of yourmyclusterdatabase (running in thedemonamespace). The labels specified help Prometheus to correctly associate the metrics with your database cluster.
kubectl apply -f - <<EOF
apiVersion: monitoring.coreos.com/v1
kind: PodMonitor
metadata:
  name: mycluster-pod-monitor
  namespace: monitoring # Namespace where the Prometheus operator is installed
  labels:               # Labels to match the Prometheus operator’s podMonitorSelector
    release: prometheus-operator
spec:
  jobLabel: kubeblocks-service
  # Transfer selected labels from the associated pod onto the ingested metrics
  podTargetLabels:
  - app.kubernetes.io/instance
  - app.kubernetes.io/managed-by
  - apps.kubeblocks.io/component-name
  - apps.kubeblocks.io/pod-name
  podMetricsEndpoints:
    - path: /metrics
      port: http-metrics
      scheme: http
  namespaceSelector:
    matchNames:
      - demo
  selector:
    matchLabels:
      app.kubernetes.io/instance: mycluster
      apps.kubeblocks.io/component-name: mysql
EOF
- Enable Metrics Exporter for the Database Cluster
Ensure that your database cluster is exporting metrics by enabling the exporter. Patch the cluster configuration to setdisableExportertofalsefor the relevant component (in this case, the MySQL component):
kubectl patch cluster mycluster -n demo --type "json" -p '[{"op":"add","path":"/spec/componentSpecs/0/disableExporter","value":false}]'
This configuration enables Prometheus to scrape metrics from your MySQL pods, allowing you to monitor the performance and health of your database cluster.
3. Accessing and Visualizing Metrics
With Prometheus and Grafana deployed and properly configured, you can now access and visualize your cluster’s metrics.
In the Iximiuz Lab interface, Switch to the Grafana tab. Once you are on the Grafana page, log in using the following credentials:
- Username:
admin - Password:
prom-operator
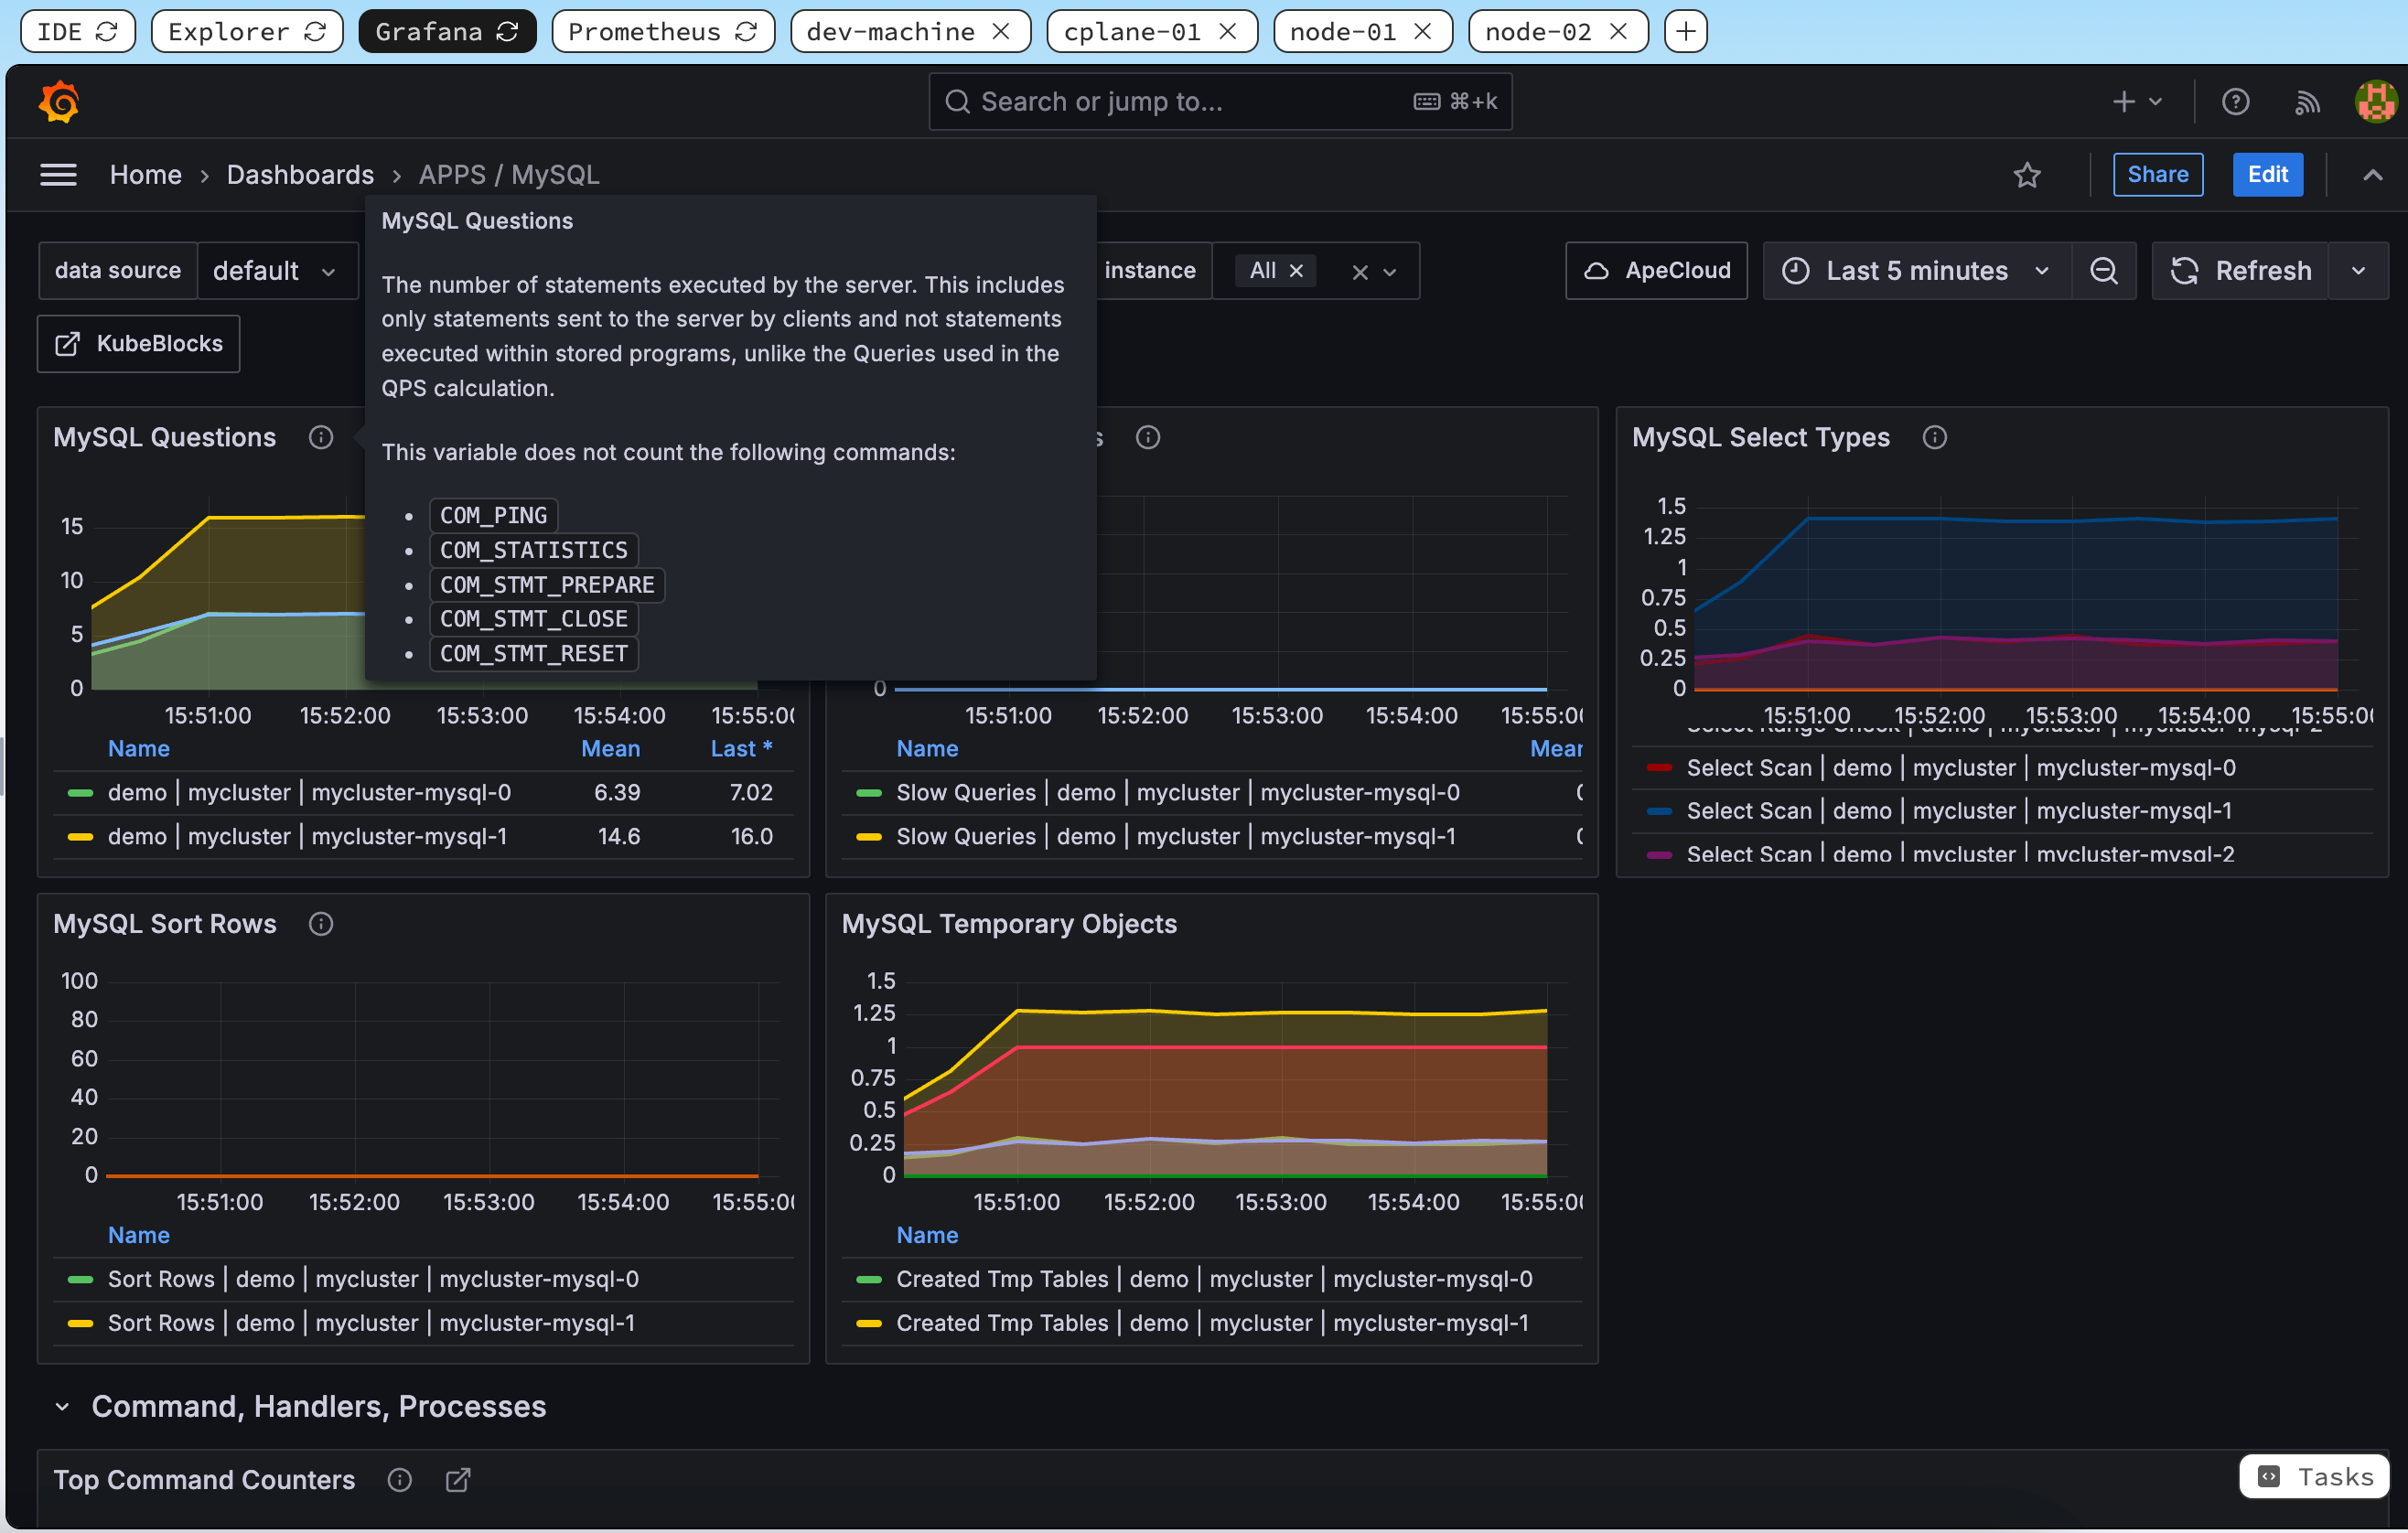
After logging in, click on the Home tab in the left-hand menu, then navigate to Dashboards > APPS / MySQL. Here, you will find the MySQL Dashboard displaying key metrics such as query performance, resource usage, and overall operational status.
These visualizations provide you with real-time insights into your database cluster's health and performance, enabling you to quickly identify and troubleshoot issues, and ensuring that your KubeBlocks-managed database clusters run efficiently.
⏳ This may take a minute. If you don't see it, please wait a moment and refresh the tab.
4. Alerts and Anomaly Detection
In this section, we create a service-level alert for MySQL to detect when an instance goes offline. This alert monitors the MySQL service in the demo namespace and will trigger immediately when an instance goes down.
We create a PrometheusRule custom resource (CR) that instructs Prometheus to evaluate the condition for the MySQL service. In this case, if mysql_up{namespace="demo"} equals 0, it indicates that the MySQL instance is not running, and an alert will be triggered immediately.
kubectl apply -f - <<EOF
apiVersion: monitoring.coreos.com/v1
kind: PrometheusRule
metadata:
  name: mysql-restart-alert
  namespace: monitoring
  labels:
    release: prometheus-operator
spec:
  groups:
  - name: mysql.rules
    rules:
    - alert: MySQLInstanceDown
      expr: mysql_up{namespace="demo"} == 0
      labels:
        severity: warning
      annotations:
        summary: "MySQL instance is down"
        description: "MySQL instance {{ $labels.pod }} in namespace demo is down"
EOF
Next, we apply an AlertmanagerConfig custom resource to customize how alerts are routed and handled. While Prometheus generates alerts based on your rules, Alertmanager is responsible for grouping, silencing, and routing those alerts.
In our example, we configure Alertmanager to route alerts to a "null" receiver, which effectively discards the alerts for demonstration purposes.
kubectl apply -f - <<EOF
apiVersion: monitoring.coreos.com/v1alpha1
kind: AlertmanagerConfig
metadata:
  name: mysql-null-config
  namespace: monitoring
spec:
  route:
    receiver: 'null'
    groupBy: ['alertname']
    groupWait: 10s
    groupInterval: 1m
  receivers:
  - name: 'null'
EOF
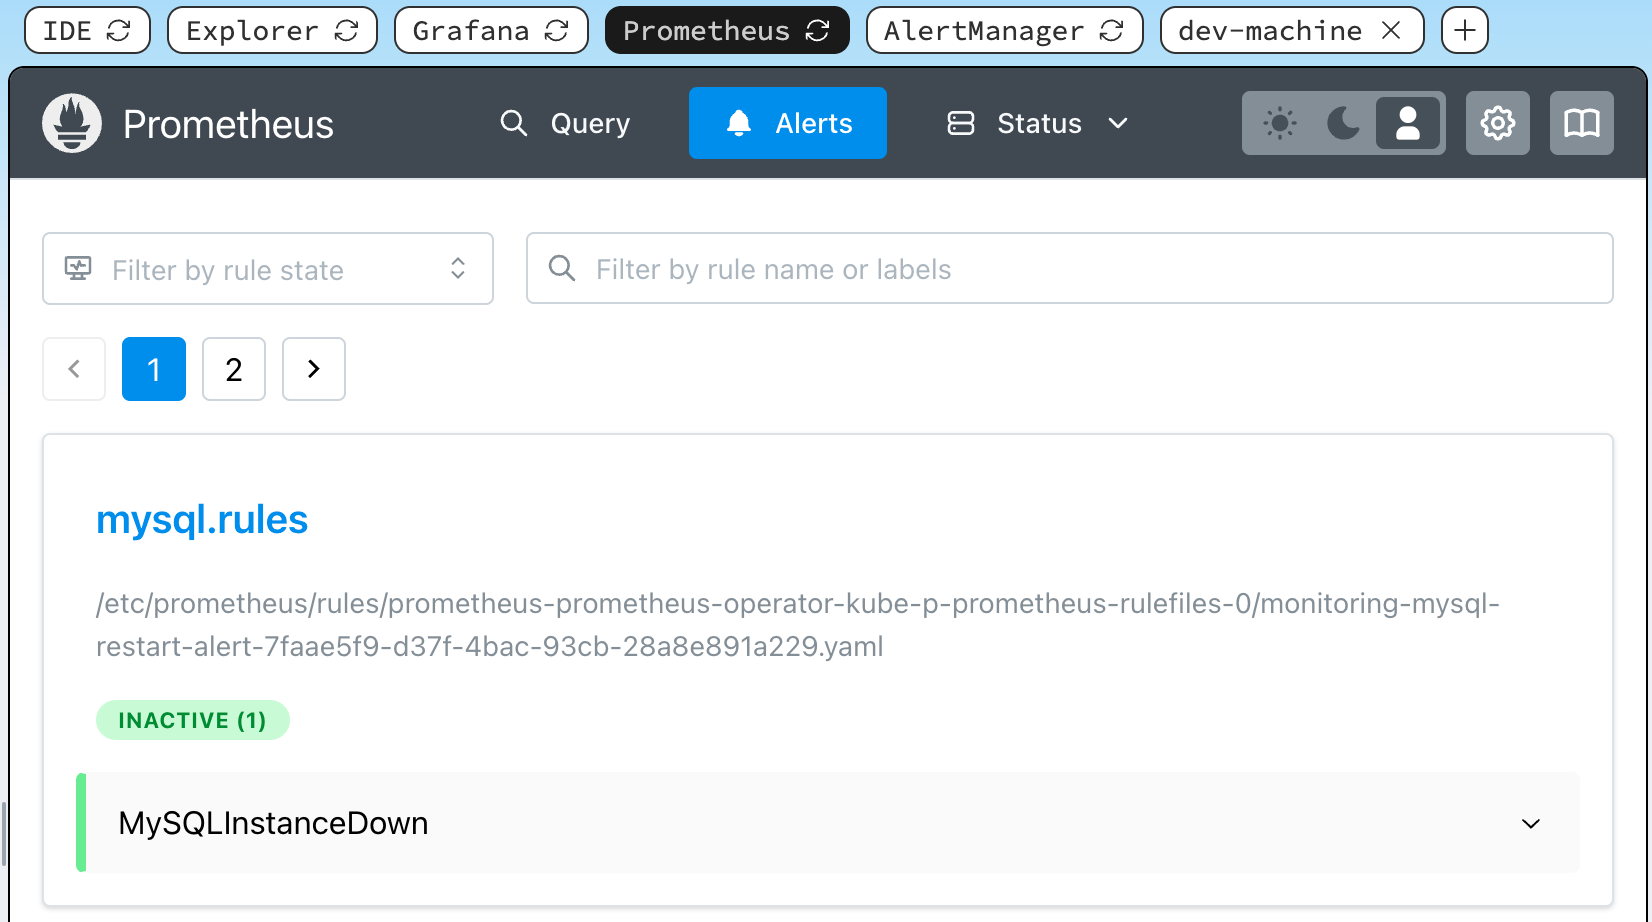
In the Iximiuz Lab interface, Switch to the Prometheus tab. After applying the alert configuration, refresh your Prometheus UI. You should see the new MySQL downtime alert listed in the alert panel.
⏳ This may take a minute. If you don't see it, please wait a moment and refresh the tab.
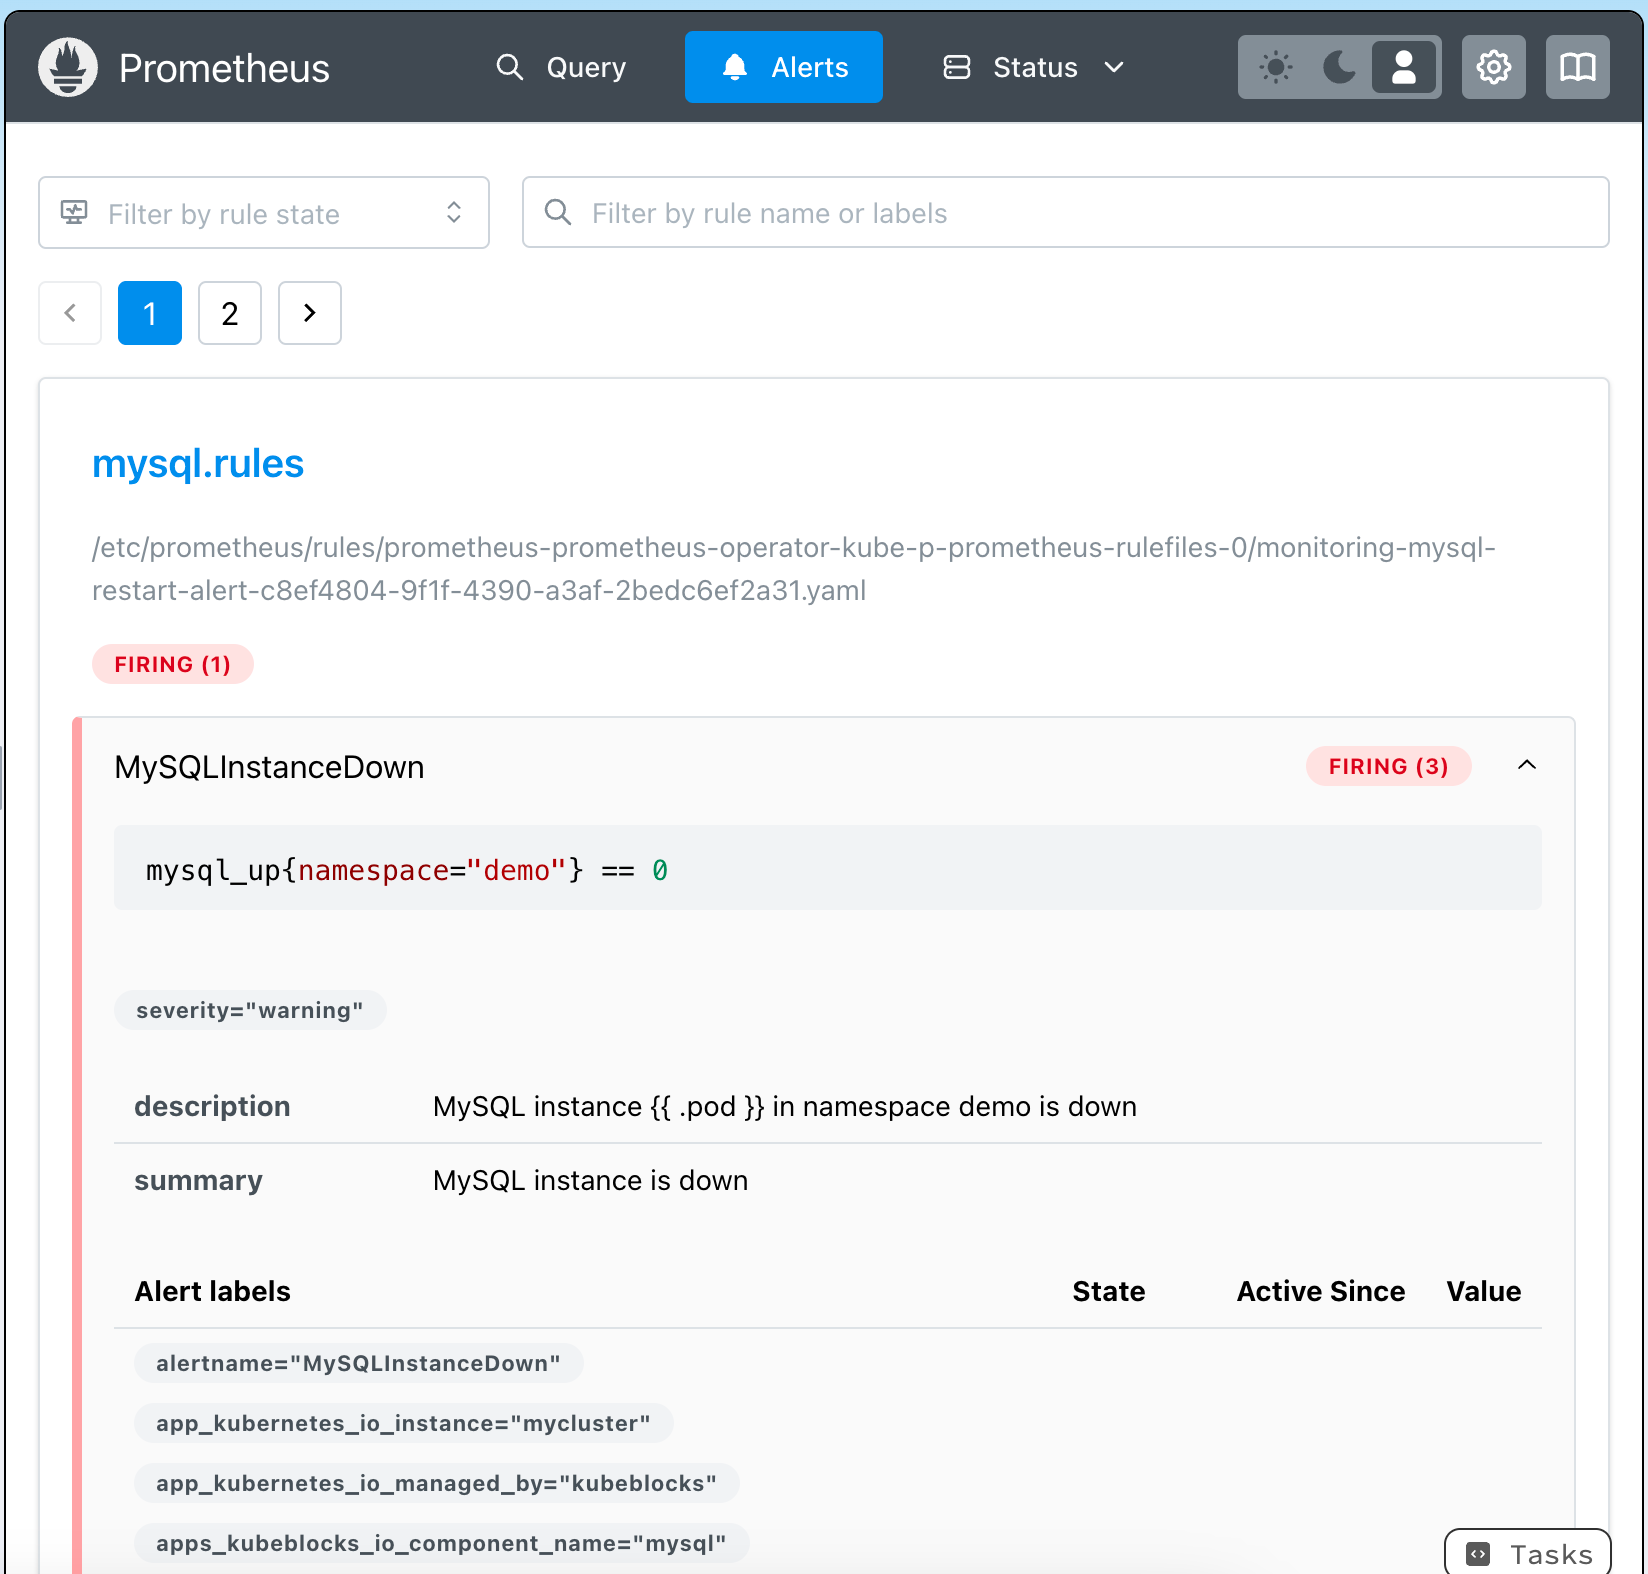
To simulate a failure and verify that the alert is correctly triggered, delete the MySQL pods:
kubectl delete pods mycluster-mysql-0 -n demo
After the pods are deleted, return to the Prometheus alert panel, refresh the tab to see the triggered alert.
Summary
In this tutorial, we demonstrated how to enable and leverage observability features in KubeBlocks. We showed you how to deploy Prometheus and Grafana to monitor metrics, set up a PodMonitor to scrape data from your MySQL cluster, and configure alerts to detect service anomalies.
It is important to note that KubeBlocks leverages open source solutions and integrates tightly with the open source community. This approach ensures that our observability features benefit from continuous improvements and community support.
What’s Next?
- Experiment with KubeBlocks on other database engines such as PostgreSQL, MongoDB, and Redis.
- Try integrating different alert channels and custom dashboards to tailor the monitoring experience to your environment.
- Stay tuned for our upcoming Tutorial 501, where we'll explore advanced auto-tuning and optimization features aligned with Operator Capability Level 5.
About the Author
Writes about
Frequently covers