Kubernetes Resource Limits in Practice: OOMKills, CPU Throttling, QoS, and LimitRanges

CrashLoopBackOff isn't an error by itself. It just means a container keeps dying
and the kubelet keeps restarting it, waiting longer each time (the back-off). The question is, why does it keep dying? In this tutorial the containers asks for more memory than its limit allows, so the kernel's OOM killer kills it.
Meet the Cast
A few players, one line each:
stresscontainer: It burns memory or CPU on demand. In this example will grabs 150M of memory to blow past its limit.
stress --vm 1 --vm-bytes 150M --vm-hang 1
- memory limit: the hard cap Kubernetes puts on the container.
- cgroup: the Linux kernel feature that enforces that cap.
- OOM killer: the Linux kernel watchdog that kills a process when its cgroup runs out of memory.
- kubelet: the node agent that restarts the dead container and reports
OOMKilled.
The rest of the tutorial is just these five interacting. The playground already runs
a broken Deployment called memory-hog. Let's look.
What is `docker.io/polinux/stress` and how do its flags work?
polinux/stress ships the Linux
stress tool, a load generator: tell it how
much memory or CPU to burn and it does exactly that. Perfect for tripping resource
limits on purpose.
The image runs stress directly, so everything after command: ["stress"] is just
stress flags.
Memory load (used by memory-hog):
stress --vm 1 --vm-bytes 150M --vm-hang 1
--vm 1starts 1 memory worker that allocates and writes to memory.--vm-bytes 150Mtells that worker to grab 150 MB of RAM.--vm-hang 1makes it hold the memory for 1 second before freeing and looping, so the memory stays in use.
One worker holding about 150 MB against a 100Mi limit is what triggers the OOMKill.
CPU load (used later by cpu-hog):
stress --cpu 2
--cpu 2starts 2 workers, each running a tight math loop that keeps one core busy. Two workers want two full cores, which a100mlimit throttles hard.
Step 1: Observe the Symptom
List the Pods:
kubectl get pods -l app=memory-hog
You should see something like:
NAME                          READY   STATUS             RESTARTS      AGE
memory-hog-7d4b9c6f4-xxxxx    0/1     CrashLoopBackOff   3 (25s ago)   2m
Notice three things:
READY 0/1: the container isn't serving.RESTARTSkeeps going up.- the status flips between
Running,OOMKilledorError, andCrashLoopBackOff.
Delete the crashing pod and immediately watch its replacement and see it go through the crash/restart cycle. Let it run for a minute or so.
kubectl delete pods -l app=memory-hog &&
kubectl get pods -l app=memory-hog -w
# Press Ctrl+C to stop watching
The back-off doubles after each crash (10s, 20s, 40s, up to 5m). So a crashlooping Pod spends most of its time waiting, not running.
Step 2: Find Out Why It Crashed
kubectl describe shows the Pod's status and recent events:
kubectl describe pod -l app=memory-hog
Look at the Last State section of the container:
    Last State:     Terminated
      Reason:       OOMKilled
      Exit Code:    137
Why exit code 137?
137 = 128 + 9. When a signal kills a process, it exits with 128 + signal number.
Signal 9 is SIGKILL. The OOM killer sends it directly, so the process gets no
chance to clean up or react.
Step 3: Understand the Mechanism
The container is being OOMKilled because it tries to use more memory than its limit allows.
kubectl describe pod -l app=memory-hog
Under the container, look for its resource block:
    Limits:
      memory:  100Mi
    Requests:
      memory:     50Mi
So the container is capped at 100Mi. If it exceeds that, the kernel's OOM killer terminates it.
In the same output, look at what the container runs:
    Command:
      stress
    Args:
      --vm
      1
      --vm-bytes
      150M
      --vm-hang
      1
stress wants 150M, but the container is capped at 100Mi. The chain:
requests: used by the scheduler to place the Pod.limits: enforced at runtime via the cgroup'smemory.max.- Go over
memory.maxand the OOM killer kills a process in the cgroup (SIGKILL, exit 137). - The kubelet marks it
OOMKilledand restarts it. That's the loop.
Step 4: Fix It
The app really needs ~150Mi, so give it room:
kubectl set resources deployment memory-hog \
  --limits=memory=256Mi --requests=memory=128Mi

kubectl rollout status deployment/memory-hog
(Or kubectl edit deployment memory-hog and change it by hand.)
Confirm the new Pod is stable:
kubectl get pods -l app=memory-hog
metrics-server is running, so you can check real usage against the limit:
kubectl top pod -l app=memory-hog
NAME                          CPU(cores)   MEMORY(bytes)
memory-hog-xxxxxxxxx-xxxxx    2m           151Mi
It settles around 150Mi, inside the new 256Mi limit and above the old 100Mi cap
that kept killing it. That's how you size limits: from real numbers.
If kubectl top prints error: metrics not available yet (or a similar
Metrics API not available), the metrics-server just hasn't scraped this Pod yet. It
takes 15 to 30 seconds after a Pod starts. Wait a moment and retry, or poll until the
numbers show up:
until kubectl top pod -l app=memory-hog 2>/dev/null; do
  echo "waiting for metrics..."
  sleep 5
done
Step 5: Quality of Service Classes
requests and limits also give the Pod a Quality of Service (QoS) class.
Kubernetes uses it to decide which Pods to evict first when a node runs low on memory.
Check the class of the Pod you just fixed:
kubectl get pod -l app=memory-hog -o jsonpath='{.items[0].status.qosClass}'
Burstable
Three classes, derived from the resource spec:
| QoS class | Condition | Eviction priority |
|---|---|---|
Guaranteed | Every container sets both requests and limits, and requests == limits for CPU and memory | Evicted last |
Burstable | At least one container has a request or limit, but not the Guaranteed shape | Evicted in the middle |
BestEffort | No requests or limits set at all | Evicted first |
memory-hog is Burstable: it sets memory but not CPU, and request and limit
differ. Set request equal to limit for both CPU and memory to get Guaranteed.
You can't set the QoS class directly, only through requests and limits. Under memory
pressure the kubelet evicts BestEffort first, then over-request Burstable, and
keeps Guaranteed longest.
See QoS class for every Pod in the cluster
kubectl get pods -A \
  -o custom-columns='NS:.metadata.namespace,NAME:.metadata.name,QOS:.status.qosClass'
Step 6: CPU Limits Throttle Instead of Kill
Memory and CPU hit their limits very differently:
- Memory can't be compressed, so over the limit the kernel kills the process (the OOMKill you just saw).
- CPU can be compressed, so over the limit the kernel just throttles it. The container keeps running, only slower.
So a tight CPU limit never causes OOMKilled. It quietly makes the app slow, which
is harder to spot. Deploy a CPU hog with a limit below what it wants:
kubectl apply -f - <<'EOF'
apiVersion: apps/v1
kind: Deployment
metadata:
  name: cpu-hog
  labels:
    app: cpu-hog
spec:
  replicas: 1
  selector:
    matchLabels:
      app: cpu-hog
  template:
    metadata:
      labels:
        app: cpu-hog
    spec:
      containers:
        - name: stress
          image: polinux/stress
          command: ["stress"]
          args: ["--cpu", "1"]
          resources:
            requests:
              cpu: "100m"
            limits:
              cpu: "500m"
EOF

kubectl rollout status deployment/cpu-hog
stress --cpu 1 wants a whole core (1000m), but the limit is 500m (half a core).
The Pod stays Running, no crash:
kubectl get pods -l app=cpu-hog
Check the cgroup CPU stats to see the throttling:
POD=$(kubectl get pod -l app=cpu-hog -o jsonpath='{.items[0].metadata.name}')
kubectl exec "$POD" -- cat /sys/fs/cgroup/cpu.stat
usage_usec 4123456
user_usec 4011234
system_usec 112222
nr_periods 412
nr_throttled 410
throttled_usec 38221456
The fields that matter:
nr_periods: CPU accounting periods passed.nr_throttled: periods the container was throttled.throttled_usec: microseconds spent waiting for CPU.
nr_throttled is ~99% of nr_periods here: the limit is starving the workload.
Same fix as before, raise the limit. But nothing crashed, so you only find it by
looking.
kubectl top shows it pinned at the limit:
kubectl top pod -l app=cpu-hog
NAME                       CPU(cores)   MEMORY(bytes)
cpu-hog-xxxxxxxxx-xxxxx    500m         1Mi
Flat at 500m with rising nr_throttled: that's the throttling signature.
Compare with a Pod that isn't throttled
memory-hog has no CPU limit, so it's never throttled. Read its cpu.stat for
contrast:
POD=$(kubectl get pod -l app=memory-hog -o jsonpath='{.items[0].metadata.name}')
kubectl exec "$POD" -- cat /sys/fs/cgroup/cpu.stat
usage_usec 1820345
user_usec 1700123
system_usec 15982
nr_periods 0
nr_throttled 0
throttled_usec 0
No CPU limit means no quota, so the kernel does no CFS accounting at all: nr_periods
is 0 and nothing is ever throttled.
| Container | CPU limit | Wants | nr_periods | nr_throttled |
|---|---|---|---|---|
cpu-hog | 500m | 1 core | ~412 | ~410, climbing |
memory-hog | none | very low | 0 | 0 |
The cpu-hog container racks up periods and gets throttled in nearly all of them.
The memory-hog container has no limit, so it has no periods to throttle. That
contrast is how you tell a throttled container from a healthy one.
Throttling never shows in kubectl get pods, the Pod looks healthy. Catch it via
cpu.stat, the container_cpu_cfs_throttled_periods_total metric, or latency graphs.
See the throttling metric without Prometheus
cpu.stat is per-container and read from inside the Pod. The kubelet also exposes
the same counters cluster-wide through its built-in cAdvisor, as Prometheus metrics:
container_cpu_cfs_throttled_periods_total: periods the container was throttled.container_cpu_cfs_periods_total: total periods.
Divide the two for the throttle rate. In a real cluster Prometheus scrapes these so you can graph and alert on them. Here, with no Prometheus, you can still read them by hand through the API server's proxy to the node's cAdvisor endpoint:
NODE=$(kubectl get pod -l app=cpu-hog -o jsonpath='{.items[0].spec.nodeName}')
kubectl get --raw "/api/v1/nodes/$NODE/proxy/metrics/cadvisor" \
  | grep container_cpu_cfs_throttled_periods_total | grep cpu-hog
container_cpu_cfs_throttled_periods_total{container="stress",...,pod="cpu-hog-..."} 117
Run it again after a few seconds and the number climbs. That rising counter is the
throttling happening live, the same signal as nr_throttled in cpu.stat.
A Pod with no CPU limit (like memory-hog) has no CFS quota, so cAdvisor emits
no container_cpu_cfs_throttled_* series for it at all. The same grep against
memory-hog returns nothing, because the series simply doesn't exist. That absence
means "no limit, nothing to throttle," not "throttled zero times."
Step 7: What Happens Between Request and Limit?
You've seen the two extremes: at the limit, memory gets you killed and CPU gets you throttled. But what about the band between request and limit, where most containers actually live? The answer is different for the two resources.
First, what each value means:
- request: what the scheduler reserves for you. It's your guaranteed floor.
- limit: the hard ceiling the kernel enforces.
CPU in the band
CPU requests set your share of the CPU (the cgroup's cpu.weight). Usage
between request and limit is completely fine:
- The node is idle: you run freely, all the way up to your limit. Nothing throttles you below it.
- The node is busy: every container is guaranteed at least its request. Above your request you only get spare CPU that nobody else is using, so you may slow down, but you're still not throttled by the kernel. Throttling only happens at the limit.
So in the CPU band you are never killed and never throttled. The worst case under contention is that you simply don't get more than you requested.
Memory in the band
Memory requests are not enforced at runtime, only used for scheduling. Usage
between request and limit:
- The node has memory to spare: you run fine, right up to your limit.
- The node is under memory pressure: the kubelet starts evicting Pods to reclaim memory. Pods using more than their request go first (
BestEffort, then over-requestBurstable). Eviction is graceful: the Pod is deleted and rescheduled elsewhere, notSIGKILLed in place.
Crossing your own limit always gets you OOMKilled by the kernel. But there's a
second way to be killed below your limit: if the node fills up faster than the
kubelet can evict, the kernel's node-level OOM killer fires to save the node
and SIGKILLs a process right away. It picks the victim by oom_score, derived from
QoS and how far over its request a container is:
- A container above its request is a prime target.
- A container below its request is protected (negative
oom_score_adj).
So below your limit but above your request, under sudden pressure you can be either evicted (graceful) or OOMKilled by the node (abrupt). Staying under your request is what truly keeps you safe.
The whole picture
| Where you are | CPU | Memory |
|---|---|---|
| Below request | Safe. Guaranteed share. | Safe. Guaranteed by scheduling. |
| Between request and limit | Not throttled. May lose spare CPU under contention. | May be evicted, or OOMKilled by the node under sudden pressure (above-request first). |
| At / above limit | Throttled (capped at the limit). | OOMKilled (SIGKILL, exit 137). |
The one-line version: CPU is compressible, so the worst that happens is you slow down; memory is not, so crossing the limit kills you, and crossing your request makes you an eviction target.
A newer twist — pod-level resources
Everything above is per container. Recent Kubernetes also lets you set
requests and limits at the Pod level (a spec.resources block next to
containers). Keep two questions separate:
- Enforcement (the OOM kill): a container is OOMKilled at its own limit, if it has one. A higher pod-level limit doesn't save it.
- QoS class: when pod-level resources are set, Kubernetes uses those to decide the Pod's QoS class.
Step 8: Enforce Defaults with LimitRange
A LimitRange fills in default requests and limits for containers that skip them,
and enforces min/max bounds. Apply one to the default namespace:
kubectl apply -f - <<'EOF'
apiVersion: v1
kind: LimitRange
metadata:
  name: default-resources
spec:
  limits:
    - type: Container
      default:            # applied as the container's LIMIT if unset
        cpu: "200m"
        memory: "128Mi"
      defaultRequest:     # applied as the container's REQUEST if unset
        cpu: "100m"
        memory: "64Mi"
      max:                # a container may not request/limit more than this
        cpu: "1"
        memory: "512Mi"
EOF
A LimitRange only affects Pods created after it, and it hits every new container in
the namespace. Existing Pods like memory-hog are untouched until recreated.
Now deploy a Pod that sets no resources at all:
kubectl apply -f - <<'EOF'
apiVersion: v1
kind: Pod
metadata:
  name: no-resources
spec:
  containers:
  - name: nginx
    image: nginx
EOF
The manifest sets no resources, but the LimitRange fills them in. Use
kubectl describe to see what the Pod actually got, the same way you inspected the
crashing Pod earlier:
kubectl describe pod no-resources
Look at the container's Limits and Requests:
    Limits:
      cpu:     200m
      memory:  128Mi
    Requests:
      cpu:        100m
      memory:     64Mi
It asked for nothing, yet came up Burstable with the defaults filled in, not
BestEffort. Confirm:
kubectl get pod no-resources -o jsonpath='{.status.qosClass}'
max is enforced too: a Pod asking for memory: 1Gi here is rejected, over the
512Mi cap.
LimitRange vs ResourceQuota
They work together:
LimitRangeworks per container or Pod. It sets defaults and minimum/maximum bounds for each object.ResourceQuotaworks per namespace. It caps the total requests and limits across the whole namespace. A ResourceQuota often forces every Pod to declare resources, which is exactly why you pair it with a LimitRange that supplies the defaults.
Step 9: Takeaways
CrashLoopBackOffis a symptom. ChecklastState.terminated.reasonand events.OOMKilled+ exit137: the OOM killer enforced the memory limit (memory.max).requestsplace the Pod;limitsare enforced at runtime.- Over the memory limit, you're killed. Over the CPU limit, you're throttled (check
cpu.stat), never killed. - Between request and limit: CPU is never throttled (just loses spare cycles under contention); memory can be evicted or, under sudden node pressure, OOMKilled by the node even below your limit. Staying under your request is what keeps you safe.
- QoS class (
Guaranteed/Burstable/BestEffort) comes from requests and limits and sets eviction order. - Use a
LimitRangeso no Pod lands inBestEffortby accident. - Size limits from real usage and leave room for spikes.
- If memory grows without bound, a bigger limit just delays the crash. Fix the leak.
Practice
Now put it into practice. These two challenges drop you into a broken cluster and ask you to apply exactly what you just learned:
About the Author
More tutorials you might like
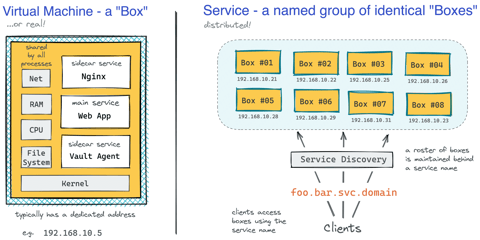
How Kubernetes Reinvented Virtual Machines - In a Good Sense
How Virtual Machines were used to deploy services. What old problems containers solve and what new problems create. How Kubernetes used containers to recreate Virtual Machines in a better way?

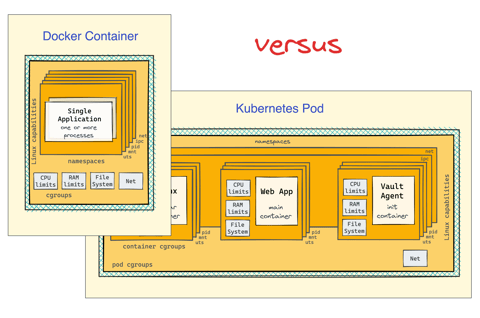
Docker Containers vs. Kubernetes Pods - Taking a Deeper Look
Can a Kubernetes Pod be created with plain Docker commands? Learn the difference between Containers and Pods by exploring how they are implemented under the hood.
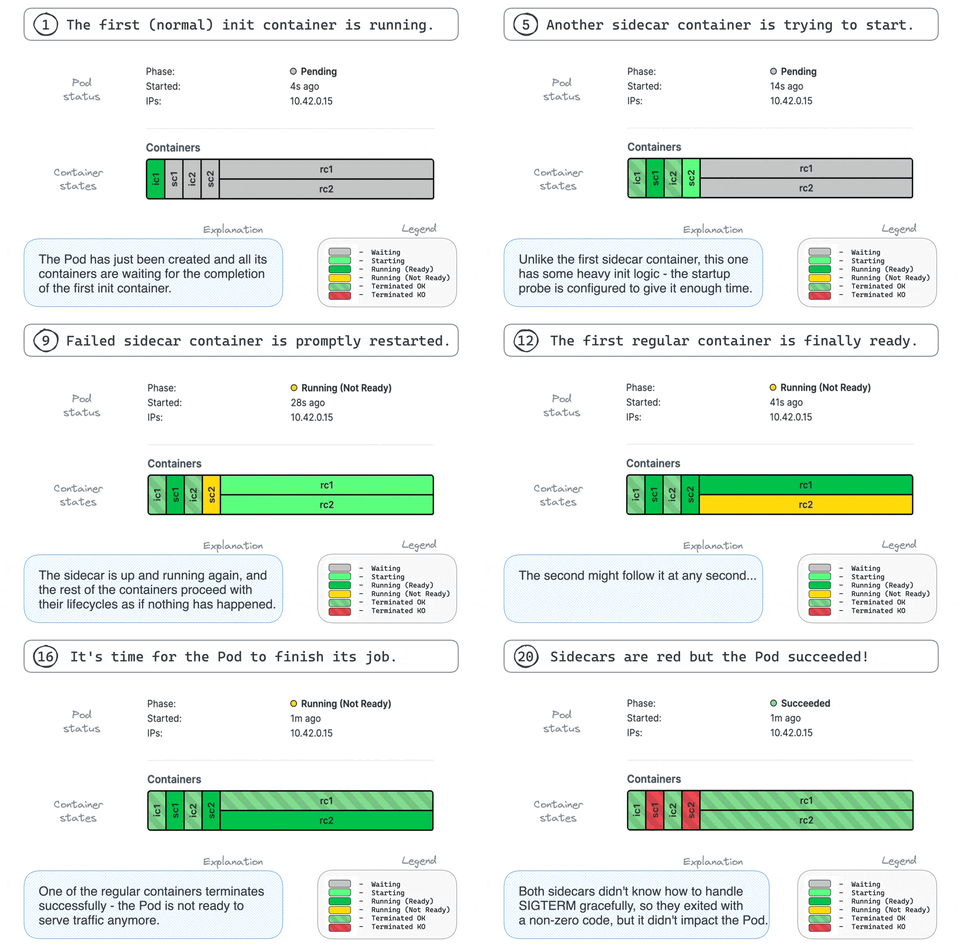
Making Sense Out of Native Sidecar Containers in Kubernetes
Understand the "native" sidecar containers, learn their difference from regular and init containers and discover their advantages in this focused and highly practical tutorial.
Getting Started with VictoriaMetrics on Kubernetes
Deploy VictoriaMetrics on Kubernetes using the VM Operator, configure metrics scraping with CRDs, and query cluster metrics.

Learn by doing, not just by reading or watching
Sign up for a free account to start a VM playground right on this page, track your progress, and get notified about new learning materials.