Different Ways To Deliver Kernel Events from eBPF to User Space

For most eBPF applications to provide actionable value, kernel events must be delivered to user space.
These events may augment user-space observability signals, or represent security-related actions—such as a firewall rule being hit or a binary execution being blocked—that must be processed and logged in user space.
Regardless of the use case, this transfer of data relies on a common mechanism: a buffer that is shared between kernel space and user space application.
There are three-ish primary buffer types/mechanisms for this:
- Perf buffer (introduced in v4.3), allows kernel programs to push kernel events into a per-CPU buffer that user space can poll and read.
- Ring buffer (introduced in v5.8), allows kernel programs to push kernel events into a single circular buffer that is shared among all the CPUs.
- and ... (described at the end of this lab)
In this lab, you'll learn about these different data-exchange mechanisms, their trade-offs, how to further tune their performance and how production eBPF projects handle high-throughput event delivery and avoid losing any potentially critical information.
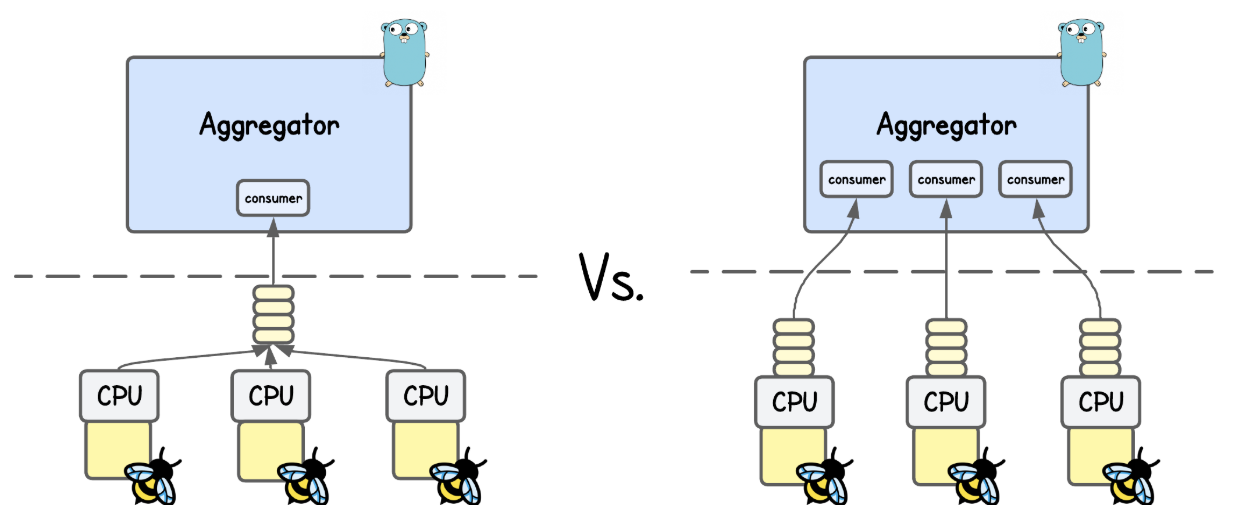
eBPF Ring Buffer vs Perf Buffer
The perf buffer is a mechanism in eBPF that consists of per-CPU circular buffers, whereas the ring buffer is a circular buffer shared among all the CPUs.
💡 You’re actually not limited to a single ring/perf buffer—multiple can be created, which you’ll sometimes see in projects that handle large event volumes.
Just take Inspektor Gadget as an example - where every (eBPF) Gadget has it's own ring/perf buffer.
Compared to ring buffer, design of the perf buffer has three major drawbacks that often unnecessarily complicate kernel event delivery and hurt performance.
Unnecessary Processing and Load
Whenever you want to send a kernel event data to user space through a perf buffer you must first prepare a data sample (often in a local variable or eBPF map), and then copy it into the perf buffer.
This is all fine, unless the buffer is not full. But if it is, the copy is wasted, and all the processing work of our eBPF program was for nothing.
SEC("tracepoint/syscalls/sys_enter_execve")
int handle_execve_tp(struct trace_event_raw_sys_enter *ctx) {
    struct event e = {};

    u64 pid_tgid = bpf_get_current_pid_tgid();
    e.pid  = pid_tgid >> 32;
    e.tgid = (u32)pid_tgid;
    const char *filename_ptr = (const char *)BPF_CORE_READ(ctx, args[0]);
    bpf_core_read_user_str(e.filename, sizeof(e.filename), filename_ptr);

    // Emit to perf buffer (one record on the current CPU) and
    // hope it doesn't get dropped due to a full buffer
    bpf_perf_event_output(ctx, &events, BPF_F_CURRENT_CPU, &e, sizeof(e));
    return 0;
}
More information about `bpf_perf_event_output` helper
bpf_perf_event_output helper takes 5 arguments. In the example above, these are:
- Program context (
ctx) – passed directly from the hook (e.g.,struct trace_event_raw_sys_enter *ctx). - Perf Event Array map – a
BPF_MAP_TYPE_PERF_EVENT_ARRAYthat stores the events. - Flags – either
BPF_F_CURRENT_CPU(write to the current CPU’s buffer) or a specific integer index (masked byBPF_F_INDEX_MASK) to target another CPU. - Event data – a pointer to your event structure (e.g.,
&e) - Event Size - size of the sumbitted event sample (e.g.
sizeof(e))
For details on other perf buffer helper functions, refer to the BPF_MAP_TYPE_PERF_EVENT_ARRAY documention.
To address this shortcoming, ring buffer introduces a reserve/submit API, which instead of first preparing a sample and then copying it into the buffer (only to discover later that there is no space left), a program can reserve space in advance.
SEC("tracepoint/syscalls/sys_enter_execve")
int handle_execve_tp(struct trace_event_raw_sys_enter *ctx) {
    // Reserve space on the ring buffer
    struct event *e = bpf_ringbuf_reserve(&events, sizeof(*e), 0);
    if (!e) {
        // If the buffer is full, just return here
        return 0;
    }

    u64 pid_tgid = bpf_get_current_pid_tgid();
    e->pid  = pid_tgid >> 32;
    e->tgid = (u32)pid_tgid;
    const char *filename_ptr = (const char *)BPF_CORE_READ(ctx, args[0]);
    bpf_core_read_user_str(e->filename, sizeof(e->filename), filename_ptr);

    // Submit to ring buffer
    bpf_ringbuf_submit(e, 0);
    return 0;
}
More information about `bpf_ringbuf_submit` helper
bpf_ringbuf_submit helper takes 2 arguments. In the example above, these are:
- Data pointer – a pointer returned by
bpf_ringbuf_reservethat references the reserved space in the ring buffer. - Flags – declares how the notification of new data availability should be handled. Will be discussed below.
A successful call to bpf_ringbuf_reserve() guarantees that the subsequent bpf_ringbuf_submit() will not fail.
For details on other ring buffer helper functions, refer to the BPF_MAP_TYPE_RINGBUF documention
What if space is reserved but the program flow does NOT lead to `bpf_ringbuf_submit`?
Sometimes your eBPF program reserves space in the ring buffer, but later leads to the code branch that doesn't send the event to user space (e.g., tracing syscalls of a specific PID).
In that case, the bpf_ringbuf_discard helper should release the reserved space:
SEC("tracepoint/syscalls/sys_enter_execve")
int handle_execve_tp(struct trace_event_raw_sys_enter *ctx) {
  // Reserve space on the ring buffer
  struct event *e = bpf_ringbuf_reserve(&events, sizeof(*e), 0);
  if (!e) {
    // If the buffer is full, just drop the event
    return 0;
  }

  u64 pid_tgid = bpf_get_current_pid_tgid();
  e->pid  = pid_tgid >> 32;
  // Example condition: only report execve calls from PID 1234
  if (e->pid != 1234) {
    // Free reserved space without sending an event
    bpf_ringbuf_discard(e, 0);
    return 0;
  }

  const char *filename_ptr = (const char *)BPF_CORE_READ(ctx, args[0]);
  bpf_core_read_user_str(e->filename, sizeof(e->filename), filename_ptr);

  // Submit to ring buffer
  bpf_ringbuf_submit(e, 0);
  return 0;
}
💡 While I use terms like 'sending' or 'pushing' data to user space, the eBPF kernel-space program actually just submits the data samples to a perf/ring buffer eBPF map from where the user-space program then pulls them.
Event Ordering
Another issue with perf buffer is event ordering.
Consider a workload that tracks correlated events, such as process lifecycles (fork → exec → exit) or TCP connection lifetimes (SYN → SYN-ACK → ACK). In such cases, ordering is super important.
With a perf buffer—where each CPU has its own dedicated buffer—there is no guarantee that events will reach user space in the order they occurred. If events happen in rapid succession, they may arrive out of sequence because each buffer is filled at a different rate depending on which CPU the event occurred on.
A simple workaround for perf buffers is to just include a timestamp in each event sent to user space. Events can then be re-ordered in user space based on this timestamp.
SEC("tracepoint/syscalls/sys_enter_execve")
int handle_execve_tp(struct trace_event_raw_sys_enter *ctx) {
    struct event e = {};

    u64 pid_tgid = bpf_get_current_pid_tgid();
    e.pid  = pid_tgid >> 32;
    e.tgid = (u32)pid_tgid;
    e.ts   = bpf_ktime_get_ns();
    const char *filename_ptr = (const char *)BPF_CORE_READ(ctx, args[0]);
    bpf_core_read_user_str(e.filename, sizeof(e.filename), filename_ptr);

    // Emit to perf buffer (one record on the current CPU)
    bpf_perf_event_output(ctx, &events, BPF_F_CURRENT_CPU, &e, sizeof(e));
    return 0;
}
💡 bpf_ktime_get_ns() is an eBPF helper function that returns the current kernel time in nanoseconds since boot (monotonic clock).
By contrast, in case of a ring buffer shared across all CPUs, all events go into the same (FIFO circular) queue, preserving order without any additional code complexity.
Data Availability Signaling
The main overhead in forwarding kernel events to user space actually comes from signaling data availability when a sample is added to the perf/ring buffer.
Whenever this happens:
- Kernel signals availability → The ring buffer marks data as "ready to be consumed" (and triggers a wakeup)
- Scheduler context switch → The CPU switches execution from current task to the eBPF user space consumer (incurring a performance "tax")
- User-space ingest → The application reads events from the buffer
- Return to "sleep" → The process blocks again, waiting for new events/wakeups
And at high event rates, the resulting wakeups and context switches can dominate CPU usage—affecting the performance of both perf and ring buffer.
Perf buffer offers an option to reduce this overhead by enabling sampled notifications, where only every N-th sample triggers a notification.
reader, err := perf.NewReaderWithOptions(
  objs.Events,
  os.Getpagesize(),
  perf.ReaderOptions{
    // The number of events required in any per CPU buffer before
    // Read will process data. The default is zero - a.k.a immediate reads.
    WakeupEvents: 3,
    // Overwritable: true
  }
)
Open lab/advanced-perf-buffer/main.go file and experiment with this value.
💡 Keep in mind you won’t see the last N-1 samples until the Nth arrives, which may or may not matter in your use case.
What is the `Overwritable` variable?
💡 This setting instructs eBPF kernel programs to overwrite old samples when the perf buffer is full, instead of failing to write and dropping them.
Ring buffer further improves on this concept, where bpf_ringbuf_submit() accept an extra flags argument:
0: Default value, which performs adaptive notification depending on whether the user-space consumer is lagging behind or notBPF_RB_NO_WAKEUP: Don't wake up user space handler (and avoid the context switch)BPF_RB_FORCE_WAKEUP: Force sending an "immediate" wake up notification
Here's an example:
SEC("tracepoint/syscalls/sys_enter_execve")
int handle_execve_tp(struct trace_event_raw_sys_enter *ctx) {
    // Reserve space on the ring buffer
    struct event *e = bpf_ringbuf_reserve(&events, sizeof(*e), 0);
    if (!e) {
        // If the buffer is full, just drop the event
        return 0;
    }

    u64 pid_tgid = bpf_get_current_pid_tgid();
    e->pid  = pid_tgid >> 32;
    e->tgid = (u32)pid_tgid;

    // Copy filename directly into the ring-buffered event
    const char *filename_ptr = (const char *)BPF_CORE_READ(ctx, args[0]);
    bpf_core_read_user_str(e->filename, sizeof(e->filename), filename_ptr);

    // (Optional) debug message visible via /sys/kernel/debug/tracing/trace_pipe
    bpf_printk("execve: pid=%d tgid=%d file=%s\n", e->pid, e->tgid, e->filename);

    // Submit to ring buffer and force immediate wakeup in user space to consume it
    bpf_ringbuf_submit(e, BPF_RB_FORCE_WAKEUP);
    return 0;
}
Taking all of this into account, eBPF perf buffer with their per-CPU buffer design could theoretically support higher throughput in some very specific setups (e.g. well-tuned per-CPU consumers and wake up interupts), but that usually requires a lot of work.
So for nearly all practical use cases, the Ring Buffer outperforms the Perf Buffer.
Run these code examples
To execute the code provided in this lab, navigate to the corresponding directory and run the following sequence:
# Generate the necessary eBPF bytecode and Golang wrapper
go generate

# Compile the Go application
go build

# Run the eBPF application
sudo ./<binary_name>
The code captures and forwards execve kernel events into userspace and prints them to the terminal, so just open another terminal tab and execute some commands like ls, echo hello etc.
Optimizing the eBPF Ring Buffer Setup
While kernel version 5.8 (ring buffer release) is still a relatively “new” release for many environments, most if not all tools will eventually migrate to ring buffers.
But regardless of which buffering mechanism is used, the biggest risk like buffer overflow (losing kernel events) and system performance degradation (lower network throughput or higher syscall latency due to high CPU consumption of eBPF applicatons) still remain, which ultimately comes down to how efficiently the exchange of data is implemented.
We learned before that in an ideal situation, events should be consumed from the buffer as fast as possible so the blocking .Read() is not stalling data consumption, while also taking into an account the cost of constant data availability notifications and context switches.
With that in mind, the first additional optimization one can do is, offload the processing of those events to "worker threads" (actually goroutines), ensuring that consumption in user-space itself remains fast and non-blocking:
...
// Instantiate Queue for forwarding messages
recordsQueue := make(chan *ringbuf.Record, 8192)

// Start processing records from records queue.
var wg sync.WaitGroup
wg.Add(1)
go func() {
  defer wg.Done()
  for {
    select {
      // Process data from the queue
      case record := <-recordsQueue:
        // Here we could further pass the data to other goroutines
        var ev event
        if err := binary.Read(bytes.NewReader(record.RawSample), binary.LittleEndian, &ev); err != nil {
          fmt.Printf("failed to decode record: %v\n", err)
          continue
        }
        fmt.Printf("execve pid=%d tgid=%d file=%q\n", ev.PID, ev.TGID, cString(ev.Filename[:]))
      case <-ctx.Done():
        log.Printf("Listening for events completed.")
        log.Printf("Unprocessed events in recordsQueue: %d", len(recordsQueue))
        // graceful shutdown; drain whatever’s already in the channel if you want
        return
    }
  }
}()

errCh := make(chan error, 1)
go func() {
  defer close(errCh)
  for {
    // Read samples from the buffer
    rec, err := rb.Read()
    if err != nil {
      errCh <- err
      return
    } else {
      if len(rec.RawSample) > 0 {
        // Whenever a sample is read from the buffer, offload processing to a goroutine and continue
        select {
          case recordsQueue <- &rec:
          default:
            log.Printf("recordsQueue channel is full, drop the event")
        }
      }
    }
  }
}()
...
Then as mentioned above, we want to tune user-space wakeups to avoid excessive CPU context switching and performance degradation.
In practice, default flag (0 == adaptive notification) provided to bpf_ringbuf_submit() is often sufficient for general use. However, when every microsecond and resource matters, manually controlling data notifications based on custom criteria—such as the volume of enqueued data—can significantly boost performance by reducing unnecessary wakeups.
// Hardcoded, but could also be adjustable from user space
const long wakeup_data_size = 2048;

static __always_inline long get_flags() {
  long sz;

  if (!wakeup_data_size) {
    return 0;
  }

  sz = bpf_ringbuf_query(&events, BPF_RB_AVAIL_DATA);
  return sz >= wakeup_data_size ? BPF_RB_FORCE_WAKEUP : BPF_RB_NO_WAKEUP;
}

SEC("tracepoint/syscalls/sys_enter_execve")
int handle_execve_tp(struct trace_event_raw_sys_enter *ctx) {
  //...

  // Submit to ring buffer but notify only if more full then wakeup_data_size
  long flags = get_flags();
  bpf_ringbuf_submit(e, flags);
  return 0;
}
But whichever "custom approach" you utilize to control data availability signaling it always comes down to striking the right balance between batching the events in the ring buffer and not overflowing it, how quick your stack needs to respond on kernel event data and how much system overhead is acceptable.
To help you with that, there are different metrics related to ring buffer "performance" that you can observe.
You can query the ring buffer in eBPF kernel program to determine the volume of unread data currently sitting in the queue which is useful for identifying if your user-space consumer is falling behind the kernel's production rate.
__u64 available = bpf_ringbuf_query(&events, BPF_RB_AVAIL_DATA);
Or by tracking the number of dropped events if the buffer space is exhausted which can happen during bursts:
// Reserve space on the ring buffer
struct event *e = bpf_ringbuf_reserve(&events, sizeof(*e), 0);
if (!e) {
    // If the buffer is full, just drop the event
    drop++;
    return 0;
}
While with that you can tune and significantly improve your application’s ability to handle higher volumes of kernel events, it’s still tricky to achieve that for highly variable workloads (e.g., long idle periods interrupted by sudden floods of events like a DoS attack or burst of API calls).
If you allocate large buffers you waste memory during idle times; or allocate small ones and you risk frequent drops during bursts. Or maybe also the maximum buffer size of the ring buffer is not sufficient for your application?
So what if I told you neither ring nor perf buffer is the right choice for very high event rates (e.g., 600k+ per second)?
Modern Approach
Taking inspirations from the creators of the Jibril (runtime monitoring and threat detection engine based on eBPF), they approach the problem of high volume data and real-time threat detection a bit differently.
While it's hard to go into the details, as their code is not open-source, but from the discussions that I've had with their engineers - the problem with both ring and perf buffer that prevents modern tools to perform real-time detection is the limitation of the FIFO queue concept.
Both perf buffers and ring buffers can hit their capacity limits as well as every event needs to pass to the end of the queue to be picked up and processed by user space, which inevitably adds latency and makes true real-time detections harder.
In other words, when kernel events are sent to user space, if event A is in the queue before event D, then A, B, and C must be processed before D. With a large number of events in the queue, event D can sit idle for quite some time before being picked up.
So instead of streaming all kernel events into user space, Jibril caches event data directly in eBPF maps inside the kernel, which user space can then query on demand.
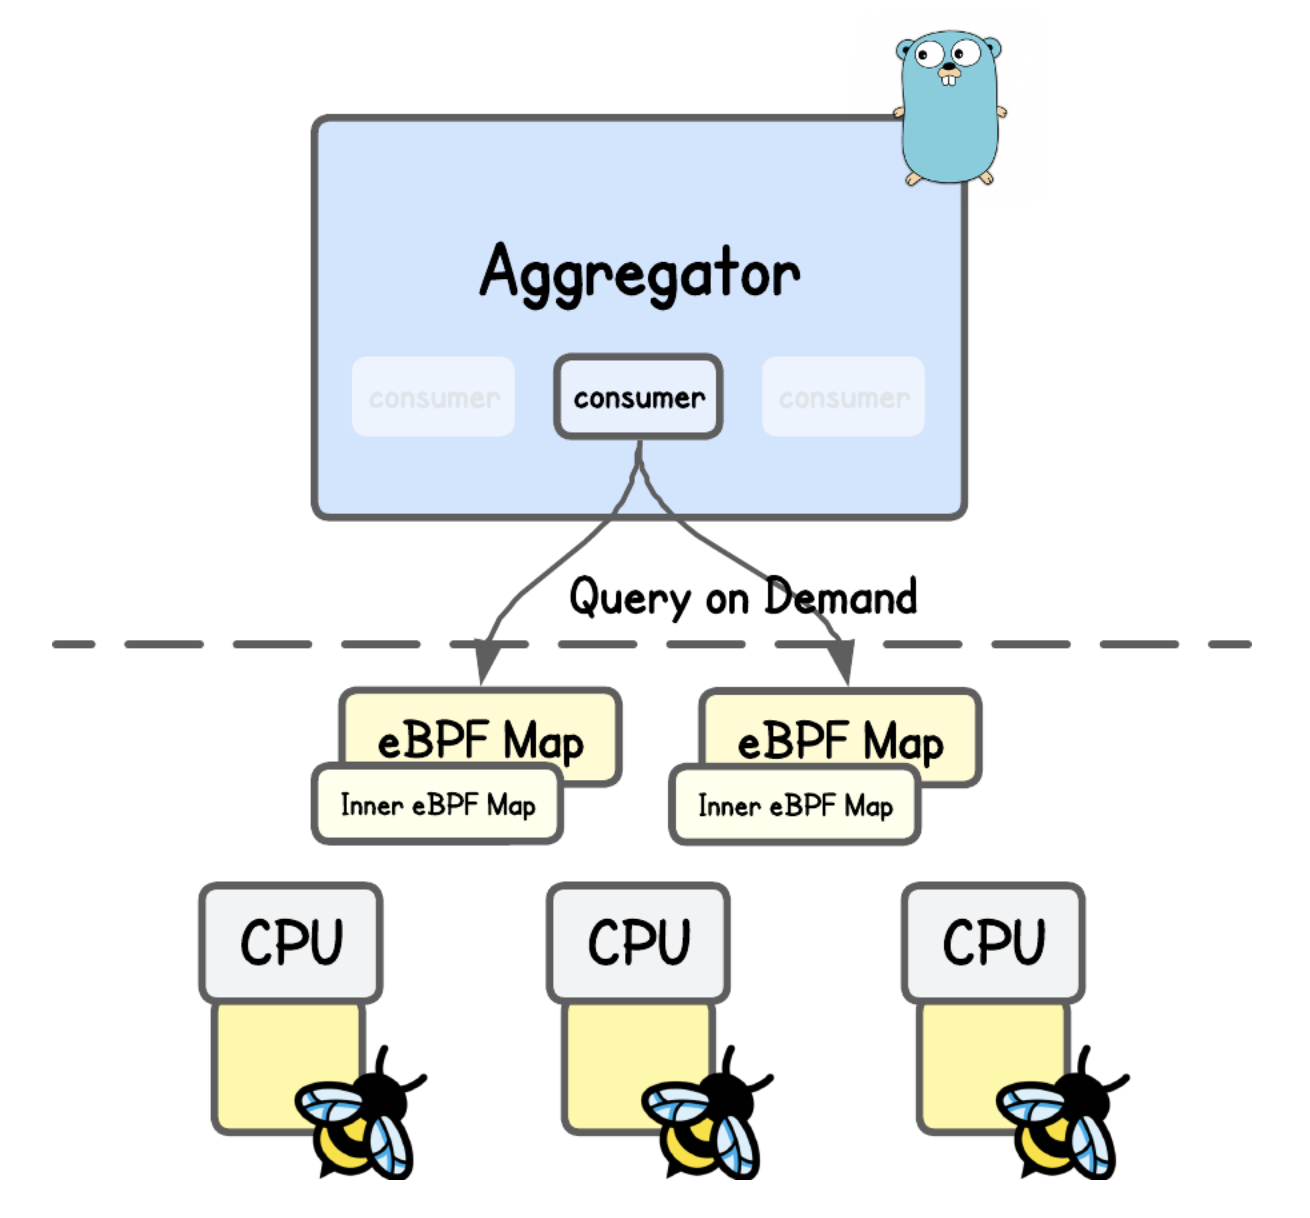
This design alleviates pressure on FIFO-based ring/perf buffers by avoiding constant context switches and data copying. Instead of waiting for events to flow through a queue to user space, the system retrieves specific data on demand (and reacts).
Congrats, you've came to the end of this tutorial. 🥳
About the Author
Writes about
Frequently covers