Why Does My eBPF Program Work on One Kernel but Fail on Another?

In a perfect world, everyone’s systems would be fully updated, patched regularly, and running the latest kernel.
But let’s be real—that’s rarely the case.
Some environments still rely on legacy versions of Ubuntu or Fedora, while others don't have their kernels compiled with BTF (BPF Type Format).
And if you’re maintaining any open-source tools, things get even messier. You have zero control over what kind of system your users will run your program on.
All of this makes it tricky to ensure that your eBPF programs can run reliably across different distributions, ultimately affecting whether your eBPF tool gets adopted or not.
So how do we make eBPF programs truly portable?
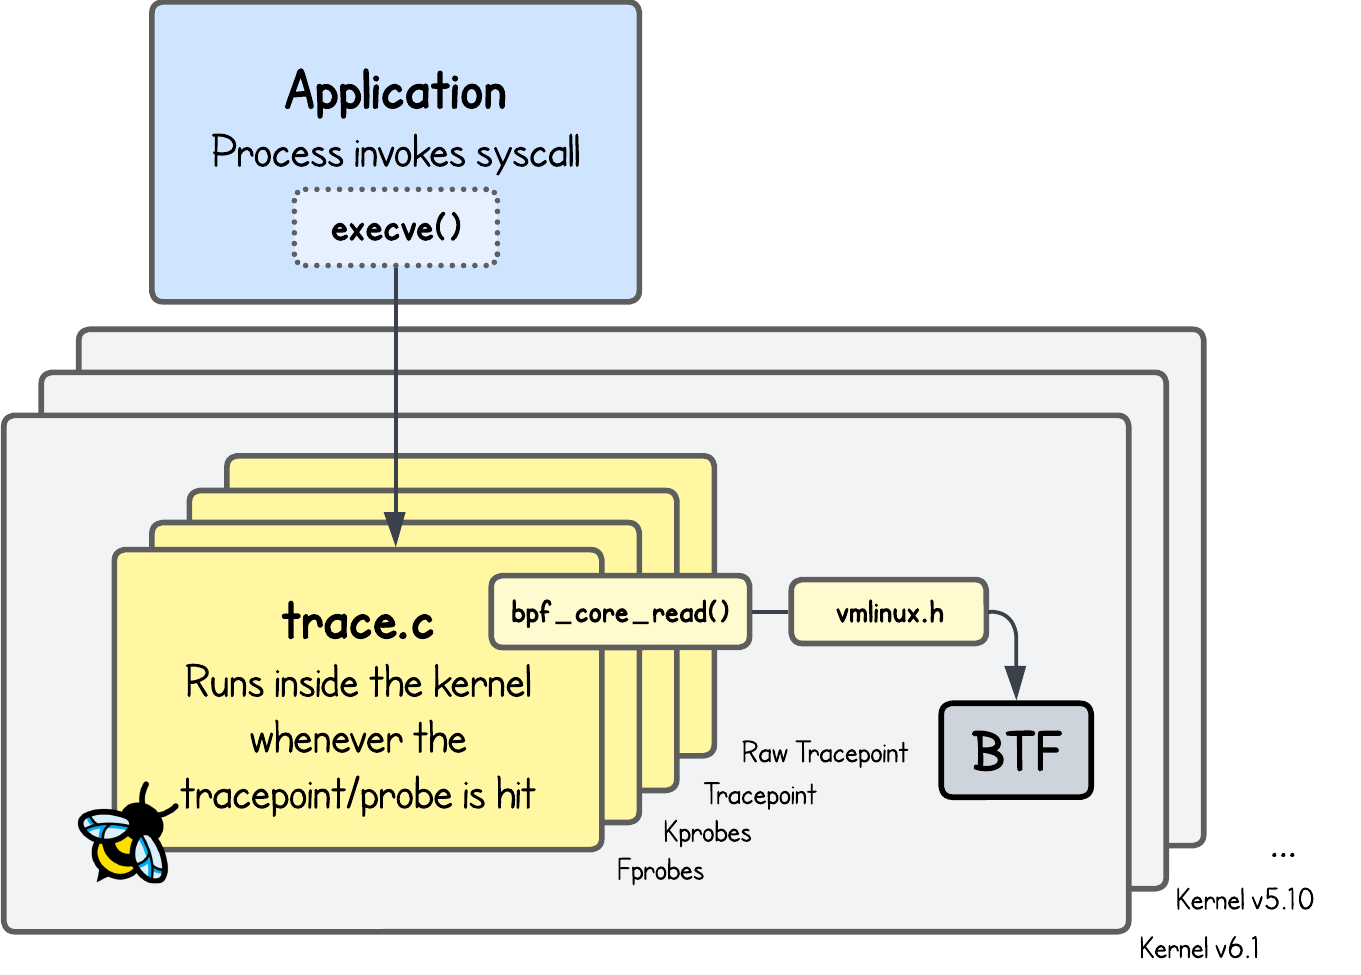
To better understand the problem, let’s look at a hypothetical example.
Suppose you compile an eBPF program on kernel version 5.3, but it fails to run on 5.4.
Why would that happen?
Because each kernel version ships with its own kernel headers, which define structs and memory layouts. Even small changes in these definitions can break eBPF programs.
Take structs, for example. Let’s say we have one representing a TCP header in kernel 5.3:
struct tcphdr {       /* Offset Size */
    __be16  source;   /* 0      2    */
    __be16  dest;     /* 2      2    */
    __be32  seq;      /* 4      4    */
    __be32  ack_seq;  /* 8      4    */
    __be16  window;   /* 12     2    */
    __sum16 check;    /* 14     2    */
    __be16  urg_ptr;  /* 16     2    */
};
In the next kernel release, 5.4, kernel developers might decide to place these fields into a new struct or rename the seq field to seque or perhaps move these fields up or down (changing their offset):
struct tcphdr {       /* Offset Size */
    __be16  source;   /* 0      2    */
    __be16  dest;     /* 2      2    */
    __be32  ack_seq;  /* 4      4    */
    __be32  seque;    /* 8      4    */
    __be16  window;   /* 12     2    */
    __sum16 check;    /* 14     2    */
    __be16  urg_ptr;  /* 16     2    */
};
In this hypothetical struct, seq was renamed to seque and swapped with ack_seq, causing their offsets to change.
See the problem?
Your code may rely on specific fields or offsets, which are likely to change across kernel versions.
Example of some real-world kernel struct changes
In this commit, the syscall tracepoint context was modified so that the field holding the syscall number was renamed from nr to __syscall_nr.
And as explained here, the introduction of the FRED (Flexible Return and Event Delivery) mechanism on x86 (kernel v6.9) altered the way pt_regs are stored on the stack, adding padding and moving register offsets.
Since the eBPF program itself has no control over these changes, there’s an inherent need for a solution to ensure the portability of eBPF programs.
BPF CO-RE (Compile Once – Run Everywhere)
If you search online, you'll find plenty of resources recommending the use of BPF CO-RE (Compile Once – Run Everywhere) to address this issue.
In other words, rather than writing the programs like this:
struct trace_sys_enter_execve {
    short common_type;
    char common_flags;
    char common_preempt_count;
    int common_pid;

    s32 syscall_nr;        // offset=8,  size=4
    u32 pad;               // offset=12, size=4 (pad)
    const u8 *filename;    // offset=16, size=8
    const u8 *const *argv; // offset=24, size=8
    const u8 *const *envp; // offset=32, size=8
};

SEC("tracepoint/syscalls/sys_enter_execve")
int handle_execve_tp_non_core(struct trace_sys_enter_execve *ctx) {
    const char *filename_ptr = (const char *)(ctx->filename);

    u8 buf[ARGSIZE];
    bpf_probe_read_user_str(buf, sizeof(buf), filename_ptr);

    bpf_printk("Tracepoint triggered for execve syscall with parameter filename: %s\n", buf);
    return 0;
}
You should replace the lines of code that access the kernel struct context with the BPF_CORE_* family of helper functions, which enables access to struct fields in a way that adapts across kernel versions:
SEC("tracepoint/syscalls/sys_enter_execve")
int handle_execve_tp(struct trace_event_raw_sys_enter *ctx) {
    char *filename_ptr = (char *)BPF_CORE_READ(ctx, args[0]);

    u8 filename[ARGSIZE];
    bpf_core_read_user_str(&filename, sizeof(filename), filename_ptr);

    bpf_printk("Tracepoint (CO-RE) triggered for execve syscall with parameter filename: %s\n", filename);
    return 0;
}
💡 If you look carefully, also the input context was changed. Instead of using the hardcoded struct trace_sys_enter_execve, we use struct trace_event_raw_sys_enter.
Why is that? Read along.
In short, the BPF_CORE_* family of helpers enables relocatable reads of kernel structs.
So if a certain struct field (like filename in the example) sits at a different offset in another kernel version, these helpers can still locate and read it correctly.
More information about the `BPF_CORE_*` family of helpers
All BPF_CORE_* helpers let your eBPF program read fields from kernel structs in a way that survives kernel changes (renames, field reordering, different offsets) using BTF-based CO-RE relocations:
BPF_CORE_READ(src, field, [nested_field, ...])→ Reads the value of a (possibly nested) field from a kernel struct and on failure returns a zero value, which is not that ideal, since you can’t distinguish “real zero read” from “failed read”.BPF_CORE_READ_INTO(&dst, src, field, [nested_field, ...])→ Reads intodstand returns a zero value on success and a negative value on error.BPF_CORE_READ_USER/BPF_CORE_READ_USER_INTO→ Same as above, but for user-memory pointers.- and others..
You'll also see developers using bpf_core_read() or similar lower-case helpers.
These are low-level functions that copy bytes from a relocatable address into a buffer and return an error code. In contrast, BPF_CORE_READ() is a macro built on top that automatically follows pointer chains and applies CO-RE relocations, making it especially convenient for accessing nested kernel structs.
struct task_struct *task = bpf_get_current_task();

// Using BPF_CORE_READ: follows pointer chain automatically
u32 pid = BPF_CORE_READ(task, real_parent, pid);

// Using bpf_core_read: you must spell out the destination and size
u32 pid2 = 0;
bpf_core_read(&pid2, sizeof(pid2), &task->real_parent->pid);
Under the hood, this is made possible by BPF CO-RE relocation information and BPF Type Format.
Wait, what? CO-RE relocation information? BTF? Read along.
vmlinux.h Header file
If you peek into almost any production eBPF codebase, you’ll notice all of them include (or generate during the build-time) the vmlinux.h header.
There's one also in our labs/lab2 directory for this lab - open it.
This file contains definitions for all kernel structs (like trace_event_raw_sys_enter in the example above), generated based on the currently running kernel.
How does one create a vmlinux.h file?
💡 You can generate this header file using:
sudo bpftool btf dump file /sys/kernel/btf/vmlinux format c > vmlinux.h
But as mentioned above, these files are usually build during build time, e.g. in the Makefile.
Here’s where it gets interesting — this header includes a few special lines at both the top and bottom:
#ifndef BPF_NO_PRESERVE_ACCESS_INDEX
#pragma clang attribute push (__attribute__((preserve_access_index)), apply_to = record)
#endif
...
# Kernel Struct definitions
...
#ifndef BPF_NO_PRESERVE_ACCESS_INDEX
#pragma clang attribute pop
#endif
The line __attribute__((preserve_access_index)) at the top of vmlinux.h, tells the compiler to emit BPF CO-RE (Compile Once – Run Everywhere) relocation information (into the output binary) for every struct field your eBPF program accesses into your eBPF object file.
And the clang attribute push ensures this applies to all struct definitions until the matching clang attribute pop at the bottom of the file.
In other words, when you reference a field (like filename in the examples in labs/lab2/trace.c file) from a kernel struct, the compiler doesn’t just hardcode its offset. Instead, it records metadata—like the field’s name, type, offset, and parent struct.
SEC("tracepoint/syscalls/sys_enter_execve")
int handle_execve_tp(struct trace_event_raw_sys_enter *ctx) {
    char *filename_ptr = (char *)BPF_CORE_READ(ctx, args[0]);

    u8 filename[ARGSIZE];
    bpf_core_read_user_str(&filename, sizeof(filename), filename_ptr);

    bpf_printk("Tracepoint (CO-RE) triggered for execve syscall with parameter filename: %s\n", filename);
    return 0;
}
More information on the metadata record
Compiler records the metadata within bpf_core_relo struct or so-called BPF CO-RE relocation structure, defined as:
struct bpf_core_relo {
    __u32 insn_off;
    __u32 type_id;
    __u32 access_str_off;
    enum bpf_core_relo_kind kind;
};
where the arguments are:
insn_off: Identifies the instruction being relocated, such as one that sets a register to a specific value.type_id: References BTF (BPF Type Format) metadata, which describes the layout of the kernel structure.access_str_off: Specifies how a particular field is accessed relative to the structure.
This metadata is recorded in BPF Type Format (BTF).
BPF Type Format (BTF)
To understand how this metadata looks like, let's build and run the program from labs/lab2 directory, using:
go generate
go build
sudo ./lab2
And then dump the recorded BTF information for the handle_execve_tp tracepoint program using:
sudo bpftool prog # Find the BTF ID (`btf_id`) of the `handle_execve_tp` program
sudo bpftool btf dump id <prog-btf-id>
[1] FUNC 'handle_execve_tp' type_id=14 linkage=global
[2] INT 'int' size=4 bits_offset=0 nr_bits=32 encoding=SIGNED
[3] INT 'unsigned short' size=2 bits_offset=0 nr_bits=16 encoding=(none)
[4] INT 'unsigned char' size=1 bits_offset=0 nr_bits=8 encoding=(none)
[5] STRUCT 'trace_entry' size=8 vlen=4
        'type' type_id=3 bits_offset=0
        'flags' type_id=4 bits_offset=16
        'preempt_count' type_id=4 bits_offset=24
        'pid' type_id=2 bits_offset=32
[6] INT 'long' size=8 bits_offset=0 nr_bits=64 encoding=SIGNED
[7] INT '__ARRAY_SIZE_TYPE__' size=4 bits_offset=0 nr_bits=32 encoding=(none)
[8] INT 'unsigned long' size=8 bits_offset=0 nr_bits=64 encoding=(none)
[9] ARRAY '(anon)' type_id=8 index_type_id=7 nr_elems=6
[10] INT 'char' size=1 bits_offset=0 nr_bits=8 encoding=SIGNED
[11] ARRAY '(anon)' type_id=10 index_type_id=7 nr_elems=0
[12] STRUCT 'trace_event_raw_sys_enter' size=64 vlen=4
        'ent' type_id=5 bits_offset=0
        'id' type_id=6 bits_offset=64
        'args' type_id=9 bits_offset=128
        '__data' type_id=11 bits_offset=512
[13] PTR '(anon)' type_id=12
[14] FUNC_PROTO '(anon)' ret_type_id=2 vlen=1
        'ctx' type_id=13
💡 To embed BTF information into the eBPF application binary, clang must be invoked with the -g flag. You don’t see it explicitly because go generate runs bpf2go, which internally invokes clang with the -g flag enabled by default.
Without -g, compiling eBPF programs that use BPF_CORE* helpers fails with:
error: using builtin_preserve_access_index() without -g
Detailed explanation of the BTF output
Each numbered entry corresponds to a type definition: integers, arrays, structs, pointers, function prototypes, and so on.
For example:
[1] FUNC 'handle_execve_tp'– defines a global function namedhandle_execve_tp.[14] FUNC_PROTO– says this function returns an int(type_id=2)and takes one parameter called ctx.[13] PTR → [12] STRUCT 'trace_event_raw_sys_enter'– the ctx argument is a pointer to atrace_event_raw_sys_enter struct.[12] STRUCT 'trace_event_raw_sys_enter'– represents the syscall-enter tracepoint data:ent→ a trace_entry header ([5]) with fields liketype,flags,preempt_count,pid.id→ syscall ID (long).args→ array of six unsigned long values (syscall arguments).__data→ flexible array for extra data.
[2]–[11]– supporting integer and array type definitions used to build the structs.
Well, this is quite a lot to take it, but what it really shows is the BTF (BPF Type Format) description of kernel structures/types your program is working with.
And for your eBPF program to work across kernel versions—where struct layouts may differ—the target kernel must also be compiled with BTF support. Without it, the program won’t be able to resolve the correct fields offsets at runtime.
Still confused?
💡 The BTF data shown above is only a metadata record of kernel structs and their layout that our eBPF program uses. While the BTF information from the target kernel is different and can be inspected (on the target kernel) with:
sudo bpftool btf dump file /sys/kernel/btf/vmlinux
[1] FUNC_PROTO '(anon)' ret_type_id=0 vlen=0
[2] FUNC 'verify_cpu' type_id=1 linkage=static
[3] FUNC 'sev_verify_cbit' type_id=1 linkage=static
[4] INT 'long unsigned int' size=8 bits_offset=0 nr_bits=64 encoding=(none)
[5] CONST '(anon)' type_id=4
[6] ARRAY '(anon)' type_id=4 index_type_id=21 nr_elems=2
[7] PTR '(anon)' type_id=9
[8] INT 'char' size=1 bits_offset=0 nr_bits=8 encoding=SIGNED
[9] CONST '(anon)' type_id=8
[10] INT 'unsigned int' size=4 bits_offset=0 nr_bits=32 encoding=(none)
[11] CONST '(anon)' type_id=10
[12] INT 'signed char' size=1 bits_offset=0 nr_bits=8 encoding=SIGNED
[13] TYPEDEF '__u8' type_id=14
...
Why is this necessary?
When your eBPF program is loaded by a BPF loader like libbpf, the loader compares the program’s BTF data with the target kernel’s BTF.
And since it's quite likely your program won't only run on the kernel it was compiled on, the loader needs to resolve types, updates offsets, and adjusts field accesses to ensure the program reads kernel structures correctly.
This process is known as field offset relocation.
Although most eBPF kernels nowadays support BTF, it's not really something we can rely on when we want to design truly portable eBPF programs.
How to check if your kernel is compiled with BTF support?
You can verify this using:
grep CONFIG_DEBUG_INFO_BTF /boot/config-$(uname -r)
CONFIG_DEBUG_INFO_BTF=y
In case it doesn’t, then you have two options:
- Re-compile the kernel with the
CONFIG_DEBUG_INFO_BTF=yoption or upgrade the kernel, which is time-consuming, inconvenient — especially if the machine is in production. - Or better, provide the BTF information of that specific kernel alongside your program. We'll talk about this in the next tutorial
But can we do something to avoid this dependency?
Actually—yes, but we'll cover that in the next tutorial.
If you haven’t checked it yet, the code in labs/lab2 provides portable versions of Tracepoint, Raw Tracepoint, kprobe, fprobe and BTF-Enabled Raw Tracepoint eBPF programs for capturing execve syscall events.
⭐️ Extra Insight ⭐️
To one’s surprise, you don't always need to use BPF_CORE_* helpers to do CO-RE-relocatable reads.
BTF-Enabled Raw Tracepoint allow you to directly access kernel memory.
SEC("tp_btf/sys_enter")
int handle_execve_btf(u64 *ctx) {
    long int syscall_id = (long int)ctx[1];
    if (syscall_id != 59)
        return 0;

    struct pt_regs *regs = (struct pt_regs *)ctx[0]; // No need to use BPF_CORE_READ helper
    char *filename = (char *)PT_REGS_PARM1(regs); // No need to use PT_REGS_PARM1_CORE helper
    char buf[ARGSIZE];
    bpf_probe_read_user_str(buf, sizeof(buf), filename); // No need to use bpf_core_read_user_str helper

    bpf_printk("BTF-enabled tracepoint (CO-RE) triggered for execve syscall with parameter filename: %s\n", buf);
    return 0;
}
This makes the BTF-enabled tracepoint slightly more convenient to develop compared to the raw and regular tracepoints.
About the Author
Writes about
Frequently covers