Kubernetes Debugging with DebugBox: Right-Sized Containers for Every Scenario
Prerequisites
This tutorial assumes familiarity with kubectl and basic pod debugging concepts, specifically kubectl debug for attaching ephemeral containers and running standalone debug pods. If either is new, the Kubernetes documentation on debugging running pods and the ephemeral containers concept page cover the background needed before starting.
What You Will Learn
By the end of this tutorial, you will know:
- When to reach for each DebugBox variant based on what the task actually requires
- How to attach an ephemeral container to a running pod with
kubectl debug - How to use a standalone debug pod when Linux capabilities are needed
- What shell helpers are available in each variant and how to invoke them
The Problem with Monolithic Debugging Images
The dominant option for Kubernetes debugging is netshoot. It is comprehensive and well-maintained. It is also 202 MB, and you pull all 202 MB whether you need dig or tshark.
On edge clusters, metered connections, or environments with registry pull rate limits, that overhead adds up across teams and incidents.
DebugBox solves this with a tiered variant model:
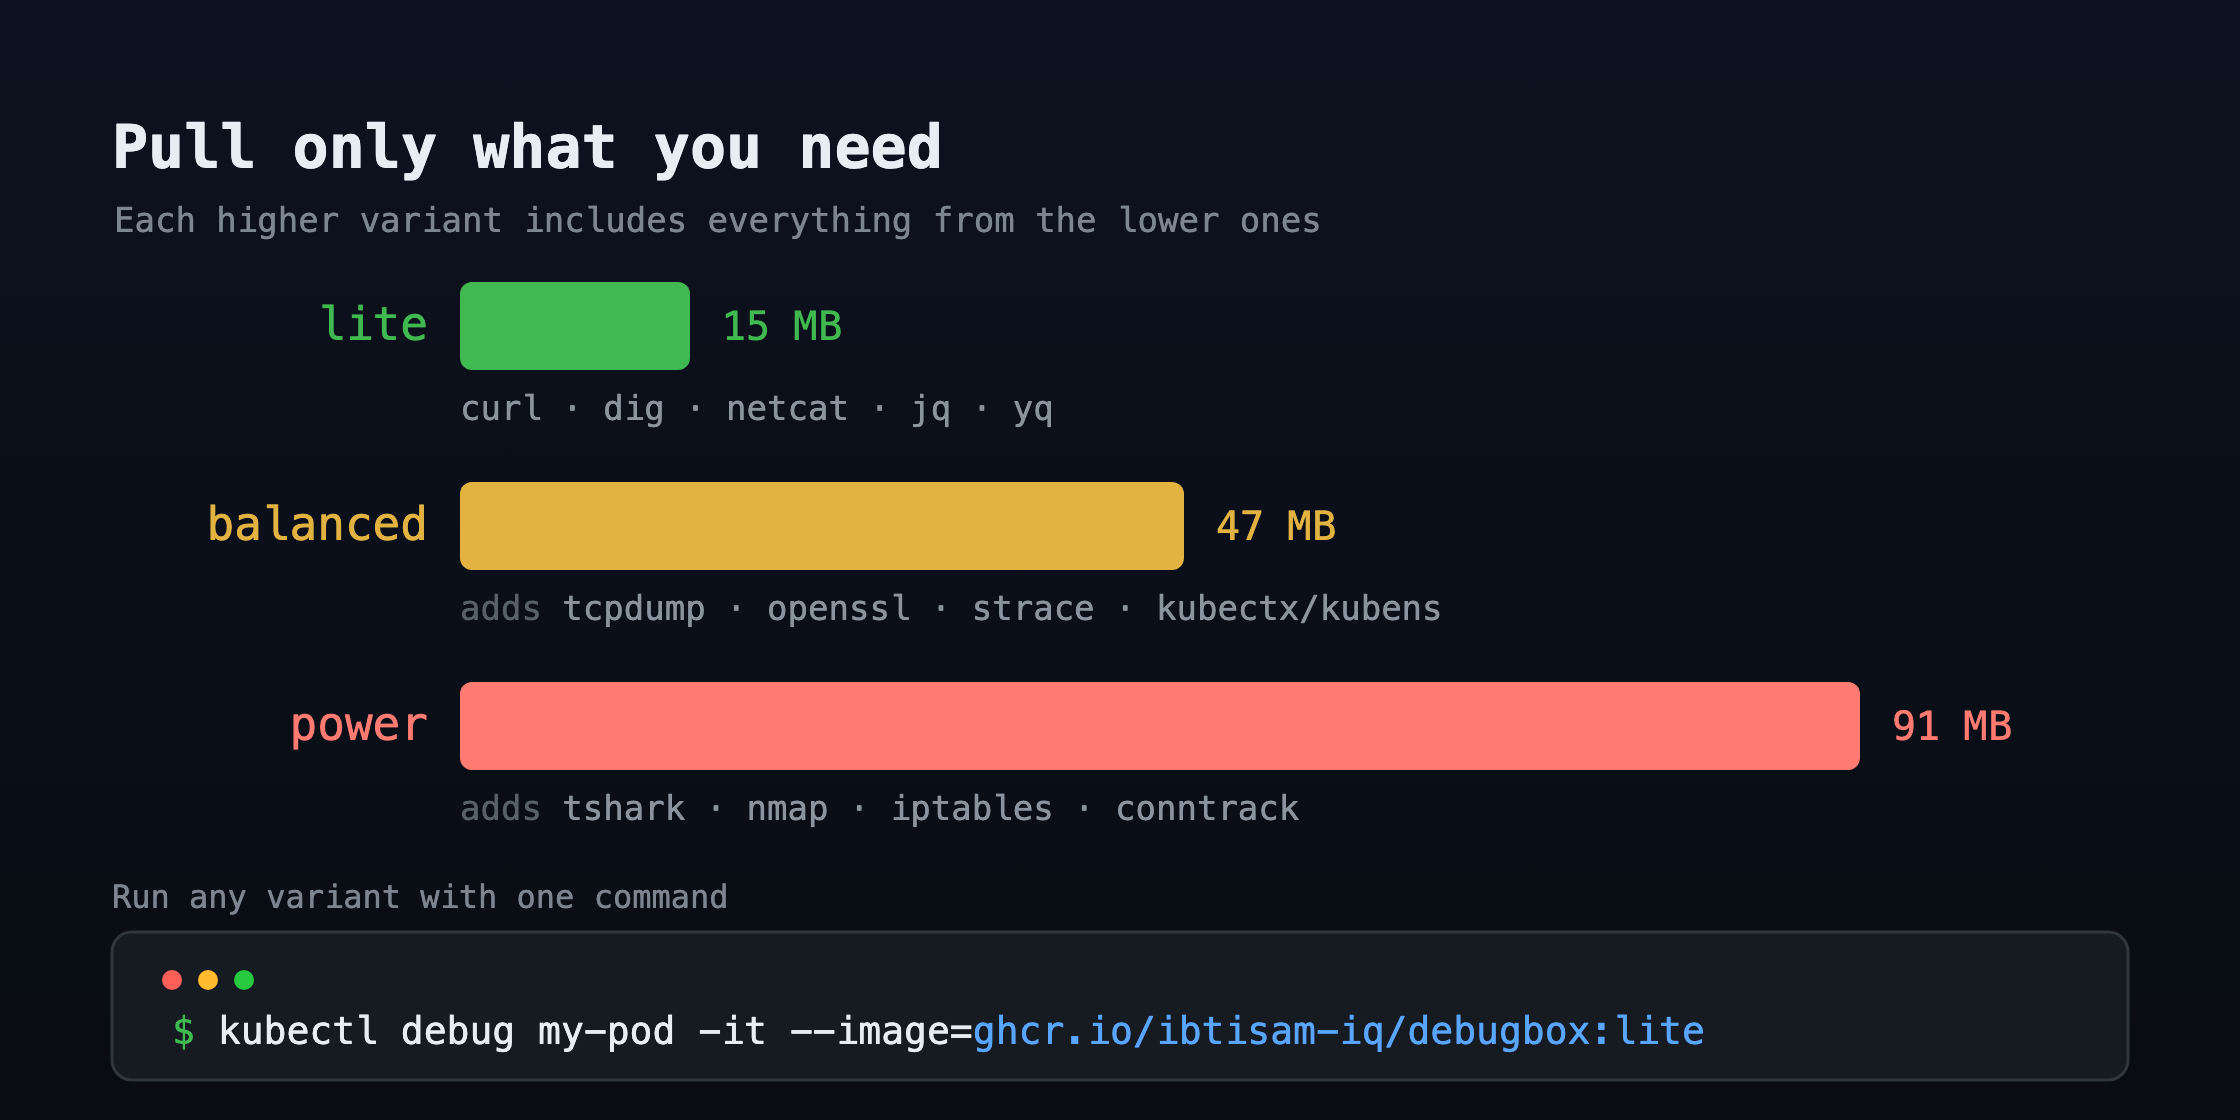
All variants run as root by design. All are multi-arch (amd64 + arm64), published to both GHCR and Docker Hub, and Trivy-scanned on every release with a hard-fail on HIGH/CRITICAL findings.
The Sample Application
The playground pre-deploys two workloads into the debug-demo namespace:
- frontend: a portfolio site (
ghcr.io/ibtisam-iq/ibtisam-iq:latest) serving on port 8080 - backend: an httpbin API server (
kennethreitz/httpbin) serving on port 80
These two services give us realistic targets: an HTTP frontend to probe for connectivity, and a JSON API backend to inspect with data tools.
Confirm both pods are running:
kubectl get pods -n debug-demo
Part 1: Debugging with Lite
Lite is for fast, targeted checks where pull speed matters more than tool breadth.
Networking: curl, netcat-openbsd, iproute2, iputils, bind-tools (dig / nslookup / host)
Data: jq, yq (Alpine apk version)
Shell: ash. Helpers: json() (pretty-print JSON), yaml() (pretty-print YAML)
When to use lite
- DNS resolution check from inside a pod's network namespace
- HTTP endpoint reachability (does pod A reach service B on its actual port?)
- Verifying network policy behavior
- Inspecting JSON or YAML from a config map or API response
Attaching an ephemeral container
Get the name of the frontend pod:
FRONTEND_POD=$(kubectl get pod -n debug-demo -l app=frontend -o jsonpath='{.items[0].metadata.name}')
echo $FRONTEND_POD
Attach a lite ephemeral container targeting the frontend's network namespace:
kubectl debug $FRONTEND_POD -n debug-demo -it \
  --image=ghcr.io/ibtisam-iq/debugbox:lite \
  --target=frontend \
  -- ash -l
--target=frontend shares the network namespace of the frontend container. DNS, routing, and network interfaces are seen from the same perspective as the running application. This is the correct way to reproduce "what the app sees."
Exercise 1: DNS check
From inside the ephemeral container, verify the backend service resolves:
dig backend.debug-demo.svc.cluster.local
You should see an ANSWER SECTION with the ClusterIP of the backend service. Exit the container when done.
Exercise 2: HTTP reachability check
The frontend serves on port 8080. Attach to the frontend pod's network namespace and use curl and json() from the same session:
FRONTEND_POD=$(kubectl get pod -n debug-demo -l app=frontend -o jsonpath='{.items[0].metadata.name}')

kubectl debug $FRONTEND_POD -n debug-demo -it \
  --image=ghcr.io/ibtisam-iq/debugbox:lite \
  --target=frontend \
  -- ash -l
Inside the shell:
# Check frontend response headers (hitting localhost because we share the network namespace)
curl -si http://localhost:8080

# Inspect backend JSON response using the json() helper
curl -s http://backend.debug-demo.svc.cluster.local/json | json

exit
The json() helper pipes output through jq with color. The yaml() helper does the same for YAML via yq.
When lite is not enough
If you need to capture packets, inspect TLS certificates, trace system calls, or switch Kubernetes contexts, move to balanced.
Part 2: Debugging with Balanced
Balanced is the daily driver. It covers what most debugging sessions actually need.
Shell and UX: bash, bash-completion, less
Editors: vim
HTTP and TLS: openssl (curl inherited from lite)
Version control: git
Filesystem: file, tar, gzip
Networking: tcpdump, socat, mtr
System: htop, strace, lsof, procps, psmisc
Kubernetes: kubectx, kubens
Shell: bash. Helpers: json(), yaml(), ports() (ss -tulnp), connections() (ss -tunap), routes() (ip route show), k8s-info() (current context + namespace), sniff() (tcpdump on all interfaces), sniff-http() (HTTP traffic on ports 80/443), sniff-dns() (DNS queries on port 53), cert-check() (TLS certificate chain via openssl)
Attaching balanced
BACKEND_POD=$(kubectl get pod -n debug-demo -l app=backend -o jsonpath='{.items[0].metadata.name}')

kubectl debug $BACKEND_POD -n debug-demo -it \
  --image=ghcr.io/ibtisam-iq/debugbox:balanced \
  --target=backend \
  -- bash -l
Exercise 3: Inspect listening ports
Inside the balanced container, run the ports helper:
ports
This runs ss -tulnp and shows every socket the backend process has open.
Exercise 4: Capture DNS traffic live
sniff-dns runs tcpdump -i any -n -s 0 'port 53'.
tcpdump requires CAP_NET_RAW. Ephemeral containers inherit the target pod's security context. If the pod does not grant NET_RAW, tcpdump will fail with "socket: Operation not permitted". Use the balanced debug pod from Exercise 5 instead: it requests NET_RAW explicitly in its pod spec.
In terminal one, enter the debug container interactively and start the capture:
BACKEND_POD=$(kubectl get pod -n debug-demo -l app=backend -o jsonpath='{.items[0].metadata.name}')

kubectl debug $BACKEND_POD -n debug-demo -it \
  --image=ghcr.io/ibtisam-iq/debugbox:balanced \
  --target=backend \
  -- bash -l
sniff-dns
tcpdump prints a warning about promiscuous mode on the any device. This is expected and the capture still works.
In terminal two on dev-machine, attach a second ephemeral container to the same backend pod so the DNS query comes from the same network namespace:
BACKEND_POD=$(kubectl get pod -n debug-demo -l app=backend -o jsonpath='{.items[0].metadata.name}')

kubectl debug $BACKEND_POD -n debug-demo \
  --image=ghcr.io/ibtisam-iq/debugbox:lite \
  --target=backend \
  -- ash -c 'dig frontend.debug-demo.svc.cluster.local'
Terminal two returns to the prompt immediately: the ephemeral container ran the query and exited. The dig output does not appear in terminal two. Watch terminal one: you will see the A query and its response appear in the capture.
The key is --target=backend: both containers share the same network namespace, so the DNS query from terminal two travels over the same eth0 that terminal one is capturing.
A pod in a different network namespace (like one created with kubectl run) generates DNS traffic on its own eth0; that traffic is never visible to tcpdump running in another pod's namespace. The --target flag is what makes the capture meaningful.
Press Ctrl+C in terminal one to stop the capture, then exit to leave the container.
Exercise 5: Debug pod with NET_RAW (balanced)
When the target pod's security context does not grant NET_RAW, deploy a standalone balanced debug pod that requests it:
kubectl apply -n debug-demo -f \
  https://raw.githubusercontent.com/ibtisam-iq/debugbox/main/examples/balanced-debug-pod.yaml

kubectl wait -n debug-demo pod/debug-balanced --for=condition=ready --timeout=60s

kubectl exec -n debug-demo -it debug-balanced -- bash -l
From inside the pod, sniff-dns, sniff, and sniff-http all work because NET_RAW is granted in the pod spec. The -l flag is required to source the login profile that loads the shell helpers. Run sniff-dns here and use the terminal two technique from Exercise 4 to confirm the capture works.
Exercise 6: Inspect a TLS certificate
The cert-check() function wraps openssl s_client to inspect the full certificate chain for any TLS endpoint. Pass a hostname and port as the two arguments:
cert-check <hostname> <port>
BACKEND_POD=$(kubectl get pod -n debug-demo -l app=backend -o jsonpath='{.items[0].metadata.name}')

kubectl debug $BACKEND_POD -n debug-demo -it \
  --image=ghcr.io/ibtisam-iq/debugbox:balanced \
  --target=backend \
  -- bash -l
cert-check kubernetes.default.svc.cluster.local 443
exit
The output shows the subject, issuer, validity period, and SAN entries for the certificate. The Kubernetes API server is always reachable from any pod and always serves TLS, making it a reliable in-cluster target.
Exercise 7: Trace system calls
strace can trace a process it spawns directly. This produces guaranteed output. You control the process, so you know network syscalls will be made:
BACKEND_POD=$(kubectl get pod -n debug-demo -l app=backend -o jsonpath='{.items[0].metadata.name}')

kubectl debug $BACKEND_POD -n debug-demo -it \
  --image=ghcr.io/ibtisam-iq/debugbox:balanced \
  --target=backend \
  -- bash -lc 'strace -e trace=network -c curl -s http://backend.debug-demo.svc.cluster.local/json -o /dev/null'
-e trace=network filters to network syscalls only. -c prints a summary table on exit showing each syscall, how many times it was called, and total time spent. You will see socket, connect, sendto, and recvfrom entries from the curl request.
strace requires SYS_PTRACE. If the target pod's security context drops it, you will see "Operation not permitted". Use lsof and ss for lighter process inspection that does not require ptrace.
When balanced is not enough
If you need protocol-level packet dissection, port scanning, bandwidth measurement, or firewall rule inspection, move to power.
Part 3: Debugging with Power
Power carries tools that most sessions never need, but that are critical when they are needed.
Network scanning: nmap, nmap-nping, nmap-scripts
Network performance: iperf3, ethtool, iftop
Deep packet analysis: tshark, ngrep, tcptraceroute, fping
System internals: ltrace
Firewall and routing: iptables, nftables, conntrack-tools
Data: yq (pinned upstream binary, SHA-verified on each release, not the apk version)
Shell: bash. Adds over balanced: conntrack-watch() (list active conntrack entries, requires NET_ADMIN)
Why power requires a debug pod
Several power tools require Linux capabilities beyond what ephemeral containers typically hold:
| Tool | Required Capability |
|---|---|
| tshark | NET_ADMIN, NET_RAW |
| iptables | NET_ADMIN |
| nftables | NET_ADMIN |
| conntrack-tools | NET_ADMIN |
The power debug pod example requests both without enabling privileged mode:
securityContext:
  privileged: false
  capabilities:
    add:
    - NET_ADMIN
    - NET_RAW
Exercise 8: Deploy the power debug pod
kubectl apply -n debug-demo -f \
  https://raw.githubusercontent.com/ibtisam-iq/debugbox/main/examples/power-debug-pod.yaml

kubectl wait -n debug-demo pod/debug-power \
  --for=condition=ready --timeout=60s
Exercise 9: Protocol dissection with tshark
Exec into the power pod with a login shell:
kubectl exec -n debug-demo -it debug-power -- bash -l
debug-power has its own network namespace. tshark captures traffic that goes through this pod's network stack, which means traffic generated FROM this pod. curl is available in power (inherited from lite), so we use it to generate the HTTP requests and capture them in the same session.
Start tshark in the background, generate five requests to both services, then bring tshark back to the foreground:
tshark -i any -f 'tcp port 8080 or tcp port 80' \
  -Y 'http.request or http.response' \
  -T fields \
  -e http.request.method \
  -e http.request.uri \
  -e http.response.code \
  2>/dev/null &

sleep 1

for i in $(seq 1 5); do
  curl -s http://frontend.debug-demo.svc.cluster.local:8080/ > /dev/null
  curl -s http://backend.debug-demo.svc.cluster.local/json > /dev/null
  sleep 1
done

fg
Press Ctrl+C to stop tshark. With -T fields, tshark prints one row per packet: the request packet shows method and URI, the response packet shows URI and status code. You get two rows per HTTP exchange. Raw tcpdump gives you bytes; tshark gives you meaning.
Save to a pcap file for Wireshark
tshark -i any -f 'tcp port 8080' -w /tmp/capture.pcap
Copy to your local machine:
kubectl cp debug-demo/debug-power:/tmp/capture.pcap ./capture.pcap
Exercise 10: Inspect the conntrack table
conntrack-watch() is a power-only shell helper that prints a snapshot of the active conntrack table. It runs conntrack -L -o extended and returns immediately.
In a standard Kubernetes application pod, conntrack -L typically shows 0 entries. Connection tracking for cluster traffic happens in the host network namespace where kube-proxy manages NAT, not inside the pod's own network namespace. conntrack-watch produces meaningful output when the pod itself has custom iptables DNAT or SNAT rules: network gateway pods, proxy appliances, or pods running a software load balancer. In those setups, each tracked connection appears as an entry with source, destination, protocol state, and remaining timeout.
Enter the pod with a login shell:
kubectl exec -n debug-demo -it debug-power -- bash -l
Run conntrack-watch to snapshot the table:
conntrack-watch
In a cluster where the pod's network namespace has active NAT rules, you will see entries like:
tcp 6 86390 ESTABLISHED src=10.244.1.5 dst=10.96.0.1 sport=43210 dport=443 ...
If the output shows 0 flow entries have been shown, the pod's network namespace has no conntrack-tracked flows, which is normal for a standard application pod in most CNI setups.
Choosing the Right Variant
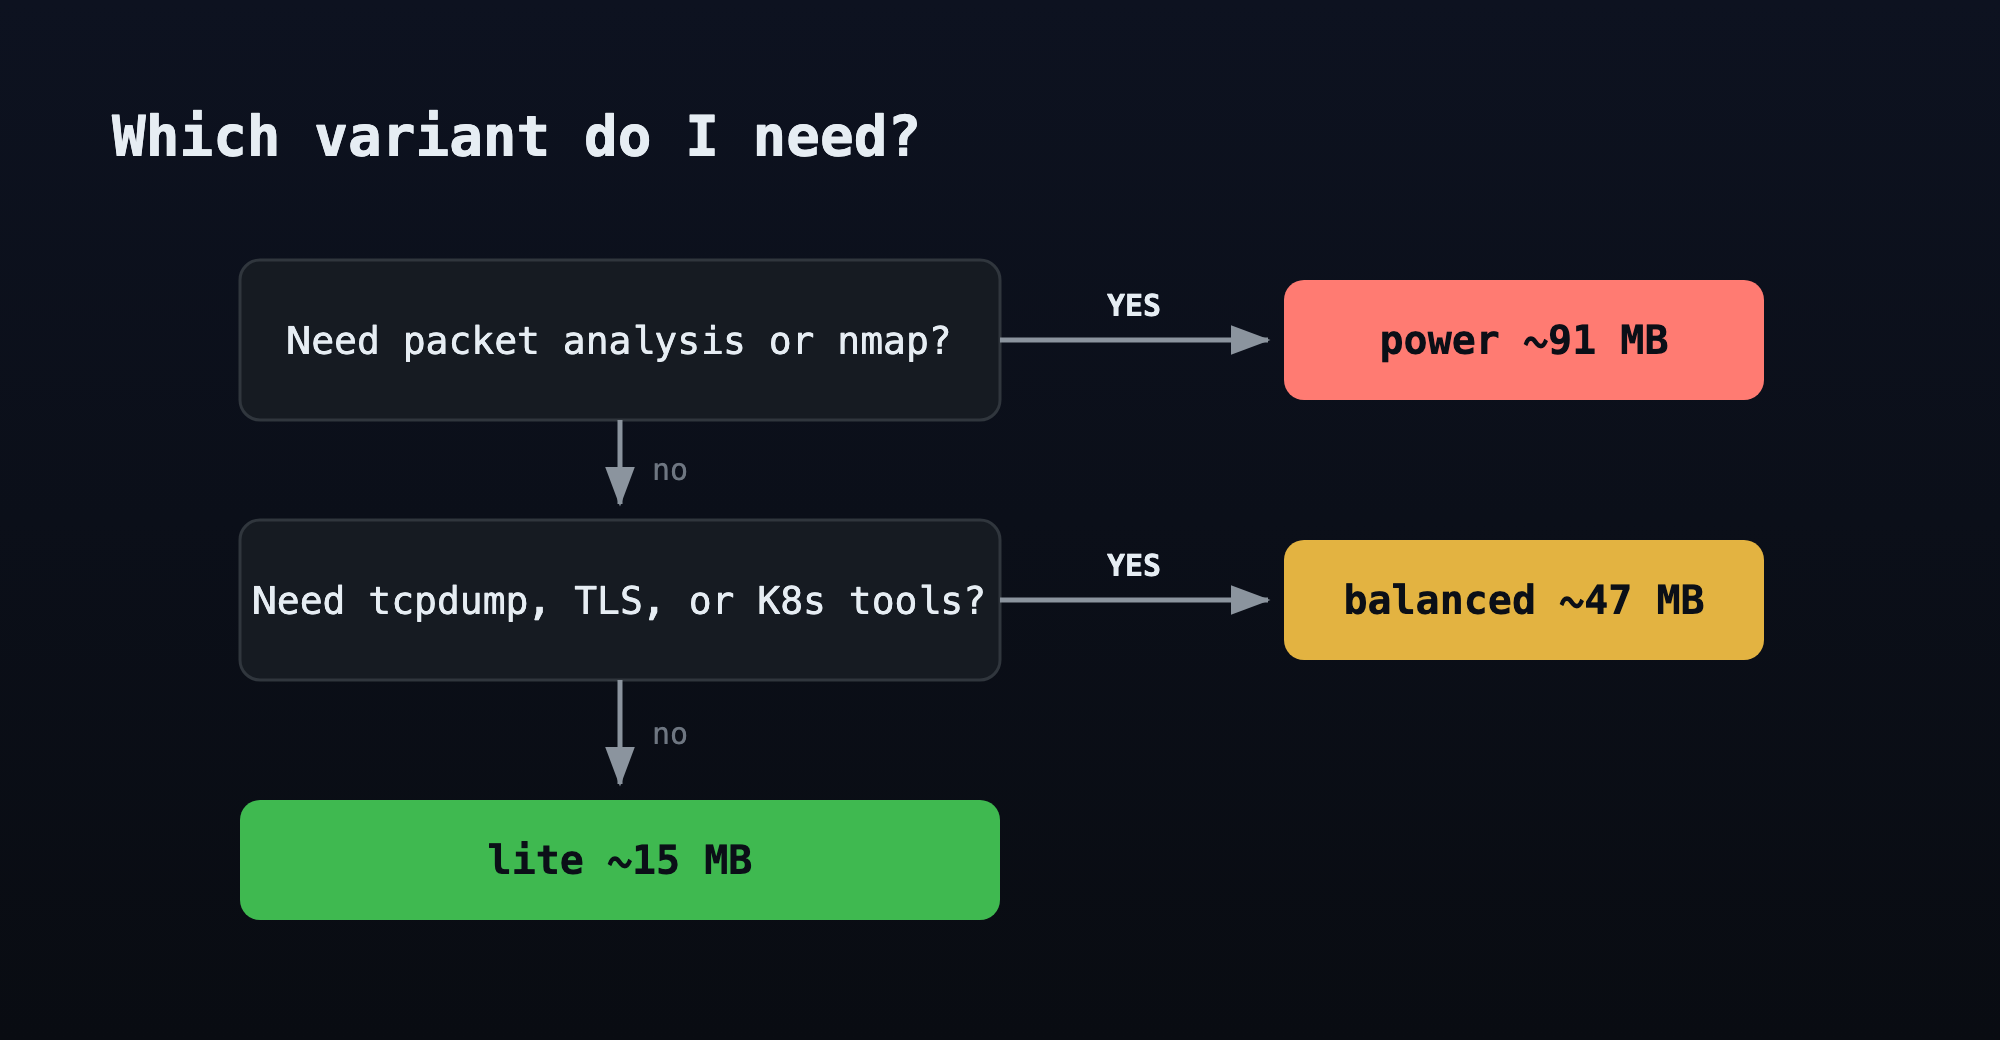
When the task is unclear, balanced is the right default. At 47 MB it handles the majority of real-world debugging sessions without the capability requirements that power tools introduce.
Full tool inventory by variant
All variants (from base)
ca-certificates
Shell: ash. Helpers: ll() (ls -alF)
Lite (~15 MB)
Networking: curl, netcat-openbsd, iproute2, iputils, bind-tools
Data: jq, yq (apk)
Shell: ash. Helpers: json(), yaml()
Balanced (~47 MB) adds over lite
Shell and UX: bash, bash-completion, less
Editors: vim
HTTP and TLS: openssl
Version control: git
Filesystem: file, tar, gzip
Networking: tcpdump, socat, mtr
System: htop, strace, lsof, procps, psmisc
Kubernetes: kubectx, kubens
Shell: bash. Helpers: ports(), connections(), routes(), k8s-info(), sniff(), sniff-http(), sniff-dns(), cert-check()
Power (~91 MB) adds over balanced
Network scanning: nmap, nmap-nping, nmap-scripts
Network performance: iperf3, ethtool, iftop
Deep packet analysis: tshark, ngrep, tcptraceroute, fping
System internals: ltrace
Firewall and routing: iptables, nftables, conntrack-tools
Data: yq (pinned upstream binary, replaces apk version)
Shell: bash. Helpers: conntrack-watch()
Image References
# GHCR
ghcr.io/ibtisam-iq/debugbox:lite
ghcr.io/ibtisam-iq/debugbox:balanced
ghcr.io/ibtisam-iq/debugbox:power

# Docker Hub (mirror)
docker.io/mibtisam/debugbox:lite
docker.io/mibtisam/debugbox:balanced
docker.io/mibtisam/debugbox:power

# Pinned version tags
ghcr.io/ibtisam-iq/debugbox:balanced-1.2.0
Cleanup
kubectl delete namespace debug-demo
Where to Go Next
- Source and Dockerfiles: github.com/ibtisam-iq/debugbox
- Full documentation: debugbox.ibtisam-iq.com
- Tool manifest (authoritative list per variant): docs/manifest.yaml
- Example pod manifests: examples/
About the Author

Muhammad Ibtisam
DevOps and cloud engineer. CKA and CKAD. Author of DebugBox, a Kubernetes debugging container in three size-scoped variants. This platform has been my working environment since August 2025: I build here, I learn here, I test here. Kubernetes clusters for whatever I am trying out, and my own Linux machine for everything else, a rootfs image with my tools already baked in, so there is nothing to set up and no reason to SSH out from my Mac. The work that holds up gets published here as playgrounds and tutorials.
Writes about
Frequently covers
More tutorials you might like
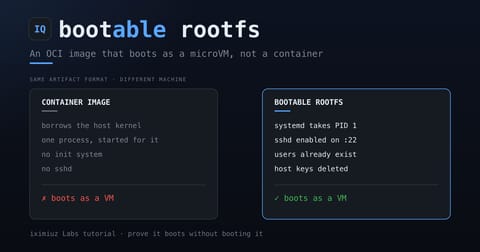
Build a Custom Rootfs Image That Boots as a microVM, Not a Container
A container image and a bootable root filesystem are not the same artifact. This tutorial builds both from the same Dockerfile so you can see exactly where they diverge: what a plain ubuntu:24.04 is missing, the five requirements an iximiuz Labs playground rootfs has to satisfy, and how to prove an image would boot without being able to boot it. Ends with the same image built the easy way, from the official rootfs base.
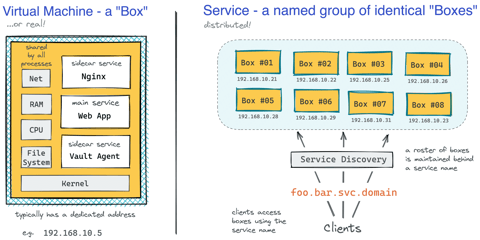
How Kubernetes Reinvented Virtual Machines - In a Good Sense
How Virtual Machines were used to deploy services. What old problems containers solve and what new problems create. How Kubernetes used containers to recreate Virtual Machines in a better way?

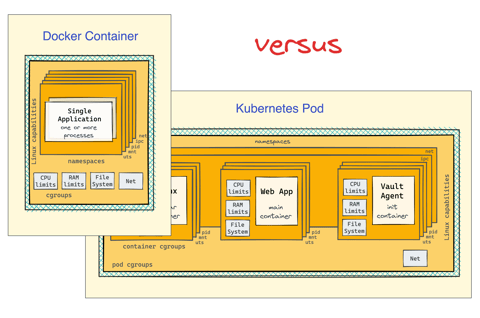
Docker Containers vs. Kubernetes Pods - Taking a Deeper Look
Can a Kubernetes Pod be created with plain Docker commands? Learn the difference between Containers and Pods by exploring how they are implemented under the hood.
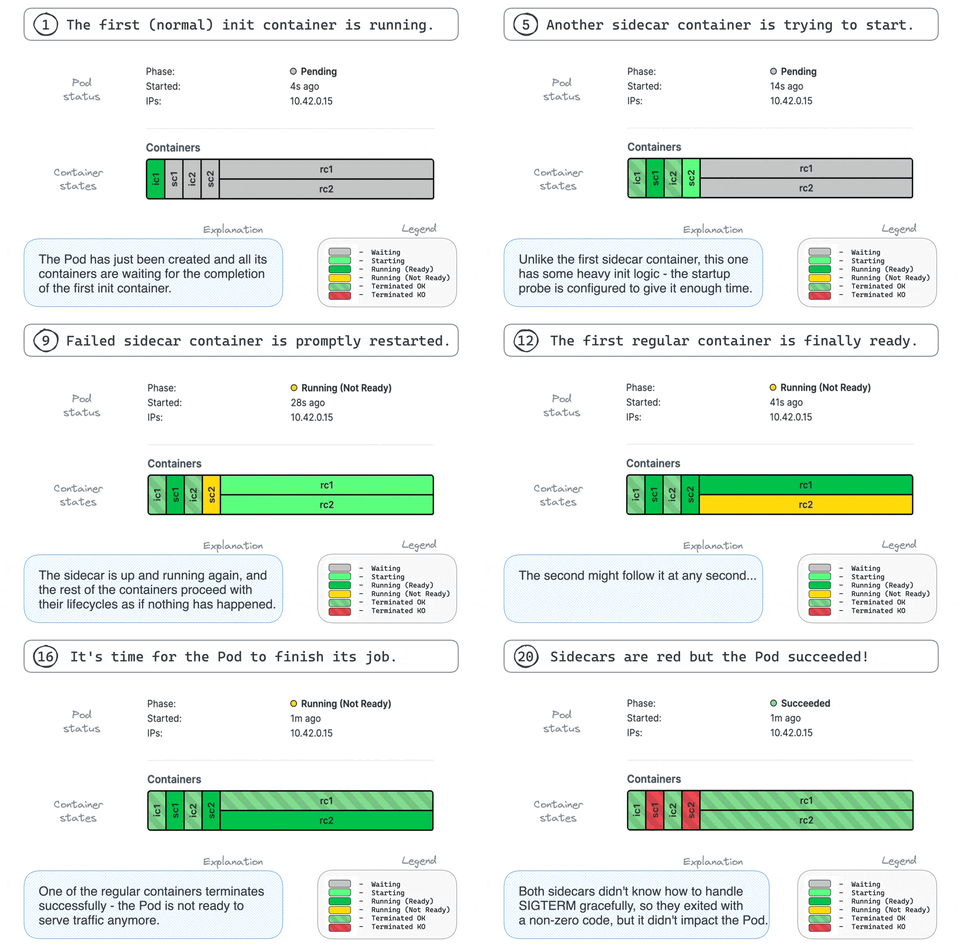
Making Sense Out of Native Sidecar Containers in Kubernetes
Understand the "native" sidecar containers, learn their difference from regular and init containers and discover their advantages in this focused and highly practical tutorial.
Learn by doing, not just by reading or watching
Sign up for a free account to start a VM playground right on this page, track your progress, and get notified about new learning materials.