eBPF Tracepoints, Kprobes, or Fprobes: Which One Should You Choose?

It is safe to say that almost all eBPF programs can capture and send kernel event data to user space applications.
However, eBPF tracing program types like kprobes, fprobes, and tracepoints are often preferred because they hook into kernel functions or events with access to rich, actionable data for tasks like performance monitoring or syscall argument tracing.
But their overlapping functionality can make choosing the right one confusing.
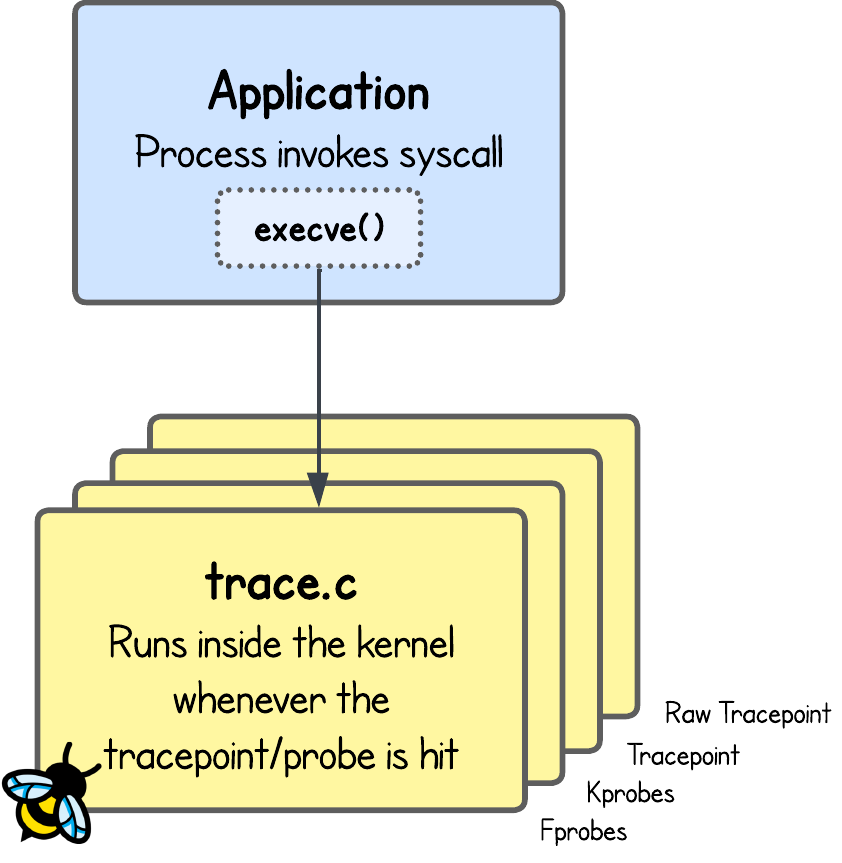
In this tutorial, we’ll look at a few different eBPF tracing program types that all capture execve syscall events, and then compare their strengths and trade-offs. The code lives for this lab is in the labs/lab1 directory.
I’ll walk you through the details step by step—but you can also try things out anytime by building and running the program yourself:
go generate
go build
sudo ./lab1
Then, open a new terminal tab and inspect the eBPF logs to see which kernel events these hook points capture:
sudo bpftool prog trace
eBPF Tracepoint
eBPF tracepoint programs attach to predefined hook points in the Linux kernel. These hook points are defined in the kernel source code with a TRACE_EVENT macro. Once attached, an eBPF program runs its custom logic whenever the kernel hits the corresponding tracepoint.
More information on TRACE_EVENT macro
TRACE_EVENT is the generic macro for defining custom tracepoints in the kernel, while TRACE_EVENT_SYSCALL is a specialized variant for syscalls through which eBPF Tracepoint hook are created.
In fact, there is NO static sys_enter_execve tracepoint defined in the kernel.
Instead, per-syscall tracepoints are generated at build time using the TRACE_EVENT_SYSCALL template in include/trace/events/syscalls.h and syscall metadata from the architecture’s syscall tables like arch/x86/entry/syscalls/syscall_64.tbl. This generation is handled by code in kernel/trace/trace_syscalls.c to produce an entry tracepoint like sys_enter_execve to which eBPF can then attach to.
For example, the sys_enter_execve tracepoint fires when a process calls execve, exposing the program name and arguments. This makes it useful for tasks such as auditing, security monitoring, or analyzing user activity.
You can find all events that eBPF tracepoints can hook onto, using:
sudo cat /sys/kernel/debug/tracing/available_events
drm:drm_vblank_event
drm:drm_vblank_event_queued
drm:drm_vblank_event_delivered
...
syscalls:sys_exit_execveat
syscalls:sys_enter_execveat
syscalls:sys_exit_execve
syscalls:sys_enter_execve # <- here is our tracepoint
syscalls:sys_exit_pipe
...
The output format is in the form <category>:<name>.
Using the category and the name, you can then view the input arguments for each tracepoint by printing the contents of /sys/kernel/debug/tracing/events/<category>/<name>/format.
sudo cat /sys/kernel/debug/tracing/events/syscalls/sys_enter_execve/format
name: sys_enter_execve
ID: 660
format:
        field:unsigned short common_type;           offset:0; size:2; signed:0;
        field:unsigned char common_flags;           offset:2; size:1; signed:0;
        field:unsigned char common_preempt_count;   offset:3; size:1; signed:0;
        field:int           common_pid;             offset:4; size:4; signed:1;

        field:int        __syscall_nr;              offset:8;  size:4; signed:1;
        field:const char * filename;                offset:16; size:8; signed:0;
        field:const char *const * argv;             offset:24; size:8; signed:0;
        field:const char *const * envp;             offset:32; size:8; signed:0;

print fmt: "filename: 0x%08lx, argv: 0x%08lx, envp: 0x%08lx", ((unsigned long)(REC->filename)), ((unsigned long)(REC->argv)), ((unsigned long)(REC->envp))
💡 The first four arguments, are actually not accessible by the eBPF code. This is a choice that dates back to the original inclusion of this code. See explaination in commit 98b5c2c65c29.
With this information, you can then define an input context struct that matches the accessible fields and then write your eBPF tracepoint program against it.
...
struct trace_sys_enter_execve {
    short common_type;
    char common_flags;
    char common_preempt_count;
    int common_pid;

    s32 syscall_nr;        // offset=8,  size=4
    u32 pad;               // offset=12, size=4 (pad)
    const u8 *filename;    // offset=16, size=8
    const u8 *const *argv; // offset=24, size=8
    const u8 *const *envp; // offset=32, size=8
};

SEC("tracepoint/syscalls/sys_enter_execve")
int handle_execve_tp_non_core(struct trace_sys_enter_execve *ctx) {
    const char *filename_ptr = (const char *)(ctx->filename);

    u8 buf[ARGSIZE];
    bpf_probe_read_user_str(buf, sizeof(buf), filename_ptr);

    bpf_printk("Tracepoint triggered for execve syscall with parameter filename: %s\n", buf);
    return 0;
}
💡 SEC("tp/xx/yy") and SEC("tracepoint/xx/yy") are equivalent, and you can use either one according to personal preference.
But there are two downsides to this:
- First, tracepoints only exist where kernel developers have added them. If you need visibility into something that is not supported by the listed tracepoints, you either go through the long process of proposing a new tracepoint upstream (and convincing Linus to accept it), or use an alternative technique.
- Second, they’re not always ideal for high-performance use cases — we’ll dig into that shortly.
eBPF Raw Tracepoint
Raw tracepoints may look similar to regular tracepoints, since both correspond to events you can view under /sys/kernel/debug/tracing/available_events. The difference lies in how the kernel passes arguments to them.
For regular tracepoints, the kernel pre-processes the arguments and builds a context struct. In contrast, eBPF raw tracepoints receive their arguments in a raw format via struct bpf_raw_tracepoint_args (defined in vmlinux.h), and the program must interpret them manually.
Because no extra work is done to package fields, raw tracepoints typically run faster with less overhead than regular tracepoints.
Another important difference is that there are no per-syscall raw tracepoints like sys_enter_execve. Instead, only the generic sys_enter and sys_exit tracepoints exist.
What is the difference between sys_enter and sys_exit tracepoint?
💡 sys_enter hooks trigger on every syscall event entry, while sys_exit hooks trigger on its return, capturing the return value of the syscall.
This means that if you want to act on a specific syscall event inside your raw tracepoint eBPF program, you need to filter by syscall ID.
SEC("raw_tracepoint/sys_enter")
int handle_execve_raw_tp_non_core(struct bpf_raw_tracepoint_args *ctx) {
// There is no method to attach a raw_tp directly to a single syscall...
// this is because there are no static defined tracepoints on single syscalls but only on generic sys_enter/sys_exit
// So we have to filter by syscall ID
//
// The arguments of input context struct are defined in TP_PROTO of the tracepoint definition in kernel.
// Ref: https://codebrowser.dev/linux/linux/include/trace/events/syscalls.h.html#20
// In this case it is TP_PROTO(struct pt_regs *regs, long id):
// args[0] -> struct pt_regs *regs
// args[1] -> long id
unsigned long id = ctx->args[1];
if (id != 59) // execve sycall ID
return 0;
struct pt_regs *regs = (struct pt_regs *)ctx->args[0];
const char *filename;
// Intentionally accessing the register (without using PT_REGS_PARM* macro) directly for illustration
bpf_probe_read(&filename, sizeof(filename), ®s->di);
char buf[ARGSIZE];
bpf_probe_read_user_str(buf, sizeof(buf), filename);
bpf_printk("Raw tracepoint triggered for execve syscall with parameter filename: %s\n", buf);
return 0;
}
💡 SEC("raw_tp/xx") and SEC("raw_tracepoint/xx") are equivalent, and you can use either one according to personal preference.
Notice also that we are reading the syscall arguments from CPU registers. On x86-64, the System V ABI defines the first argument in %rdi (regs->di), the second in %rsi, and so on.
...
bpf_probe_read(&filename, sizeof(filename), ®s->di);
...
Since we rely on CPU registers, we need to target our binary for specific system architectures. One way to achieve this is to set a --target flag to the bpf2go command (actually clang internally).
package main

//go:generate go run github.com/cilium/ebpf/cmd/bpf2go -target amd64 trace trace.c

import (
  "log"
eBPF Kernel Probes (kprobes)
Regular and raw eBPF tracepoints might in fact be sufficient for your use case, but their main limitation is that they are limited to a set of predefined hook points in the kernel, disallowing you to trace arbitrary kernel events.
Kprobes alleviate this by allowing dynamic hooks into any kernel function, including within function body, not just at the start or return.
💡 Kernel functions marked with the notrace keyword are exceptions, and kprobes cannot hook them.
Conveniently, you can list all kernel symbols in /proc/kallsyms:
sudo cat /proc/kallsyms | less
ffffffff81000000 T startup_64
ffffffff81000000 T _stext
ffffffff81000000 T _text
ffffffff81000060 T secondary_startup_64
ffffffff81000065 T secondary_startup_64_no_verify
ffffffff81000120 t verify_cpu
...
ffffffff812b7710 T __ia32_sys_execveat
ffffffff812b7780 T __ia32_sys_execve
ffffffff812b77d0 T __x64_sys_execveat
ffffffff812b7840 T __x64_sys_execve # <- Our kernel function
...
💡 If a function is not in /proc/kallsyms, it's likely because is was inlined at compile time. Also verify they are not blacklisted in /sys/kernel/debug/krpobes/blacklist.
SEC("kprobe/__x64_sys_execve")
int kprobe_execve_non_core(struct pt_regs *ctx) {
// On x86-64, the entry wrapper __x64_sys_execve is called with a pointer to struct pt_regs in %rdi -> pt_regs.di
struct pt_regs *regs = (struct pt_regs *)ctx->di;
// Read the filename "from the inner regs"
unsigned long di = 0;
bpf_probe_read_kernel(&di, sizeof(di), ®s->di);
const char *filename = (const char *)di;
char buf[ARGSIZE];
bpf_probe_read_user_str(buf, sizeof(buf), filename);
bpf_printk("Kprobe triggered for execve syscall with parameter filename: %s\n", buf);
return 0;
}
But the issue with kprobes is that you depend on whatever code happens to be in the kernel your system runs and are not assured to be stable across different kernel versions. Functions might exist in certain kernel versions, while not in others, structs can change, rename, or remove a field you are using.
In the upcoming tutorial, we’ll look at how to avoid these kinds of non-portable scenarios. But in general, think of them as a last resort in case none other eBPF program type supports what you are looking for.
💡 The same applies for kretprobes — kernel probes one can attach to the exit of the function.
Also, when we attach a kprobe, it’s similar to inserting a breakpoint in a debugger: the kernel patches the target instruction with one that triggers a debug exception. When this instruction executes, the exception handler calls our probe handler.
And while this mechanism works well, it has a downside.
Each probe hit generates an exception, causing context switches and exception handling. That overhead may be negligible for infrequent probes, but if many probes are attached to “hot” kernel functions, performance can degrade significantly.
Is there some alternative to allow triggering eBPF programs with less overhead? Yes, of course.
Fprobes
As mentioned above, kprobes work by patching an instruction to trigger an exception, which adds context-switch and exception-handling overhead.
Fprobes in contrast build on the ftrace mechanism.
In other words, at each function entry, the compiler emits a NOP instruction that can later be patched at runtime into a jump to an eBPF trampoline. This trampoline invokes the eBPF program as if it were called by the original caller itself, bypassing exceptions and greatly reducing the overhead.
The main (rather small) limitation is that fprobes can only attach at function entry (fentry) and function exit (fexit) points, not at arbitrary instruction offsets like kprobes. However, fentry/fexit probes are flexible in that they can also attach to eBPF programs such as XDP, TC, or cgroup programs.
Why would one ever attach to an eBPF program onto an eBPF XDP, TC or cgroup program?
It may sound unusual, but using fprobes you can trace eBPF programs just like you would trace kernel functions.
For example, I once used an fentry program to measure how frequently different XDP return codes occurred which was helpful while developing an eBPF-based firewall.
I applied the same idea to collect statistics of TC programs return codes.
Additionally, fexit probes have access to the function’s input parameters, something kretprobes cannot provide.
SEC("fentry/__x64_sys_execve")
int fentry_execve(u64 *ctx) {
    struct pt_regs *regs = (struct pt_regs *)ctx[0];

    // x86-64: first arg in rdi -> pt_regs.di
    const char *filename = (const char *)regs->di;
    char buf[ARGSIZE];
    bpf_probe_read_user_str(buf, sizeof(buf), filename);

    bpf_printk("Fentry tracepoint triggered (CO-RE) for execve syscall with parameter filename: %s\n", buf);
    return 0;
}
They do however require at least kernel version 5.5 which might be an issue if you need to support older kernels, at least for now. But otherwise they are mostly superior to kprobes.
💡 For the examples above, I intentionally read the register value using ®s→di, where I could also use PT_REGS_PARM* macro which should be preffered.
Before I let you go, note that there are also BTF-enabled tracepoints, which we’ll briefly cover in the upcoming tutorial alongside an introduction to BTF (BPF Type Format).
About the Author
Writes about
Frequently covers